HAL Id: hal-01895972
https://hal.uca.fr/hal-01895972
Submitted on 16 Oct 2018
HAL is a multi-disciplinary open access
archive for the deposit and dissemination of
sci-entific research documents, whether they are
pub-lished or not. The documents may come from
teaching and research institutions in France or
L’archive ouverte pluridisciplinaire HAL, est
destinée au dépôt et à la diffusion de documents
scientifiques de niveau recherche, publiés ou non,
émanant des établissements d’enseignement et de
recherche français ou étrangers, des laboratoires
HILLCLOUD experiment
Michael J. Flynn, K. N. Bower, T. W. Choularton, Wolfram Wobrock, J. M.
Mäkelä, B. G. Martinsson, Göran Frank, H.-C. Hansson, H. Karlsson, Paolo
Laj
To cite this version:
Michael J. Flynn, K. N. Bower, T. W. Choularton, Wolfram Wobrock, J. M. Mäkelä, et al.. Modelling
cloud processing of aerosol during the ACE-2 HILLCLOUD experiment. Tellus B - Chemical and
Physical Meteorology, Taylor & Francis, 2000, 52 (2), pp.779-800. �hal-01895972�
Modelling cloud processing of aerosol during the ACE-2
HILLCLOUD experiment
By MICHAEL J. FLYNN1*, KEITH N. BOWER1, THOMAS W. CHOULARTON1, WOLFRAM WOBROCK2, JYRKI M. MA¨KELA¨3, BENGT MARTINSSON4, GO¨ RAN FRANK4, HANS-CHRISTEN HANSSON5, HANS KARLSSON5 and PAOLO LAJ6, 1Atmospheric Physics Research Group, Physics Department, University of Manchester Institute of Science and T echnology, PO Box 88, Manchester, M60 1QD, UK;2L aboratoir de Meteorologie Physique, 24, Ave. des L andais, 63177 Aubiere Cedex, France; 3Department of Physics, University of Helsinki, Helsinki, Finland; 4Division Nuclear Physics, University L und, L und, Sweden; 5Institute of Applied Environmental Research, University of Stockholm, Stockholm, Sweden;6Institute of Physics and Chemistry of the L ower and Upper Atmosphere,
Consiglio Nazionale delle Ricerche, Bologna, Italy
(Manuscript received 2 February 1999; in final form 19 October 1999)
ABSTRACT
A numerical model has been used to simulate the conditions observed during the ACE-2 Hillcloud experiment and to study the processes which may be taking place. The model incorpor-ates gas phase chemistry of sulphur and nitrogen compounds upstream of the cloud, and the interaction of aerosol, precursor trace gases and oxidants within the cloud. Gas phase and aerosol inputs to the model have been provided from measurements made in the field. Dynamics of the air flow over the hill consisted of simple prescribed dynamics based on wind speed measurements, and also for some cases modelled dynamics. In this modelling study, it was found that during clean case studies particles down to 40–55 nm diameter were activated to form cloud droplets, the total number of droplets formed ranging from 200 to 400 drops/cm3. Significant modification of the aerosol spectra due to cloud processing was observed. In polluted cases particles down to 65–80 nm diameter were activated to form cloud droplets, the total number of droplets ranging from 800 to 2800 drops/cm3. Modification of the aerosol spectra due to cloud processing was slight. In all cases, changes in the aerosol spectra were due to both the uptake of HNO
3, HCl, NH3 and SO2 from the gas phase, (the SO2 being oxidised to sulphate) and the repartitioning of species such as HNO3, HCl, and NH3from larger particles onto smaller ones. Modelling results have been compared with observations made. Modelled droplet numbers are typically within 20% of the best measured values. The mode of the droplet distribution typically around 10–20mm for clean cases and 4–8 mm for polluted cases was found to be in good agreement with the measured values of 10–25mm for clean cases, but not in such good agreement for polluted cases. Measurements of upwind and interstitial aerosol distribu-tions showed that the smallest particles activated were 30 and 50 nm for clean and polluted cases respectively, slightly smaller than the model values quoted above. Measured upwind and downwind aerosol spectra showed similar modification to that predicted by the model in eight out of the eleven model runs carried out. Chemistry measurements also give general evidence for both the uptake of species from the gas phase, and repartitioning of species from large particles onto smaller ones, though comparisons for individual cases are more difficult. From this modelling study, it can be concluded that in general, in the remote environment the exchange of hydrochloric acid, nitric acid and ammonia between aerosol particles and take up from the * Corresponding author.
e-mail: mccpemf [email protected] Tellus 52B (2000), 2
gas phase in the vicinity of cloud may be a very important mechanism in regulating the evolution of the aerosol spectrum. Further, the much more linear relationship between cloud droplet and accumulation mode aerosol number, which was observed in the measurements made during the ACE-2 HILLCLOUD project is supported by these modelling results. The implications of this for the indirect effect will be explored in future work.
1. Introduction Previous modelling studies include those done
as part of the Great Dun Fell series of experiments, The ACE-2 HILLCLOUD experiment used a where this model was used to predict cloud droplet hill cap cloud forming on the island of Tenerife as number and the aerosol modification caused by a a natural flow through reactor to study the single passage through a hill cap cloud (Bower response of cloud microphysics to the aerosol et al., 1999; Bradbury et al., 1999). It was found properties and gases in the airstream entering the in these studies that the uptake of SO
2 and its cloud and to study processing of aerosol and trace aqueous phase oxidation to sulphate was the gases within the cloud. During the HILLCLOUD dominant factor in determining the evolution of experiment, measurements of gas and aerosol the aerosol spectrum within the cloud.
properties were made at five major sites. Two of In this study, the model is being used to examine these sites, Hidalgo and Taganana were upwind processes taking place in a remote marine environ-of the cloud. Hidalgo is a coastal site located some ment, rather than an environment heavily influ-distance away from the other measurement enced by nearby anthropogenic activities as was sites, the Taganana site is located in the village the case at Great Dun Fell. Air masses arriving at of Taganana, and is immediately upwind of Tenerife, even those originating from Europe the summit measurement site. The other sites during polluted events had travelled over the were located at El Bailadero (summit), Paiba ocean for a number of days, leading to consider-(Downwind), and Izania (free troposphere). A full able ageing of particulate matter in the air mass, description of the HILLCLOUD experiment, and reduction of gas phase concentrations of including details of site locations, measurements species associated with anthropogenic pollution. made, and major results obtained can be found in Further the area is likely to be more heavily the HILLCLOUD overview paper (Bower et al., influenced by natural processes such as production 2000). This paper specifically describes results of SO
2from the oxidation of DMS, and mechan-of modelling work carried out using ACE-2 ical production of aerosol particles from the sea HILLCLOUD field measurements as input. surface.
Cloud processing is a very important mechan- The object of this modelling work was to deter-ism in controlling the growth of aerosol particles mine which processes are important in governing to a size where they may be optically active. evolution of the aerosol spectra under such condi-Uptake of matter from the gas phase is somewhat tions, and to attempt to reproduce microphysical dependant on the surface area of the particles, so properties of the cloud which were observed in for dry aerosol most of the mass is deposited onto the field (Martinsson et al., 2000).
the largest particles. However once particles become activated to form cloud droplets, the spread in particle diameter is much smaller, thus
2. Introduction to the model
matter scavenged from the gas phase is distributed more evenly over all particles. In addition aqueous
The UMIST hill cloud model has been phase chemistry may take place in droplets adding
developed over a number of years to study chem-mass to the particle upon which the drop formed.
ical and physical processes occurring in a hill cap This cloud processing may cause the smallest
cloud. It is a Lagrangian type model which com-particles activated to grow significantly in a much
putes dynamics, microphysics, and chemistry for shorter period of time than would otherwise be
model and applications it has been used for can Reaction rate=PRL×cos(zenith)PRM be found in the literature (Sander et al., 1994;
Bower et al., 1997; Bradbury et al., 1999). ×exp
A
PRNcos(zenith)
B
. (1) Essentially, the model follows a parcel of moistair as it passes over a hill. As the parcel rises it is Here zenith is the solar zenith angle, the angle cooled adiabatically, and becomes supersaturated. between the position of the sun and the normal Droplets form on larger aerosol particles accord- to the surface of the earth ignoring local roughness. ing to the Ko¨hler equation. Gas phase species are The constants PRL, PRM and PRN are species scavenged into droplets and undergo chemical specific and take account of the energy needed for reactions in the aqueous phase. As the air descends the reaction and the effect of the atmosphere on on the other side of the hill droplets evaporate, these photons. At present no parameterisation has and any matter with a low vapour pressure scav- been developed to deal with the effects of cloud enged or generated as a result of aqueous phase cover on photolytic reaction rates.
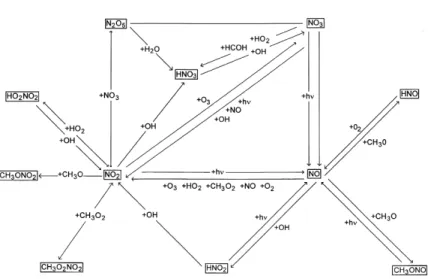
chemistry, adds mass to the aerosol particles upon Fig. 1 illustrates nitrogen chemistry included in which the droplets formed. the model, and Table 1 gives a full list of gas phase reactions included, along with rate constants used.
2.2. Dynamics 2.1. Gas phase
The model follows a parcel of air moving along The gas phase module has undergone
substan-a trsubstan-ajectory, which is csubstan-alculsubstan-ated from its current tial development, and is now designed to run for
position and velocity in the horizontal and vertical an extended period of time before the arrival of
directions. The model interpolates between data the air parcel at the hill and formation of cloud.
points in the trajectory information, and calculates The purpose of this is to model production of SO
2 current height from the vertical velocities. from the oxidation of dimethyl sulphide (DMS).
Dynamics data are obtained from a look-up file, The gas phase module currently consists of two
in which the data provided may be the output sub-modules which may be run separately, one
from flow modelling, or simple prescribed containing reactions specific to the oxidation of
dynamics consisting of fixed horizontal and ver-DMS, the other containing reactions of species
tical velocities based on measurements made in such as NO3, OH, O3 and H2O2. Where trace gas the field. The dynamics module also allows the measurements are available immediately upwind
option of considering entrainment of free-tropo-of cloud these are used in preference to values
spheric air at cloud top. which would be produced by an extended run of
the gas phase model. When measurements are used as input for the model, the module dealing
2.3. Microphysics with general gas phase chemistry is allowed to
continue but the DMS module is disabled. This is The microphysics module is a one-dimensional because the typical time for the passage of air adiabatic growth model. An initial aerosol spec-through the cloud on Tenerife was about five to trum is supplied containing details of particle size, ten minutes, far too short for any significant number, solubility, and the chemical composition production of SO
2from DMS. of soluble material for a number of discrete size As input for this modelling study was based on categories. The initial droplet spectrum at cloud measurements, only the detailed reaction schemes base is obtained from this initial aerosol spectrum for nitrogen and sulphur chemistry, and the pro- and a solution of eq. (2), the Ko¨hler equation duction and destruction of the important oxidants (Wallace and Hobbs, 1997; Pruppacher and Klett, O
3, H2O2, and OH, which were permitted to run 1997) at 99% humidity for each category of will be discussed here. In this reaction scheme input aerosol.
thermal and photolytic reactions are included. The photolytic reaction rates are parameterized in e∞
e s =
A
exp 2s∞ n∞kT rBC
1+ imM w M s(43pr3r∞−m)D
−1 . (2) terms of solar zenith angle according to:Fig. 1. The gas phase nitrogen cycle as included in the model. This reaction schematic is based on the reactions involving nitrogen listed in Table 1.
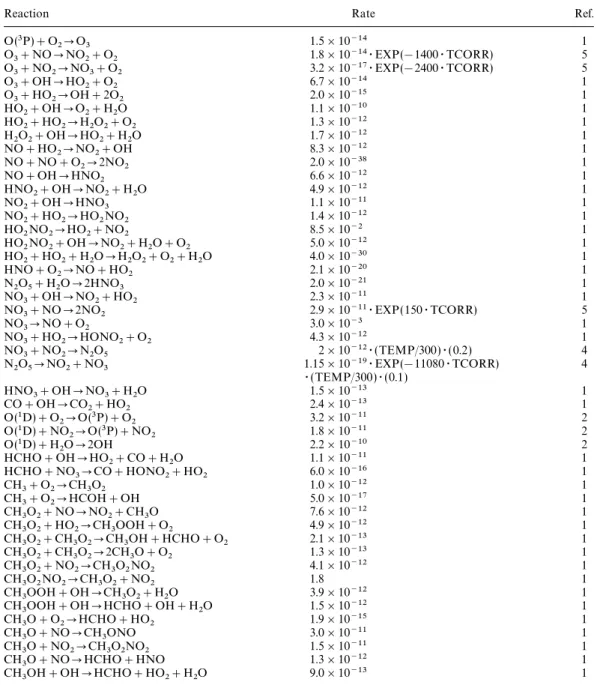
Table 1. All gas phase reactions included in the model except those involved in the oxidation of DMS, since DMS oxidation was switched oV for the present study
(A) Photolytic reactions
Reaction PRL PRM PRN Ref. NO 2+hnNO+O(3P) 1.11×10⁻² 0.397 0.183 3 O 3+hnO(3P)+O2 5.22×10⁻⁴ 0.322 0.079 3 O3+hnO(1D)+O2 8.98×10⁻⁵ 1.486 0.936 3 H2O2+hn2OH 1.06×10⁻⁵ 0.8 0.243 3 HNO 2+hnNO+OH 2.48×10⁻³ 0.431 0.194 3 NO
3+hn0.3NO+0.7NO2+0.7O(3P) 15.5×JNO2 1 HNO
3+hnNO2+OH 1.04×10⁻⁶ 1.371 0.466 1
HCHO+hn2HO2+CO 4.87×10⁻⁵ 0.781 0.349 3
HCHO+hnH2CO 3.3×10⁻³×JNO2 1
CH
3ONO+hnCH3O+NO 0.17×JNO2 1
Here e∞=vapour pressure of air adjacent to a is determined by: droplet of given radius r,s∞ and n∞=surface energy
and number density of water molecules in the dr dt=
1 r
Drv(2)
rl S, (3)
solution respectively, m=mass of salt dissolved in
droplet, i=no. of ions each salt molecule dissoci- where D=diffusion coefficient of water vapour in air as a rate of mass flow across a unit area in the ates into, M
s=molecular mass of salt, Mw=
molecular mass of water. presence of unit vapour density gradient,rv(2)= vapour density a large distance from the droplet, The spectrum evolves as the parcel passes over
the hill and becomes supersaturated with some rl =density of the liquid.
Growth by coagulation of droplets, and forma-particles activating as determined by eq. (2) to
form cloud droplets. As the air continues to rise, tion of precipitation is not included in this model. The justification for this is that the time scale for supersaturation increases, and activated droplets
Table 1 (cont’d)
(B) Thermal reactions
Reaction Rate Ref.
O(3P)+O2O3 1.5×10⁻¹⁴ 1 O 3+NONO2+O2 1.8×10⁻¹⁴ΩEXP(−1400ΩTCORR) 5 O3+NO2NO3+O2 3.2×10⁻¹⁷ΩEXP(−2400ΩTCORR) 5 O 3+OHHO2+O2 6.7×10⁻¹⁴ 1 O3+HO2OH+2O2 2.0×10⁻¹⁵ 1 HO 2+OHO2+H2O 1.1×10⁻¹⁰ 1 HO2+HO2H2O2+O2 1.3×10⁻¹² 1 H 2O2+OHHO2+H2O 1.7×10⁻¹² 1 NO+HO2NO2+OH 8.3×10⁻¹² 1 NO+NO+O 22NO2 2.0×10−38 1 NO+OHHNO2 6.6×10⁻¹² 1 HNO 2+OHNO2+H2O 4.9×10⁻¹² 1 NO 2+OHHNO3 1.1×10⁻¹¹ 1 NO2+HO2HO2NO2 1.4×10⁻¹² 1 HO 2NO2HO2+NO2 8.5×10⁻² 1 HO2NO2+OHNO2+H2O+O2 5.0×10⁻¹² 1 HO 2+HO2+H2OH2O2+O2+H2O 4.0×10⁻³⁰ 1 HNO+O2NO+HO2 2.1×10⁻²⁰ 1 N 2O5+H2O2HNO3 2.0×10⁻²¹ 1 NO 3+OHNO2+HO2 2.3×10⁻¹¹ 1 NO 3+NO2NO2 2.9×10⁻¹¹ΩEXP(150ΩTCORR) 5 NO 3NO+O2 3.0×10⁻³ 1 NO 3+HO2HONO2+O2 4.3×10⁻¹² 1 NO 3+NO2N2O5 2×10⁻¹²Ω(TEMP/300)Ω(0.2) 4 N2O5NO2+NO3 1.15×10⁻¹⁹ΩEXP(−11080ΩTCORR) 4 Ω(TEMP/300)Ω(0.1) HNO3+OHNO3+H2O 1.5×10⁻¹³ 1 CO+OHCO 2+HO2 2.4×10⁻¹³ 1 O(1D)+O2O(3P)+O2 3.2×10⁻¹¹ 2 O(1D)+NO2O(3P)+NO2 1.8×10⁻¹¹ 2 O(1D)+H2O2OH 2.2×10⁻¹⁰ 2 HCHO+OHHO 2+CO+H2O 1.1×10⁻¹¹ 1 HCHO+NO 3CO+HONO2+HO2 6.0×10⁻¹⁶ 1 CH 3+O2CH3O2 1.0×10⁻¹² 1 CH 3+O2HCOH+OH 5.0×10⁻¹⁷ 1 CH3O2+NONO2+CH3O 7.6×10⁻¹² 1 CH 3O2+HO2CH3OOH+O2 4.9×10⁻¹² 1 CH3O2+CH3O2CH3OH+HCHO+O2 2.1×10⁻¹³ 1 CH 3O2+CH3O22CH3O+O2 1.3×10⁻¹³ 1 CH3O2+NO2CH3O2NO2 4.1×10⁻¹² 1 CH 3O2NO2CH3O2+NO2 1.8 1 CH3OOH+OHCH3O2+H2O 3.9×10⁻¹² 1 CH 3OOH+OHHCHO+OH+H2O 1.5×10⁻¹² 1 CH 3O+O2HCHO+HO2 1.9×10⁻¹⁵ 1 CH 3O+NOCH3ONO 3.0×10⁻¹¹ 1 CH 3O+NO2CH3O2NO2 1.5×10⁻¹¹ 1 CH3O+NOHCHO+HNO 1.3×10⁻¹² 1 CH 3OH+OHHCHO+HO2+H2O 9.0×10⁻¹³ 1
Refs. for Tables 1a, b. 1. Yin et al. (1990). 2. Atkinson et al. (1992). 3. Grenfell et al. (1999). 4. Atkinson et al. (1989). 5. DeMore et al. (1990). TCORR=(1/T −1/298). Tellus 52B (2000), 2
single pass through a hill cap cloud. The model Refs. for Table 2.
1. Martin & Damschen (1981). also calculates temperature, pressure and
super-saturation as the air parcel passes over the hill 2. Maahs (1983).
3. Damschen & Martin (1983). (Sander et al., 1994). Once the air parcel has
passed over the hill, droplets evaporate, and the 4. Pandis & Seinfeld (1989). 5. Warneck (1988).
model outputs a dry aerosol spectrum in which
aerosol sizes are calculated from the new quantities 6. Exner et al. (1992). 7. Reddy & van Eldik (1992). of soluble material (and the original insoluble
material ) contained within them. 8. Huie & Neta (1987). 9. Deister & Warneck (1990). 10. Wine et al. (1989). 11. McElroy (1990). 12. Lee & Rochelle (1987). Table 2. Aqueous phase reactions included in the
13. Betterton & Hoffmann (1988). model
14. Buxton et al. (1993).
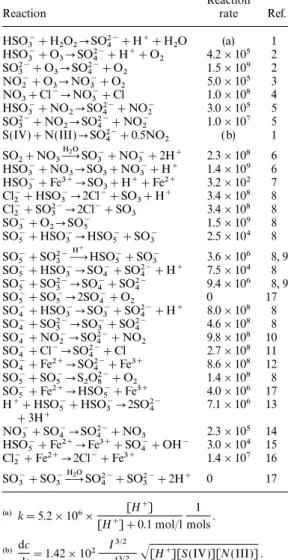
Reaction 15. Brandt & van Eldik (1993).
Reaction rate Ref. 16. Jayson et al. (1973).
17. Sander et al. (1995).
HSO−3 +H2O2SO24 +− H++H2O (a) 1 HSO−
3 +O3SO2−4 +H++O2 4.2×10⁵ 2 2.4. Aqueous phase SO23 +− O3SO24 +− O2 1.5×10⁹ 2
NO−
2 +O3NO−3 +O2 5.0×10⁵ 3 Aqueous chemistry is switched on once the
NO3+Cl−NO−3 +Cl 1.0×10⁸ 4
liquid water content of the cloud exceeds
HSO−
3 +NO2SO2−4 +NO−2 3.0×10⁵ 5
SO23 +− NO2SO24 +− NO−2 1.0×10⁷ 5 0.01 g/m3, and only within drops larger than 1 mm.
S(IV)+N(III)SO2−
4 +0.5NO2 (b) 1 Gas phase species try to attain equilibrium with
SO2+NO3DAH2O SO−
3 +NO−3 +2H+ 2.3×10⁸ 6 species in solution (the position of equilibrium HSO−
3 +NO3SO3+NO−3 +H+ 1.4×10⁹ 6 being determined by Henry’s law). The rate of HSO−3 +Fe3+SO3+H++Fe2+ 3.2×10² 7 scavenging or outgassing is limited by diffusion Cl−
2 +HSO−3 2Cl−+SO3+H+ 3.4×10⁸ 8 and transport across the gas–liquid interface
Cl−
2 +SO23 − 2Cl−+SO3 3.4×10⁸ 8 according to the equation developed by Schwartz SO− 3 +O2SO−5 1.5×10⁹ 8 SO− 5 +HSO−3 HSO−5 +SO−3 2.5×10⁴ 8 1986: SO− 5 +SO2−3 DAH+ HSO−5 +SO−3 3.6×10⁶ 8, 9 SO− 5 +HSO−3 SO−4 +SO24 +− H+ 7.5×10⁴ 8 dc a dt=kt(cg−cg,eq), (4) SO− 5 +SO2−3 SO−4 +SO2−4 9.4×10⁶ 8, 9 SO− 5 +SO−5 2SO−4 +O2 0 17 where k
t=transfer coefficient, ca=aqueous phase
SO−4 +HSO−3 SO3 +− SO24 +− H+ 8.0×10⁸ 8
concentration, c
g=gas phase concentration,
SO−
4 +SO2−3 SO−3 +SO2−4 4.6×10⁸ 8 SO−4 +NO−2 SO24 +− NO2 9.8×10⁸ 10 c
g,eq=equilibrium gas phase concentration. The
SO−
4 +Cl−SO2−4 +Cl 2.7×10⁸ 11 equilibrium concentration is calculated using the
SO−4 +Fe2+SO2−4 +Fe3+ 8.6×10⁸ 12
Henry law constant K
H, according to:
SO−
5 +SO−5 S2O2−8 +O2 1.4×10⁸ 8 SO−5 +Fe2+HSO−5 +Fe3+ 4.0×10⁶ 17 H++HSO−
5 +HSO−3 2SO24− 7.1×10⁶ 13 cg,eq=
c a (K HRT ) . (5) +3H+ NO−
3 +SO−4 SO24 +− NO3 2.3×10⁵ 14 The transfer coefficient takes into account
HSO−
5 +Fe2+Fe3++SO−4 +OH− 3.0×10⁴ 15 diffusion, and transport across the gas–liquid Cl−2 +Fe2+2Cl−+Fe3+ 1.4×10⁷ 16
interface and is defined by:
SO−
3 +SO−3 DAH2O SO2−4 +SO23 +− 2H+ 0 17
k t=
A
r2 3D g + 4r 3v:aB
−1 , (6)(a) k=5.2×10⁶×[H+]+0.1 mol/l[H+] mols1 .
where D
g=gas phase diffusivity, v:=mean
(b) dc
dt=1.42×10² I3/2
mol3/2 s√[H+][S(IV)][N(III)] . molecular speed, r=droplet radius,
A full set of the chemical reactions included in or from a number of different instruments measur-ing the same species at one site or another, these the aqueous phase model along with the rate
constants used is given in Table 2. This chemistry values have been compared. Generally the meas-urements at both sites and with different instru-includes a comprehensive reaction scheme for the
oxidation of sulphur dioxide to sulphate. ments compared very well, however in some cases there were significant differences. Where a choice was available values from Taganana have been assumed to be most representative of what was
3. Modelling the ACE-2 hill cap cloud
going into the cloud, and online measurements have been used in preference to filter pack meas-A number of time periods from the meas-ACE-2 field
campaign were selected as suitable times for mod- urements which integrate data over a three hour interval. Typical gas phase concentrations elling studies, these are given in Table 3. These
periods were selected to represent a variety of observed during the HILLCLOUD experiment are given in the overview paper (Bower et al., clean and polluted conditions. They were also
times when a good set of field data was available 2000). from all HILLCLOUD sites. This allowed as
much input data for the model as was possible to
3.2. Dynamics be derived directly from field measurements, and
the testing of model results against observations. A number of different sets of dynamics have been used for the model. Unfortunately measure-ments of updraft in the vicinity of cloud base, the 3.1. Gas phase
height of which was known from ceiliometer meas-urements at Taganana were not made. Updraft at In the model (as discussed above) an option
exists to run a complex gas phase reaction scheme the summit site was measured, though this was considerably greater than the updraft at cloud for a considerable length of time before the air
parcel reaches the hill. For this study, this was not base (the shape of the hill is such that the air accelerates over a short distance just before the required. Input gas phase concentrations to the
model were obtained from measurements at the summit). The simplest dynamics for this study were prescribed based on the measurements at the two upwind sites, located at Hidalgo and
Taganana. Data were available for the following summit. In this scheme the air parcel travels at a fixed angle to the top of the hill, and down the species, O
3, NO, NO2, NO3, SO2, HNO2, HNO3,
H2O2, NH3, HCl, and HCOH. Where multiple other side at the same angle. The vertical velocity used is 17.5% of that measured at the summit, data sets were available either from similar
meas-urements made at both Taganana and Hidalgo, and the horizontal velocity is fixed to maintain a
Table 3. Model run times
HILLCLOUD
Model run no. Date Time run no. Conditions
1A 2 July 1997 03:30 1 clean 2A (M) 8 July 1997 00:00 2 polluted 2B (M) 8 July 1997 06:00 2 polluted 3A (M) 9 July 1997 00:00 3 polluted 3B 9 July 1997 05:00 3 polluted 4A 13 July 1997 04:30 4 clean 5A (R) 14 July 1997 06:00 5 clean 6A 17 July 1997 06:00 6 intermediate 7A 20 July 1997 04:45 7 intermediate 8A 22 July 1997 19:00 8 clean 8B 22 July 1997 22:00 8 clean
M: modelled dynamics were used for these runs; R: possible presence of the rotor structure above the downwind site. Tellus 52B (2000), 2
constant angle. The value of 17.5% was obtained Entrainment is not considered during any model runs, as thermodynamic analysis carried out on empirically by finding the updraft required to
the measurements of temperature and relative match measured and modelled droplet
concentra-humidity at each of the sites showed very little tions at the summit site for a few of the runs. An
evidence that entrainment was taking place average value was used, and then applied to all
(Bower et al., 1999). the other runs, it was found that this updraft gave
good agreement between the model and
measure-ments for all runs. 3.3. Aerosol — size distribution Observations indicated that during some
meas-Size distributions used for model input were urement periods a rotor structure existed above
derived from a combination of differential mobility the downwind site, increasing the transit time
particle sizer (DMPS) measurements (Ma¨kela¨ between the summit and downwind site by up to
et al., 1997; Jokinen et al., 1997), and active five minutes, hence causing the air parcel to spend
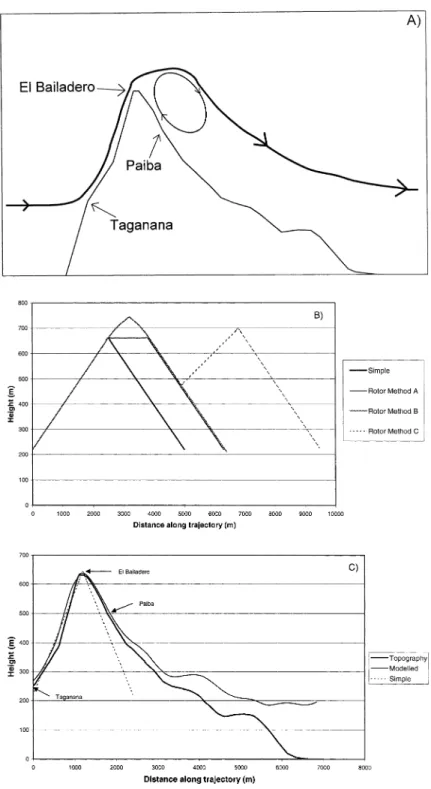
scattering aerosol spectrometer probe model X a longer time in the cloud. A schematic
representa-(ASASP-X) measurements. The DMPS measure-tion of the rotor is shown in Fig. 2a. Furthermore,
ments cover a size range 3.2–400 nm, and the presence of a rotor structure raised the
pos-the ASASP-X a size range of 100–3000 nm. sibility that a parcel of air may pass through the
Comparisons showed ASASP-X and DMPS spec-cloud more than once between the upwind and
tra to be in good agreement over the region of downwind sites. To look at the implications of
overlap, though ASASP-X spectra do fall off more this for cloud processing of aerosol, the simple
quickly at the larger sizes than the DMPS. The dynamics were modified to increase the length of
reasons for these differences are beyond the scope time spent in cloud and to cycle the air parcel
of this paper. A typical set of DMPS and ASASP-X through cloud a second time. Increasing the length
spectra are shown in Fig. 3. For the model input, of time in cloud was done in 2 ways, first by
DMPS data have been used unchanged up to assuming the air parcel remained at the same
400 nm, with the exception of the last channel. height as the summit for an additional 5 min,
Here the number of particles has been averaged second by assuming that the parcel continued to
with the number measured by the ASASP-X. From rise for a further 2 min, with a decreasing updraft,
400–3000 nm ASASP-X data has been used. then gradually descended, such that in total a
Above 3000 nm one extra size category was added, further 5 min is spent above the height of the
taking the total size range of aerosol input to summit site. Figure 2b shows how the rotor
struc-3.2–4500 nm. A comparison was made between ture has been dealt with in the model. Model run
the integrated mass from the DMPS or ASASP-X 5A, for which the measurements suggested a rotor and the Berner impactor gravimetric mass meas-may have been present was repeated with each of urements over an equivalent size range. The results these sets of dynamics; all other inputs to the of this comparison for the largest impactor stage model were kept the same. were used to determine the number of particles in
For 3 model runs (2A, 2B, and 3A), trajectories the 3000–4500 nm model input size category. over the hill based on flow modelling using the
Clark code were available (Clark et al., 1994;
3.4. Aerosol — chemical composition Wobrock et al., 1997). This flow modelling used a
digitised topography representing the northern Size segregated chemical composition of aerosol ridge of Tenerife, with soundings taken at Hidalgo soluble fraction was derived from ion chromato-providing data to initialise the model. For runs graphy (IC) analysis of the five stage Berner where modelled trajectories were available these impactor foils. These impactors sampled aerosol were used as input to the hill cloud model in at ambient relative humidity, which was quite addition to the prescribed dynamics, and the high, generally 80–95% at Taganana during cloud results were compared. A comparison of the pre- runs. DMPS and ASASP-X measurements are scribed and modelled trajectories used is shown made on ‘‘dry’’ aerosol (RH about 20%). Between in Fig. 2c. Table 4 lists updrafts at cloud base used relative humidities of 20 and 95% the diameter of a soluble particle may grow by a factor of 1.5–2.3. for each model run.
Fig. 2. Dynamics used in the modelling study. (A) Schematic illustration of the rotor dynamics which may have existed above the downwind site at Paiba during some measurement periods. ( b) Schematic illustration of how the rotor dynamics have been modelled. In this diagram it is the vertical position which is important. The horizontal velocity was left unchanged throughout although in reality the horizontal velocity would reverse as the air went around the rotor. (C) A comparison of modelled and prescribed trajectories over the hill, showing the terrain and the measurement sites.
Table 4. Updrafts at cloudbase for each model run impactors were calculated based on the measured chemical composition of particles in that size cut,
Model run no. Updraft at cloudbase (m/s) and using hygroscopic tandem differential
mobil-ity analyser (HTDMA) measurements of growth
1A 0.53
factors (Swietlicki et al., 2000).
2A 1.78*
Data available from the impactor measurements
2B 1.82*
3A 1.44* included the following species: Na+, Ca2+, Mg2+,
3B 1.45 NH+
4, Cl−, NO−3, and SO2−4 . The model input
4A 0.81 requires Na+, NH+
4, Fe3+, Cl−, NO−3, SO2−4 ,
5A 0.75
OH−, and H+. Calcium and magnesium were
6A 1.20
converted into sodium for the purpose of model
7A 1.56
8A 1.36 input, so as to maintain the same amount of
8B 1.39 positively charged material. The total charge for
all species was calculated, and hydrogen, or
* Updrafts derived from flow modelling, other values are
hydroxide added, to ensure electrically neutral
17.5% of the measured updraft at the summit site.
aerosol. As no measurements of iron content in the aerosol were made, it was assumed that no Furthermore, impactor cut-off diameters are
aero-iron was present in the aerosol. Gas phase meas-dynamic diameters, while DMPS and ASASP-X
urements showed only small concentrations of diameters are Stokes’ diameters. Thus ambient
SO
2, but plenty of H2O2, its major oxidant in the impactor cut-off diameters cannot be used for
aqueous phase. Hence the iron catalysed oxidation matching chemistry to the DMPS size spectra. To
of SO2 was not considered to be important in match the impactor cuts to the DMPS spectra,
this study. the Stokes diameter was calculated from the
aero-Comparisons have been made between chemical dynamic diameter, and dry diameter equivalent
and gravimetric mass, for both size segregated and cuts were calculated. To calculate Stokes diameter
bulk impactor data. These showed that in most it is essential to know the density of the ambient
cases the aerosol also consisted of some organic particles. In this study it was assumed that dry
or insoluble material. In clean cases, only 50–70% particles have a density of 2.0 g/cm3, the diameter
of the gravimetric mass could be accounted for by growth factor was used to calculate the amount
the chemical mass from the IC analysis. In polluted of water contained in ambient particles and hence
their density. Dry diameter equivalent cuts for the cases this value rose to 100%. A full chemical
Fig. 3. Comparison of aerosol spectra measured at Taganana using the DMPS and the ASASP-X, a combination of these spectra was used as input for the model. This case is for a polluted run, 9 July 1997, 00:00 UTC.
mass closure was carried out by Putaud et al. fraction is given by: (2000). The hygroscopic tandem differential
mobil-ity analyser (HTDMA) data (Swietlicki et al., Sf=gf3(m)−1
gf3(a)−1, (7) 2000) did not show such a significant reduction
in solubility in the main hygroscopic mode during where gf(m) is the measured growth factor, and clean events, but reported additional less soluble gf
(a)is the assumed growth factor for the soluble hygroscopic modes more frequently. This sug- material.
gested that some of the ‘‘missing’’ mass may be The soluble fraction for particles larger than the composed of soluble organic material and some maximum size for which growth factors were externally mixed insoluble material. measured was assumed to be equal to 1, the For this modelling study solubility data were validity of this assumption being confirmed by the derived from HTDMA data as described in the fact that the largest sizes for which growth factors next section. The chemical composition of the were measured had soluble fractions very close to soluble fraction used for the model input was 1. For particles smaller than those for which derived from IC analysis of Berner impactor foils, growth factors were measured, the soluble fraction as described above. was assumed to be equal to the soluble fraction of the smallest sizes for which growth factors were measured.
3.5. Aerosol — hygroscopic properties
In the field, the HTDMA was used to measure 4. Results
hygroscopic growth factors of particles with seven
different dry diameters in the size range of From the model runs undertaken, listed in 35–440 nm (Swietlicki et al., 2000). These growth Table 3, model runs 3B and 8B have been selected factors were used to calculate the soluble fraction as typical cases to represent polluted and clean of the particles. It has been shown experimentally conditions respectively. Detailed results and com-that the soluble, and less soluble components of parisons with measured data are given for these internally mixed aerosol take up water independ- runs, while other cases are discussed in the text ently of one another ( Virkkula et al., 1999). Hence and summarised in tables.
the fraction of soluble material may be calculated provided the diameter growth factor for the
par-4.1. Cloud microphysical properties ticle is known, along with growth factors for each
component. In principal these growth factors may Cloud droplet numbers predicted by the model for each run are shown in Table 5, and are com-be calculated from the chemical analysis of
par-ticles, and the size of the particle. pared to droplet numbers measured by the droplet aerosol analyser (DAA), and forward scattering For the purpose of this modelling study a
simplified method was used to calculate aerosol spectrometer probe (FSSP), and inferred by upwind and interstitial aerosol measurements. soluble fraction. It has been assumed that the
particle consists of either pure ammonium Generally there was very good agreement between modelled droplet number and both DAA measure-sulphate, or pure sodium chloride, for which
growth factors of 1.78 and 2.3 respectively for an ments (values within 20% on average) and the implied droplet number from aerosol measure-increase of relative humidity from 20 to 90% were
used. These soluble salts were assumed to be ments (values within 10% on average). Some differences may be due to the longer integration mixed with some completely insoluble material.
The salt chosen depended on the dominant species time of 20–30 min with the DAA, and also the difficulty in determining the updraft at cloudbase. in the chemical analysis of the aerosol. A further
simplification was made in that any difference Comparison with the FSSP measurements was not as good, especially when very high droplet between the relative humidities for which growth
factors for pure salts are quoted, and those at numbers are predicted (values within 25% for clean cases, and 40% for polluted cases on aver-which the actual growth factors of the particles
were measured, was ignored. Thus the soluble age). This was likely to be due to coincidence
Table 5. Comparison of modeled and measured cloud droplet numbers
DAA droplet number2,3
Model Model FSSP Droplet no.
run droplet no.1 droplet no. nearest min max implied4
1A 183 149 49 36 295 165.76 2A 1854 1137 1587 1129 2962 1767.4 2B 2862 1465 2139 1129 2962 2894.5 3A 1530 955 1239 489 1722 1369.0 3B 1283 1015 1286 489 1722 1268.1 4A 316 301 331 299 386 438.3 5A 337 296 196 141 600 321.38 6A 848 597 724 374 724 931.1 7A 377 243 262 262 388 396.1 8A 275 81 220.93 8B 205 133 174.24
1Where the modelled dynamics were available, they have been used.
2Nearest indicates droplet number from the measurement time nearest to the model run time. Min and max indicate the minimum and maximum droplet numbers measured during that HILLCLOUD run.
3Blanks are where data is missing during HILLCLOUD run 8.
4Droplet number implied from the difference between upwind and interstitial DMPS total number of particles with diameter>0.42 mm.
error problems with FSSP measurements under used in the model. This figure shows that there is an almost linear relationship between accumula-conditions of high droplet concentration, the
details of which are beyond the scope of this tion mode aerosol and droplet number. These results support findings from the measurements of paper. The issue of measurement of very high
numbers of droplets is discussed further by Martinsson et al, and should be compared with measurements reported in that paper. These meas-Martinsson et al. (2000).
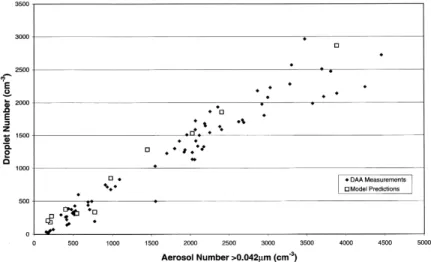
Fig. 4 shows the relationship between predicted urements and modelling results are in contrast to previous studies where a linear relationship has droplet number and the input aerosol number
Fig. 4. Scatter plot of predicted droplet number against input aerosol number, for all the model runs, showing the linear relationship between the two. For comparison DAA measurements of cloud droplet number and upwind aerosol number are also shown.
not been found, rather droplet numbers have lems with FSSP measurements under conditions of high droplet number which result in oversizing levelled off at higher aerosol concentrations
(within the same size range). of measured droplets by an amount which is difficult to quantify, and hence to correct. Cloud droplet spectra produced by the model
are in good agreement with those measured by For clean studies as seen in Fig. 5A, the mod-elled droplet spectra were narrower than the meas-the FSSP for clean cases, but with larger di
ffer-ences for polluted cases. Examples of cloud droplet ured spectra. The measurements showed higher numbers of both very small, and very large drop-spectra for a clean and polluted case are shown
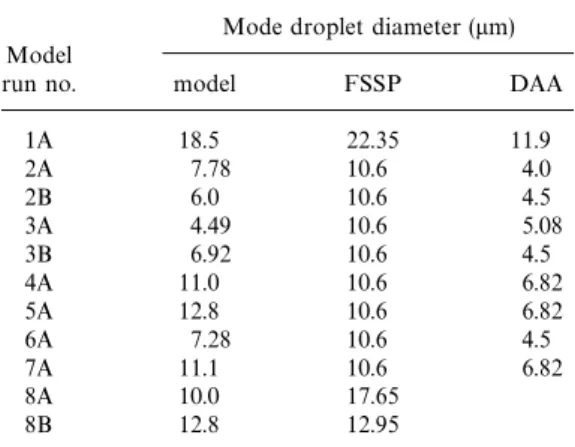
in Fig. 5A, B, respectively. Table 6 compares lets than were predicted. A small number of addi-tional larger droplets may be a result of droplets the mode droplet diameter predicted by the
model with measurements for each model run. forming on large aerosol which were not included in the model input. Such aerosol were measured Differences between modelled and FSSP spectra
during polluted cases may be attributed to prob- at Hidalgo, but were small in number (generally
Fig. 5. Comparison of predicted droplet spectra, and those measured using the FSSP. (A) Typical clean case, Model run 8B. This shows good agreement between the model and FSSP measurements in regard to the mode diameter. (B) Typical polluted case, Model run 3B. This shows the poor agreement between the model and FSSP measurements during conditions of high droplet concentration.
Table 6. Modelled and measured mode droplet phase makes very little difference to the size distribution of the aerosol. In addition, in polluted diameter
cases the size of the smallest particles activated
Mode droplet diameter (mm) was larger at between 65–80 nm diameter. Table 7 Model
gives a comparison between the size of the smallest
run no. model FSSP DAA
particles activated in the model, with those deter-mined from the observations (obtained by
compar-1A 18.5 22.35 11.9
ing upwind and interstitial DMPS measurements).
2A 7.78 10.6 4.0
2B 6.0 10.6 4.5 Some measured aerosol size distributions show
3A 4.49 10.6 5.08 support for model predictions of aerosol modi-3B 6.92 10.6 4.5 fication, with both the magnitude of the
modifica-4A 11.0 10.6 6.82
tion and the size range over which the modification
5A 12.8 10.6 6.82
occurs in agreement. This is the case for model
6A 7.28 10.6 4.5
runs 2A–4A, 6A and 8A–8B, however there is no
7A 11.1 10.6 6.82
8A 10.0 17.65 evidence for aerosol modification seen in the
meas-8B 12.8 12.95 urements for model runs 1A, 5A, and 7A. Runs
where agreement was seen cover both clean and polluted conditions and showed significant modi-fication during clean cases, with very little change during polluted cases. Fig. 7 shows a comparison between input and output measured aerosol spec-less than 10 particles/cm3). Additional small
drop-lets may result from a more complicated supersat- tra for a clean and polluted case (for the same periods investigated in model runs 8B and 3B). uration history than was used in the model. Some
model runs were carried out using dynamics that This figure can be compared with Fig. 6, and shows the agreement between the model and produced a more complicated supersaturation
his-tory in which there were two supersaturation measurements for these cases. Generally agree-peaks. It was found that having a second peak
close to cloudbase did produce additional small Table 7. Diameter of modelled and measured small-droplets, but that a second supersaturation peak
est particles activated close to the summit, using the updraft measured
at the summit site made no difference to the Smallest particle activated (nm)
Model
droplet spectra or the number of droplets
activ-run no. model measured
ated. Thus, additional small droplets seen in the measurements may be the result of a more
com-1A 55.9 51.8
plicated supersaturation history close to
cloud-2A 71.8 71.97
base. It is also known that FSSP measurements 2B 66.9 61.05 tend to broaden the measured droplet spectra 3A 80 84.83 (Dye and Baumgardner, 1984). 3B 80 51.79
4A 55.9 51.79
5A 55.9 61.05
4.2. Changes in aerosol size spectra due to cloud 6A 66.9 51.79
7A 39.1 31.62
processing
8A 39.1 37.27
Fig. 6 shows model input and output aerosol 8B 39.1 26.83 spectra for a clean and polluted case model runs
Measured smallest particles activated are derived from
8B and 3B respectively. During clean cases there
a comparison of upwind and interstitial DMPS spectra.
is significant modification of the smallest particles
Diameter of smallest particles activated is the mid
dia-activated, which may be as small as 40 nm in
meter of the first category where the interstitial DMPS
diameter. During polluted cases very little modi- spectra shows a significant reduction from the upwind fication takes place, possibly due to the fact that DMPS spectra in the case of measurements, or the mid there is so much material in the aerosol phase diameter of the first channel in which aerosol
modifica-tion has occurred in the model.
Fig. 6. (A) Modelled input and output aerosol spectra for the typical clean case, Model run 8B. (B) Modelled input and output aerosol spectra for the typical polluted case, Model run 3B. These figures may be compared with the measurements shown in Fig. 7.
ment was good, the main difference being that 4.3. Changes in aerosol chemistry due to cloud processing
observations indicated that a few smaller particles were activated than were predicted by the model.
This may be due to some particles at sizes larger Typical input and output aerosol chemistry for clean conditions is shown in Fig. 8. In this plot than the smallest size activated remaining
unactiv-ated within the real cloud, whereas in the model from model run 8B, it can be seen that some aerosol growth was caused by the uptake of all particles of a given size and solubility are either
activated or not activated. To reproduce these sulphur dioxide from the gas phase, and its oxida-tion to sulphate in the droplets. However nitrate, observations would require a more complex
hygroscopic aerosol input to the model (with chloride and ammonium components increased (accounting for up to 97% of the mass increase of aerosols of a given size — particularly at smaller
sizes, having an external mix of hygroscopicities). the smallest activated particles) due to the
Fig. 7. (A) Observed upwind, interstitial and downwind DMPS spectra for the typical clean case, Model run 8B. Observed upwind, interstitial and downwind DMPS spectra for the typical polluted case, Model run 3B. (B) The spectra from the downwind site has been normalised to correct for a suspected flow rate problem. The normalisation process has not affected the shape of the spectra. It can be seen from these figures, and from Fig. 6 that the modelled prediction of aerosol modification is in agreement with measurements.
ging of species from the gas phase onto the smallest the scavenging from the gas phase was much more significant. In cases with high ammonium loading, particles activated, and also some repartitioning
of these species from larger particles. In some ammonia is outgassed from the larger particles on activation contributing significantly to the concen-cases, the repartitioning accounted for all of the
Fig. 8. Comparison of model input and output aerosol chemistry for the typical clean case, Model run 8B. (A) A plot of modelled mass increase between upwind and downwind sites for each species for each stage of the Berner impactor. (B) Input and output chemical composition by mass as a function of size. Each category corresponds to a Berner Impactor stage.
the cloud has evaporated. For example it can be occurs at high relative humidity in the vicinity of cloud or in the cloud itself.
seen (Fig. 8a) that for model run 8B ammonia has
outgassed from all aerosol larger than 0.13mm. In polluted cases, the total mass added to the aerosol phase was larger than in the clean case For this case an increase of gas phase ammonia
from 0.06 to 0.33 ppbv was predicted. Generally (compare Figs. 8A and 9A). However, due to the very high number of particles over which the ammonia was also taken up onto the smaller
particles. Outgassing occurs because high ammo- added mass was distributed absolute changes in soluble mass per particle were smaller typically by nium loadings in dry aerosol are locked in from
the time the aerosol was in equilibrium with an about a factor of 2. This coupled with the larger size of the smallest activated particles in the ammonia rich gas phase. Aerosol phase
ammo-nium in excess of gas phase ammonia cannot be polluted case gave a mass increase of only 10–60% for the smallest particles activated, compared with liberated until aerosol become solutions which
1000% in clean cases. In these polluted cases there occurs because of the production of less volatile salts such as ammonium nitrate and ammonium was very little take up of sulphur dioxide and
chloride mixed with sulphate, and because of high most changes were due to the take up of nitrate
ionic strength effects in solution moving the equi-and chloride from the gas phase, equi-and the
reparti-librium between gas and aqueous phases. In some tioning of these species from larger particles onto
cases however, it is possible that some or all of smaller particles. In some polluted cases
reparti-the material taken up will be outgassed again as tioning accounted for up to 60% of the chloride
the droplets evaporate, particularly when stable gained by the small particles, and about 10% of
salts are not formed or droplet evaporation is the nitrate. Ammonia was taken up onto some
slow. This requires further investigation and will particles and outgassed from others, depending on
be carried out when routines for high ionic the pH of the particles. An example of the changes
strength chemistry are added to the model. in aerosol chemistry is shown in Fig. 9 for the
Modelled chemistry results are generally in typical polluted case, model run 3B.
agreement with field data. Filter pack measure-Repartitioning occurs because of the large
ments of gases show some take up of HNO 3and differences in the composition of aerosol in
differ-HCl from the gas phase during all cloud events. ent size ranges, reflecting the different sources of
Gas phase measurements of ammonia in some different sized aerosol. As cloud droplets grow,
cases showed an increase between upwind and species are exchanged between gaseous and
aque-downwind sites, while in others a decrease was ous phases till all aerosol are in equilibrium with
seen. This may be as a result of exchange of species current gas phase concentrations. In many cases
in the cloud, or contamination of the measure-much of the initial gas phase concentration of
ments by local sources of ammonia. The uptake each gas is scavenged by the growing cloud
drop-of SO2 and oxidation to sulphate is small, despite lets. Thus leaving a deficit in the gas phase causing
an excess of H2O2 in the gas and aqueous phases. aerosol comprised of a large fraction of NH+
4, This is also in agreement with gas phase measure-Cl−, NO−3 to be in excess over the gas phase, and
ments of SO
2 which show very little change in hence to outgas. During evaporation increasing
SO2 concentration after passage through the concentrations within the shrinking droplets
prob-cloud. This may be due to the short length of time ably then puts the concentrations in most aerosol
spent by the air parcel within the hill cap cloud. in excess over gas phase concentrations leading to
The take up of SO2 by cloud droplets is limited general outgassing. The aerosol will now be in
by the rate at which it will diffuse into the drops, equilibrium with the gas phase, and may have
by low pH of some of the droplets, and the small different compositions than those upon entering
concentration of SO2 available in the gas phase. the cloud.
Thus SO
2uptake into the drops was slow despite The uptake of HNO
3, HCl and NH3, and the the fact that within the drops it was rapidly significance of these species in the modification of
oxidised to sulphate by H2O2.
the aerosol spectrum is an important result of this There is some support in the size resolved modelling study. In previous studies the uptake of aerosol chemistry measurements for the uptake SO2 and its oxidation has been found to be the and repartitioning of nitrate and chloride onto the dominant process regulating the evolution of the smaller particles especially for the clean case stud-aerosol spectrum. In this study although aqueous ies. Specific comparisons between modelled and phase oxidation of SO2 is still of some importance, measured size segregated aerosol chemistry were especially during clean cases, gain in the other carried out, this was done by integrating up both species has a much more significant effect. This is the model output data and the downwind true even in the case where the contribution of impactor measurements into two size fractions, sulphate is greatest (typical clean case), and it is the small fraction being <240 nm dry diameter an order of magnitude less than the contribution and the large fraction>240 nm dry diameter. It due to Cl− NO−
3 and NH+4 uptake. It is expected was not possible to perform a more detailed that the uptake of HNO
3 HCl and NH3 and comparison than this between modelled and meas-sulphate produced will lead to permanent changes ured aerosol chemistry because of the limitations in the aerosol spectra, even though species outgas in the size resolution of the impactor data. For model run 8B (model results shown in Fig. 8), it during droplet evaporation. The modification
Fig. 9. Comparison of model input and output aerosol chemistry for the typical polluted case, Model run3B. (A) A plot of modelled mass increase between upwind and downwind sites for each species for each stage of the Berner impactor. (B) Input and output chemical composition by mass as a function of size. Each category corresponds to a Berner Impactor stage.
was found that ammonium, nitrate and chloride clean case, both the model and measurements showed relatively little mass was added to each accounted for 22%, 7% and 15% respectively of
the total mass in the small fraction while the particle due to the very high number of particles over which the added mass was distributed. Thus, measurements showed 13%, 40%, 9% for the
same species. For the large fraction the model changes in aerosol chemical composition were small.
gave 0%, 5%, 33% and the measurements 7%, 5%, 28% again for the same species as above. These can be compared with inputs of 34%, 0.3%,
4.4. Significance of dynamics details 0.7% and 3%, 4%, 32% for the small and large
fraction respectively. A comparison of results from model run 5A using the different types of rotor dynamics showed In the polluted case, although the total mass
added to the aerosol phase was larger than in the that the presence of the rotor system above the
downwind site made very little difference to the of the droplets and short period of time spent in cloud.
amount of cloud processing despite doubling the
$ Condensation of nitric acid and hydrogen
length of time particles spent in cloud. Even
chloride on the smaller particles and being fixed the multi-cycling case where the parcel goes
by ammonia. There is also evidence of loss of through the cloud for a second time showed only
nitrate and chloride from the larger particles, slight differences in the amount of aerosol
modi-which sometimes contributes significantly to that fication from the simple case with no rotor present.
taken up by the smaller particles. With a simple doubling of the length of time spent
In general in remote environments the exchange in cloud, the smallest particles activated grew by
of hydrochloric acid, nitric acid and ammonia an additional 3%. With an additional cycle
between aerosol particles in the vicinity of cloud through cloud exactly the same number of
par-may be a very important mechanism in regulating ticles were activated, despite the smaller updraft
the evolution of the aerosol spectrum. It is likely used, the smallest particles grew by an additional
that the changes resulting from the uptake of 6%. These differences can be accounted for by an
hydrochloric acid, and nitric acid will be perman-increased take up of sulphur dioxide and its
ent when fixed by ammonia and internally mixed oxidation to sulphate. Results of this multi-cycling
with sulphate, but not in other cases. Thus an test case are in general agreement with the
lagrang-understanding of the sources and sinks of ammo-ian modelling study reported by Dore et al., 1999.
nia in the remote marine environment will be Use of modelled dynamics for the runs where it
important for interpreting the significance of these was available caused slightly smaller particles to
results on a more general scale. activate as the updraft at cloud base was larger
The model is able to reproduce the mode in the than in the prescribed dynamics. With modelled
FSSP measured droplet size distribution during dynamics particles down to 70 nm activated
com-clean studies, but not during polluted studies pared with 85 nm with prescribed dynamics, this
where the number of droplets is much higher. This was one additional category in the model. The use
is attributed to the FSSP oversizing the droplets of modelled dynamics made a significant difference
due to the high number of coincidence errors in to the number of cloud droplets present at the
these cases. summit, as during the polluted events for which
The model is able to reproduce the very high modelled dynamics were available, the extra
numbers of droplets measured during polluted category of particles activated contained a large
runs, with a linear relationship being established number of particles. In addition with the
pre-between accumulation mode aerosol and droplet scribed dynamics not all activated particles were
number. Thus supporting the measurements still drops by the time the air reached the summit.
reported in Martinsson et al. (2000). This is very In some polluted cases the smallest category
activ-significant in terms of the implications for climate ated had evaporated by the time the air reached
forcing, as clouds consisting of larger numbers of the summit. This was not observed with the
mod-small droplets have a higher albedo than clouds elled dynamics, or with the prescribed dynamics
with a similar liquid water content consisting of during clean cases.
larger droplets. Thus; the magnitude of the indirect aerosol effect on climate forcing will be larger than previously thought, especially in outbreaks
5. Conclusions from modelling studies
of highly polluted continental air over the ocean. These results will be applied to other clouds in Changes in aerosol chemistry and size in both
ACE-2 by using the same model to predict the clean and polluted conditions occur due to the
observed numbers of droplets in stratocumulus following processes:
cloud.
$ Oxidation of sulphur dioxide by hydrogen
peroxide, but this is limited, as there is very little
sulphur dioxide in the gas phase most already 6. Acknowledgements
having gone into the aerosol phase as sulphate
before the air parcel arrived at Tenerife. Further This research is a contribution to the International Global Atmospheric Chemistry take up may be inhibited by the low pH of some
(IGAC) Core Project of the International 940180. The authors would finally like to thank colleagues at collaborating institutes for stimulat-Geosphere–Biosphere Programme (IGBP) and is
part of the IGAC Aerosol Characterization ing discussion, advice and for access to their preliminary and analysed data. These institutes Experiments (ACE) series. It has been supported
by the European Commission under contract include: Institute of Applied Environmental Research, University of Stockholm; Inst. per lo number ENV4 CT95 0058 (-PL950583) entitled:
‘‘Use of a Hill Cap Cloud to Study Cloud-Aerosol Studio dei Fenomeni Fisici e Chimici della Bassa ed Alta Atm (FISBAT); Institute of Terrestrial Interactions in ACE-2’’ (short title:
‘‘HILL-CLOUD’’) under the Programme Environment Ecology, Edinburgh Research Station; Division Nuclear Physics, Lund University; Institute of and Climate 1994–1998–Topic 1212. The
dynam-ical calculations have be done on the CRAY C94 Experimental Physics, University of Vienna; University of East Anglia, UK; Institute of Public and C98 of the ‘‘Institut du Developpement et des
Ressources en Informatique Scientifique’’, (IDRIS, and Environmental Health, University of Birmingham.
CNRS) in Orsay (France) under project no.
REFERENCES
Atkinson, R., Baulch, D. L., Cox, R. A., Hampson, R. F. O. H., Mentes, B., Papaspiropoulos, G., Hansson, Jr., Kerr, J. A. and Troe, J. 1989. Evaluated kinetic H.-C., Kulmala, M., Aalto, P., Va¨keva¨, M., Berner, A., and photochemical data for atmospheric chemistry Bizjak, M., Fuzzi, S., Laj, P., Facchini, M.-C., Orsi, G., supplement. J. of Phys. Chem. Ref. Data 18, 881–1097. Ricci, L., Nielsen, M., Allan, B. J., Coe, H., McFiggans, Atkinson, R., Baulch, D. L., Cox, R. A., Hampson, R. F. G., Plane, J. M. C., Collett Jr., J. L., Moore, K. F. and Jr., Kerr, J. A. and Troe, J. 1992. Evaluated kinetic Sherman. D. E. 2000. ACE-2 HILLCLOUD: An Over-and photochemical data for atmospheric chemistry view of the ACE-2 ground based cloud experiment. supplement IV (IUPAC Subcommittee on Gas Kinetic T ellus 52B, 750–778.
Data Evaluation for Atmospheric Chemistry). J. of Bradbury, C., Bower, K. N., Choularton, T. W., Swiet-Phys. Chem. Ref. Data 21, 1125–1568. licki, E., Birmili, W., Wiedensohler, A., Yuskiewicz, B., Betterton, E. A. and Hoffmann, M. R. 1988. Oxidation Berner, A., Dusek, U., Dore, A. J. and McFadyen, of aqueous SO2by peroxymonosulfate. J. Phys. Chem. G. C. 1999. Modelling of aerosol modification 92, 5962–5965. resulting from passage through a hill cap cloud. Atmos. Bower, K. N., Choularton, T. W., Gallagher, M. W., Res. 50, 185–204.
Colville, R. N., Wells, M., Beswick, K. M., Wieden- Brandt, C. and van Eldik, R. 1993. Iron(III)-catalyzed sohler, A., Hansson, H.-C., Svenningson, B., Swietlicki, oxidation of sulfur(IV)-oxides: evidence for a novel E., Wendisch, M., Berner, A., Kruisz, C., Laj, P., Facch- reaction step in the presence of oxygen. Borrell, P. M., ini, M. C., Fuzzi, S., Bizjak, M., Dollard, G., Jones, B., Borrell, P., Cvitas, T. and Seiler, W. (eds.): Proceedings Acker, K., Wieprecht, W., Preiss, M., Sutton, M. A.,
of EUROT RAC Symposium ’92. SPV Academic Pub-Hargreaves, K. J., Storeton-West, R. L., Cape, J. N.
lishing bv, pp. 593–597. and Arends, B. G. 1997. Observation and modelling
Buxton, G. V., Eccles, J. L. and Salmon, G. A. 1993. The of the processing of aerosol by a hill cap cloud. Atmos.
NO
3radical in aqueous solution. Borrell, P. M., Bor-Environ. 31, 2527–2543.
rell, P., Cvitas, T. and Seiler, W. (eds.): Proceedings of Bower, K. N., Choularton, T. W., Gallagher, M. W.,
EUROT RAC symposium ’92. SPV Academic Pub-Colville, R. N., Beswick, K. M., Inglis, D. W. F.,
Brad-lishing bv, pp. 610–614. bury, C., Martinsson, B. G., Frank, G., Swietlicki, E.,
Clark, T. L., Hall, W. D. and Banta, R. M. 1994. Two-Zhou, J., Berg, O. H., Cederfelt, S.-I., Cape, J. N.,
and three dimensional simulations of the 9 Jan 1989 Sutton, M. A., McFadyen, G. G., Milford, C., Birmili,
severe Boulder windstorm: comparison with observa-W., Yuskiewicz, B. A., Wiedensohler, A., Stratmann,
tion. J. Atmos. Sci. 51, 2317–2342. F., Wendisch, M., Berner, A., Ctyroky, P., Galambos,
Damschen, D. E. and Martin, L. R. 1983. Aqueous aero-Z., Mesfin, S. H., Dusek, U., Dore, C. J., Lee, D. S.,
sol oxidation of nitrous acid by O
2, O3and H2O2. Pepler, S. A., Bizjak, M. and Divjak, B. 1999. The
Atmos. Environ. 17, 2005–2011. Great Dun Fell experiment 1995: an overview. Atmos.
Deister, U. and Warneck, P. 1990. Photooxidation of Res. 50, 151–184.
SO2−3 in aqueous solution. J. Phys. Chem. 94, Bower, K. N., Choularton, T. W., Gallagher, M. W.,
2191–2198. Beswick, K. M., Flynn, M. J., Allen, A. G., Davison,
DeMore, W. B., Sander, S. B., Golden, D. M., Molina, B. M., James, J. D., Robertson, L., Harrison, R. M.,
M. J., Hampson, R. F., Kurylo, M. J., Howard, C. J. Hewitt, C. N., Cape, J. N., McFadyen, G. G.,
Mar-tinsson, B. G., Frank, G., Swietlicki, E., Zhou, J., Berg, and Ravishankara, A. R. 1990. Chemical kinetics and Tellus 52B (2000), 2
photochemical data for use in stratospheric modelling. centrations in air masses transported thousands of kilometers over the ocean. T ellus 52B, 801–814. In: Jet Propulsion Laboratory Publication 90-1.
McElroy, W. J. 1990. A laser study of the reaction of Dore, A. J., Johnson, D. W., Osborne, S. R., Choularton,
SO−
4 with Cl− and the subsequent decay of Cl−2 in T. W., Bower, K. N., Andreae, M. O. and Bandy,
aqueous solution. J. Phys. Chem. 94, 2435–2441. B. J. 2000. Evolution of boundary layer aerosol
par-Pandis, S. N. and Seinfeld, J. H. 1989. Sensitivity analysis ticles due to in-cloud chemical reactions during the
of a chemical mechanism for aqueous phase atmo-second lagrangian experiment of ACE-2. T ellus 52B,
spheric chemistry. J. Geophys. Res. 94D, 1102–1126. 452–463.
Pruppacher H. R. and Klett, J. D. 1997. Microphysics of Dye, J. E. and Baumgardner D. 1984. Evaluation of the
clouds and precipitation, 2nd edition. Kluwer Academic forward scattering spectrometer probe. Part 1.
Elec-Publications, Dordrecht, pp. 173–174. tronic and optical studies. J. of Atmos. and Oceanic
Putaud, J. P., Van Dingenen, R., Mangoni, M., Virkkula, T ech. 1, 329–344. A., Raes, F., Maring, H., Prospero, J. M., Swietlicki, Exner, M., Herrmann, H. and Zellner, R. 1992. Laser- E., Berg, O. H., Hillamo, R. and Ma¨kela¨, T. 2000. based studies of reactions of the nitrate radical in Chemical mass closure and origin assessment of the aqueous solution. Ber. Bunsenges. Phys. Chem. 96, submicron aerosol in the marine boundary layer and 470–477. the free troposphere at Tenerife during ACE-2. T ellus Grenfell, J. L., Savage, N. H., Harrison, R. M., Penkett, 52B, 141–168.
S. A., Forberich, O., Comes, F. J., Clemitshaw, K. C., Reddy, K. B. and Van Eldik, R. 1992. Kinetics and Burgess, R. A., Cardenas, L. M., Davison, B. and mechanism of the sulfite-induced autoxidation of Fe(II) in acidic aqueous solution. Atmos. Environ. McFadyen, G. G. 1999. Tropospheric box-modelling
26A, 661–665. and analytical studies of the hydroxyl (OH) radical
Saltelli, A. and Hjorth, J. 1995. Uncertainty and sensi-and related species: comparison with observations.
tivity analysis of OH-initiated dimethyl sulphide J. of Atmos. Chem. 33, 183–214.
oxidation kinetics. J. of Atmos. Chem. 21, 187–221. Huie, R. E. and Neta, P. 1984. Chemical behavior of
Sander, R., Lelieveld, J. and Crutzen, P. J. 1995. Model-SO−3 and SO−5 radicals in aqueous solutions. J. Phys.
ling of the night-time nitrogen and sulfur chemistry in Chem. 88, 5665–5669.
size resolved droplets of an orographic cloud. J. of Jayson, G. G., Parsons, B. J. and Swallow, A. J. 1973.
Atmos. Chem. 20, 89–116. Some simple, highly reactive, inorganic chlorine
deriv-Schwartz, S. E. 1986. Mass transport considerations per-atives in aqueous solution. J. Chem. Soc. Faraday
tinent to aqueous phase reactions of gases in liquid T rans. 69, 1597–1607.
clouds. In: Chemistry of multiphase atmospheric systems Jokinen, V. and Ma¨kela¨, J. M. 1997. Closed loop arrange- (ed. W. Jaesckle). Springer Verlag, Berlin, pp. 415–471. ment with critical orifice for DMA sheath/excess flow Swietlicki, E., Zhou, J., Berg, O. H., Hameri, K., Vakeva, system. J. Aerosol Science 28, 643–648. M., Ma¨kela¨, J., Covert, D. S., Dusek, U., Busch, B., Lee, Y. J. and Rochelle, G. T. 1987. Oxidative degrada- Wiedensohler, A. and Stratmann, F. 2000. Hygro-tion of organic acid conjugated with sulfite oxidaHygro-tion scopic properties of aerosol particles in the eastern in flue gas desulfurization: products, kinetics, and Northern Atlantic during ACE-2. T ellus 52B, 201–227. mechanism. Env. Sci. T ech. 21, 266–272. Virkkula, A., Van Dingenen, R., Raes, F. and Hjorth, Maahs, H. G. 1983. Kinetics and mechanism of the J. 1999. Hygroscopic properties of aerosol formed by oxidation of limonene,a-pinene, and b-pinene. J. of oxidation of S(IV) by ozone in aqueous solution with
Geophys. Res. 104, 3569–3579. particular reference to SO
2conversion in non-urban Wallace, J. M. and Hobbs, P. V. 1997. Atmospheric sci-tropospheric clouds. J. Geophys. Res. 88C,
ence — an introductory survey. Academic Press, ISBN 10721–10733.
0127329501, p. 162. Ma¨kela¨, J. M., Aalto, P., Jokinen, V., Pohja, T., Nissinen,
Warneck, P., 1988. Chemistry of the natural atmosphere. A., Palmroth, S., Markkanen, T., Seitsonen, K.,
Academic Press, Inc., San Diego. Lihavainen, H. and Kulmala, M. 1997. Observations
Wine, P. H., Tang, Y., Thorn, R. P., Wells, J. R. and of ultrafine aerosol particle formation and growth in
Davis, D. D. 1989. Kinetics of aqueous phase reactions boreal forest. Geophysical Research L etters 24,
of the SO−4 radical with potential importance in cloud 1219–1222. chemistry. J. Geophys. Res. 94D, 1085–1094. Martin, L. R. and Damschen, D. E. 1981. Aqueous oxida- Wobrock, W., Flossmann, A. I., Colville, R. N. and Inglis.
tion of sulfur dioxide by hydrogen peroxide at low D. W. F. 1997. Modelling of air flow and cloud fields pH. Atmos. Environ. 15, 1615–1621. over the Northern Pennines. Atmos. Environ. 31, Martinsson, B. G., Frank, G., Cederfelt, S.-I., Berg, O. H., 2421–2439.
Mentes, B., Papaspiropoulos, G., Swietlicki, E., Zhou, Yin, F., Grosjean, D. and Seinfeld, J. H. 1990. Photoox-J., Flynn, M., Bower, K. N., Choularton, T. W., idation of dimethyl sulphide and dimethyl disulphide Ma¨kela¨, J., Virkkula, A. and Van Dingenen. R. 2000. I: mechanism development. J. of Atmos. Chem. 11,
309–364. Validation of very high cloud droplet number