HAL Id: hal-00256881
https://hal.archives-ouvertes.fr/hal-00256881
Submitted on 18 Feb 2008
HAL is a multi-disciplinary open access
archive for the deposit and dissemination of
sci-entific research documents, whether they are
pub-lished or not. The documents may come from
teaching and research institutions in France or
abroad, or from public or private research centers.
L’archive ouverte pluridisciplinaire HAL, est
destinée au dépôt et à la diffusion de documents
scientifiques de niveau recherche, publiés ou non,
émanant des établissements d’enseignement et de
recherche français ou étrangers, des laboratoires
publics ou privés.
and AVR from clump giants
C. Soubiran, O. Bienayme, T. V. Mishenina, V. V. Kovtyukh
To cite this version:
C. Soubiran, O. Bienayme, T. V. Mishenina, V. V. Kovtyukh. Vertical distribution of Galactic disk
stars IV - AMR and AVR from clump giants. Astronomy and Astrophysics - A&A, EDP Sciences,
2008, 480, pp.91-101. �10.1051/0004-6361:20078788�. �hal-00256881�
January 8, 2008
Vertical distribution of Galactic disk stars
! !!
IV - AMR and AVR from clump giants
C. Soubiran
1, O. Bienaym´e
2, T.V. Mishenina
3, V.V. Kovtyukh
31 Universit´e Bordeaux 1 - CNRS - Laboratoire d’Astrophysique de Bordeaux, BP 89, 33270 Floirac, France 2 Universit´e de Strasbourg, CNRS Observatoire Astronomique, 11 rue de l’Universit´e, 67000 Strasbourg, France 3 Astronomical Observatory of Odessa National University, Shevchenko Park, 65014, Odessa, Ukraine
Received : October 4, 2007 / Accepted : November 30, 2007
ABSTRACT
We present the parameters of 891 stars, mostly clump giants, including atmospheric parameters, distances, absolute magnitudes, spatial velocities, galactic orbits and ages. One part of this sample consists of local giants, within 100 pc, with atmospheric parameters either estimated from our spectroscopic observations at high resolution and high signal-to-noise ratio, or retrieved from the literature. The other part of the sample includes 523 distant stars, spanning distances up to 1 kpc in the direction of the North Galactic Pole, for which we have estimated atmospheric parameters from high resolution but low signal-to-noise Echelle spectra. This new sample is kinematically unbiased, with well-defined boundaries in magnitude and colours. We revisit the basic properties of the Galactic thin disk as traced by clump giants. We find the metallicity distribution to be different from that of dwarfs, with fewer metal-rich stars. We find evidence for a vertical metallicity gradient of -0.31 dex kpc−1and for a transition at∼ 4-5 Gyr in both the metallicity and velocities. The age - metallicity relation (AMR), which exhibits a very low dispersion, increases smoothly from 10 to 4 Gyr, with a steeper increase for younger stars. The age-velocity relation (AVR) is characterized by the saturation of the V and W dispersions at 5 Gyr, and continuous heating in U.
Key words.Stars: kinematics – Stars: fundamental parameters – Galaxy: disk – Galaxy: structure – Solar neighbourhood
1. Introduction
This paper is the continuation of previous papers (Soubiran et al. 2003, hereafter Paper I and Siebert et al. 2003, hereafter Paper II) where we investigated the vertical distribution of disk stars with local and distant samples of clump giants. Our main result in Paper I was a new characterization of the thick disk, showing a rotational lag of−51 ± 5 km s−1with respect to the Sun, a
ve-locity ellipsoid of (σU, σV, σW) = (63± 6, 39 ± 4, 39 ± 4) km s−1, a mean metallicity of [Fe/H] =−0.48 ± 0.05 and a high local nor-malization of 15± 7%. In Paper II, we have also determined the gravitational force perpendicular to the galactic plane and the mass density in the galactic plane (Σ = 67M$pc−2) and
thick-ness of the disk (390+330
−120 pc). We found no vertex deviation for
old stars, consistent with an axisymetric Galaxy. After these two papers, we have enlarged and improved our samples to further study the local thin disk. We have observed a large sample of lo-cal Hipparcos clump giants at high spectral resolution and high signal-to-noise ratio, and measured their metallicity and elemen-tal abundances (Mishenina et al. 2006). Combined with a com-pilation of other studies providing metallicities of nearby clump giants, we have built a large unbiased sample of local giants to investigate the kinematic and chemical distributions of these stars. Our previous sample of distant giants was based on high resolution, low signal-to-noise spectra for 387 stars, spanning
Send offprint requests to: [email protected]
" Based on observations made at the Observatoire de Haute-Provence
(OHP, France).
"" Full Tables 1 and 2 are only available electronically at the
CDS via anonymous ftp to cdsarc.u-strasbg.fr (130.79.128.5) or via http://cdsweb.u-strasbg.fr/cgi-bin/qcat?J/A+A/
distances up to z=800 pc above the galactic plane, in the direc-tion of the North Galactic Pole (NGP). The new distant sample now includes 523 stars up to z=1 kpc, with improved distance and metallicity determinations.
These two improved samples, local and distant, have also been used for other purposes, presented in separate papers. Kovtyukh et al. (2006) use the local sample to establish an accurate temperature scale for giants using line-depth ratios. Mishenina et al. (2006) investigate mixing processes in the atmo-sphere of clump giants. Bienaym´e et al. (2005), hereafter Paper III, apply two-parameter models to the combination of the local and distant samples to derive a realistic estimate of the total sur-face mass density within 0.8 kpc and 1.1 kpc from the Galactic plane, respectively Σ0.8 kpc=59-67 M$pc−2 and Σ1.1 kpc=59-77
M$pc−2.
Here we use these new data to focus on the local properties of the thin disk that are important to constrain its chemical and dynamical evolution : metallicity distribution, vertical metallic-ity gradient, age - metallicmetallic-ity relation (AMR) and age - velocmetallic-ity relation (AVR). Numerous studies of these properties have been published, with however considerable disagreements reflecting the variety of tracers (open clusters, planetary nebulae, field dwarfs), discrepant metallicity scales, different age determina-tions, or selection biases. A major contribution to the subject comes from the Geneva-Copenhagen survey of the Solar neigh-bourhood by Nordstr¨om et al. (2004), which includes stellar pa-rameters similar to ours, but for a much larger sample of dwarfs, and with photometric, less reliable, metallicities. In the present work, the use of distant giants allows us to probe larger distances above the galactic plane where kinematic distributions are no longer affected by local streams and moving groups, as studied
Article published by EDP Sciences and available at http://www.aanda.org/aa
by Famaey et al. (2005). Moreover, giants are well suited for age determinations, as shown in da Silva et al. (2006). We use their Bayesian method with isochrone fitting to compute ages and, similarly to them, we use the complete resulting probability dis-tribution function of each star to bin the age axis. The combina-tion of this method with the fact that we use spectrocopic metal-licities for a large, homogeneous and complete sample, with well defined boundaries in magnitude and colour, should ensure that the new relations that we obtain are reliable. We have also com-puted for each star its probability of belonging, on kinematical criteria, to the thin disk, the thick disk, the Hercules stream and the halo, in order to reject the most probable non thin disk stars. Sections 1 and 2 describe the local and distant samples. We give details on the TGMET method and the new reference library that have been used to improve the determination of Teff, log g,
[Fe/H], and Mvfor the distant giants observed at high spectral
resolution, but low signal-to-noise (Section 2.2). Sections 3 and 4 describe the determination of ages, Galactic orbits and popu-lation membership. Then we select the most probable thin disk clump giants and demonstrate the existence of a vertical metal-licity gradient (Section 5.1). We present the AMR derived from the same stars in Section 5.2, and in Section 5.3 we discuss the AVR in U, V and W derived from a larger sample of clump gi-ants where the most probable thick disk, Hercules stream and halo members have been rejected.
2. The local sample of Hipparcos giants
The sample of local giants, dominated by clump giants, contains the 381 single Hipparcos field stars with the following criteria :
π≥ 10 mas δICRS ≥ −20◦ 0.7≤ B − V ≤ 1.2
MV≤ 1.6
where π is the Hipparcos parallax and δICRS the declination. It is thus a complete sample. The Johnson B-V colour has been obtained from the Tycho2 BT − VT colour applying Eq. 1.3.20
from ESA (1997) : B− V = 0.850 (BT− VT).
Absolute magnitudes Mv were computed with V
appar-ent magnitudes resulting from the transformation of Hipparcos magnitudes Hp to the Johnson system, calibrated by Harmanec
(1998).
Radial velocities have been mainly compiled from observa-tions on the ELODIE spectrograph at Observatoire de Haute-Provance (OHP). About 177 local giants have been observed for this project (Mishenina et al. 2006); radial velocities of other stars were retrieved from the ELODIE library (Prugniel & Soubiran 2001, 2004) and the ELODIE archive (Moultaka et al. 2004). For the remaining stars, we used the radial veloc-ities in Famaey et al. (2005) and Barbier-Bossat et al. (2000). In summary, we have radial velocities for 220 stars in the various ELODIE datasets, for 54 stars in Famaey et al’s catalogue, for 107 stars in Barbier-Bossat et al’s catalogue. We have also used information about the binarity of the stars. We have flagged 30 suspected spectroscopic binaries presenting an enlarged or dou-ble peak of their cross-correlation function.
Atmospheric parameters (Teff, log g, [Fe/H]) have been
com-piled from the [Fe/H] catalogue (Cayrel de Strobel et al. 2001) updated with a number of recent references. The [Fe/H] cat-alogue is a bibliographical compilation which lists determina-tions of atmospheric parameters relying on high resolution, high
signal-to-noise spectroscopic observations and published in the main astronomical journals. We have added to the compilation effective temperatures determined by Alonso et al. (2001), di Benedetto (1998), Blackwell & Lynas-Gray (1998) and Ram´ırez & Mel´endez (2005). A number of other recent references pro-viding spectroscopic (Teff, log g, [Fe/H]) have been added to
the [Fe/H] catalogue in an effort to keep it up to date. For the present work, the largest contributions come from Mishenina et al. (2006) for 177 stars and da Silva et al. (2006) for 14 stars. For the older references, which were already in Cayrel de Strobel et al. (2001), the largest contribution comes from McWilliam (1990) for 233 stars. This compilation provided [Fe/H] for 363 stars, adopting a weighted average when several values where available for a given star (a higher weight was given to the most recent references). For 5 remaining stars, an ELODIE spectrum was available, enabling the determination of atmospheric param-eters with the TGMET method (see next section). We thus have just 13 stars that lack atmospheric parameters, representing 3% of the whole local sample.
Combining atmospheric parameters from different sources can be a source of errors if some verifications are not made. Not all authors of spectroscopic analyses use the same temperature scales, Fe lines, and atomic data so that systematic differences may occur in the resulting metallicities. In the present work, our narrow ranges in colour and luminosity suggest we deal with a very limited range of atmospheric parameters where temperature determinations from different methods usually agree well. This is confirmed in our sample where 99 stars have at least two dif-ferent determinations of Teff. Computing the mean Tefffor each
of these 99 stars, we find standard deviations ranging from 0 to 140 K, with a median value of 40 K, which is below the com-monly obtained external error on effective temperatures (∼ 50-80 K). Only 6 stars show Teffdeterminations deviating by more than
100 K. Similar verifications were made for [Fe/H] : the median value of standard deviations around the mean for stars with at least two determinations is 0.09 dex.
Hipparcos proper motions and parallaxes have been com-bined with radial velocities through the equations of Johnson & Soderblom (1987) to compute the 3 velocity components (U, V, W) with respect to the Sun (the U axis points towards the Galactic Center).
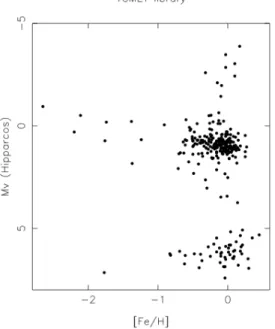
Figure 1 shows the distribution of this sample in the planes Mvvs Teff, Mvvs [Fe/H] and V vs U.
3. The distant NGP sample
The distant sample has been drawn from the Tycho2 catalogue (Høg et al. 2000). We have applied similar criteria as in Soubiran et al. (2003) to build the list of red clump candidates, extending the limiting apparent magnitudes to fainter stars. A detailed de-scription of the sample can be found in Paper III. The resulting sample consists of 523 different stars on a 720 square degree field close to the NGP. The Tycho2 catalogue provides accu-rate proper motions and V magnitudes. High resolution spec-troscopic observations by ELODIE allowed us to measure radial velocities, spectroscopic distances and metallicities.
3.1. Spectroscopic observations, radial velocities
The observations were carried out with the echelle spectrograph ELODIE on the 1.93 m-telescope at the Observatoire de Haute Provence. The performances of this instrument are described in Baranne et al. (1996). Compared to our previous study in Paper I,
Fig. 1. Our local sample in the Mv vs Teff, Mv vs [Fe/H] and V vs U
diagrams
141 additional spectra have been obtained in Febuary and March 2003. The resulting 540 spectra cover the full range 390 – 680 nm at a resolving power of 42 000. The reduction has been made at the telescope with the on-line software which performs the spectrum extraction, wavelength calibration and measurement of radial velocities by cross-correlation with a numerical mask. The radial velocity accuracy is better than 1 km s−1for the considered stars (K stars). Our sample spans radial velocities from –139 to 85 km s−1with a mean value of−12.8 km s−1. The mean S/N of the spectra at 550 nm is 22. About 17 stars have been observed twice. For 13 stars, the correlation peak was enlarged or dou-ble, indicating the probable binarity of these stars which were flagged.
3.2. Stellar parameters (Teff, log g, [Fe/H], Mv)
We have performed the determination of stellar parameters Teff,
log g, [Fe/H] and Mv from ELODIE spectra using the code
TGMET (Katz et al. 1998), like in Paper I. TGMET relies on the comparison by minimum distance of target spectra to a library of stars with well known parameters, also observed with ELODIE (Soubiran et al. 1998, Prugniel & Soubiran 2001). As compared to Paper I, we have improved the content of the TGMET library because we were aware that the quality of TGMET results are very dependent of the quality of the empirical library used as a reference. We present in this section the library that we built for the present study dealing with clump giants. We also present the tests performed to assess the reliability of the TGMET parame-ters.
The TGMET library must be built with reference spectra rep-resentative of the parameter space occupied by the target stars, with a coverage as dense as possible. The parameters of the refer-ence spectra must be known as accurately as possible. Since our previous study of clump giants at the NGP, in papers I and II, the TGMET library has been improved considerably. Many stars with well determined atmospheric parameters, compiled from the literature, and with accurate Hipparcos parallaxes, have been added to the library as reference stars for Teff, log g, [Fe/H] and
MV. In particular the Hipparcos giants observed with ELODIE
to build the local sample and analysed by Mishenina et al. (2006) have been added to the library. Fig. 2 shows the distribution of the TGMET library used for this study in the plane ([Fe/H], MV).
The clump area is densely covered down to [Fe/H] =−0.80. A small part of the TGMET library is presented in Table 1. The full Table is only available in electronic form, at the CDS. The calibrated Echelle spectra can be retreived from the ELODIE archive1.
In order to verify the TGMET results, we have run the code on ELODIE spectra of stars chosen in the library, with the best known parameters, degraded to a S/N typical of our target spec-tra (i.e. S/N=20). We have applied a bootsspec-trap method : each test spectrum was removed in turn from the library, degraded to S/N=20, and its parameters determined by comparison to the rest of the library. To check results on MV, we have selected the
158 stars of the library with a relative error on their Hipparcos parallax lower than 10% and with 0.9≤ B−V≤ 1.1. For [Fe/H] we selected 199 stars with 0.9≤ B−V≤ 1.1 having the most reli-able spectroscopic metallicity determinations found in the liter-ature. MVand [Fe/H] determined from TGMET were then
com-pared to their Hipparcos and literature counterpart, as shown in Figs. 3 and 4. The rms of the comparison, respectively 0.25 mag and 0.13 dex for MVand [Fe/H], measure the accuracy of the
Table 1. Data and stellar parameters compiled for the TGMET library : HD/BD number, date of observation, Teff, log g, [Fe/H], MV, quality flags
qt, qf and qm for Teff, [Fe/H] and MVrespectively (0 : data not available, 1 : poor, ... 4 : high), S/N of ELODIE spectrum at 550 nm, radial velocity,
B− V, spectral type. The full table for all 724 stars is available electronically at the CDS. The corresponding Echelle spectra can be retreived from the ELODIE archive.
HD/BD date Teff log g [Fe/H] MV qt qf qm S/N RV B− V ST
K dex km s−1 BD+430699 20040203 4760 4.68 -0.41 6.916 424 130.6 7.41 0.972 K2 BD+522815 20040902 7.914 003 95.9 -52.66 1.164 K5 BD-004234 19970826 4574 4.32 -0.84 6.237 233 79.2 -127.58 0.968 K3Ve+... HD001227 19970822 5037 2.65 +0.25 0.465 422 101.1 -0.04 0.910 G8II-III HD002506 20001216 1.245 003 72.0 -59.33 0.933 G4III HD002910 20031101 4745 2.75 +0.10 0.904 434 218.8 -13.46 1.074 K0III HD003546 19961003 4878 2.38 -0.69 0.780 344 120.9 -84.14 0.843 G5III... HD003651 20011125 5192 4.42 +0.14 5.650 444 136.1 -33.06 0.849 K0V HD003712 19970822 4594 2.14 -0.10 -1.973 423 376.0 -4.49 1.182 K0II-IIIvar HD003765 19951030 5067 4.45 +0.10 6.158 434 135.8 -63.32 0.953 K2V HD004188 20031101 4816 2.79 +0.04 0.734 434 156.0 -0.41 1.006 K0IIIvar HD004256 20040903 4930 4.80 +0.34 6.299 324 111.1 9.33 1.006 K2V HD004482 20021023 4917 2.65 +0.02 0.991 424 151.7 -2.61 0.977 G8II HD004628 20010813 5040 4.64 -0.25 6.360 444 147.1 -10.35 0.876 K2V HD004635 20031103 5129 6.072 303 155.1 -31.75 0.916 K0 ... ... ... ... ... ... ... ... ... ... ... ... ... ... ... ... ... ... ... ... ... ...
Fig. 2. Distribution of the TGMET library used in this study (724
ref-erence stars observed with ELODIE) in the plane metallicity - absolute magnitude.
TGMET results at S/N=20. The rms of MV corresponds to an
error in distance of 12%.
In order to test the internal precision of TGMET on [Fe/H], we compared the results obtained for the 17 stars observed twice (Fig. 5). As can be seen, the agreement is very good (rms=0.05 dex).
An important verification has to be made to check that TGMET does not introduce a bias in the absolute magnitude and metallicity distributions of giants. In the following sections, parameters of distant giants, relying on TGMET, will be com-pared to parameters of local giants, relying on literature and Hipparcos data. We thus have to ensure that these parameters
Fig. 3. Comparison of TGMET absolute magnitudes from degraded
spectra to those deduced from Hipparcos parallaxes for a subset of 158 reference stars.
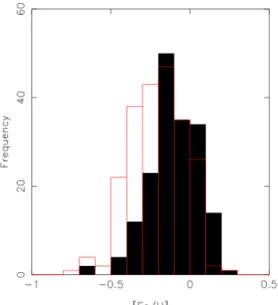
are on the same scales. Fig. 6 shows the histograms of abso-lute magnitudes of the library’s giants deduced from Hipparcos and deduced from the bootstrap test on degraded spectra, in 0.25 mag bins. Similarly, Fig. 7 shows the two metallicity histograms, from the literature and from the bootstrap test. These histograms are perfectly aligned and present similar dispersions which im-plies a lack of bias in the TGMET results.
3.3. Distances, spatial velocities
Distances have been computed for all the target stars from the TGMET Mv and Tycho2 VT magnitude transformed into Johnson V. No correction of interstellar absorption was applied since it is supposed to be very low in the NGP direction. Proper motions, distances and radial velocities have been combined to compute the 3 velocity components (U, V, W) with respect to the Sun.
Fig. 4. Comparison of TGMET metallicities from degraded spectra to
those from the literature for a subset of 199 reference stars.
Fig. 5. Comparison of the TGMET metallicities obtained for the 17
tar-get stars observed twice (rms=0.05 dex).
Figure 8 shows the distribution of the 523 target stars in the planes Mvvs Teff, Mvvs [Fe/H] and V vs U.
4. Ages, Galactic orbits
Ages have been computed with the code PARAM developed by L. Girardi, available via an interactive web form2. The method
was initially developed by Jørgenson & Lindegren (2005) and slightly modified as described in da Silva et al. (2006). It is a Bayesian estimation method which uses theoretical isochrones computed by Girardi et al. (2000) taking into account mass loss along the red giant branch. A convincing application of the method to derive the fundamental parameters of evolved stars in an open cluster is presented in Biazzo et al. (2007). Inputs to be given to the code are the observed effective temperatures, abso-lute magnitudes, metallicities and related errors. The output for each star is a probability distribution function (PDF) of the age (and other parameters that are not used here). As shown in da
2 http://stev.oapd.inaf.it/param
Fig. 6. Absolute magnitude histograms of the library’s giants deduced
from Hipparcos (filled) and deduced from the bootstrap test on degraded spectra (red line).
Fig. 7. Metallicity histograms of the library’s clump giants deduced
from the literature (filled) and deduced from the bootstrap test on de-graded spectra (red line).
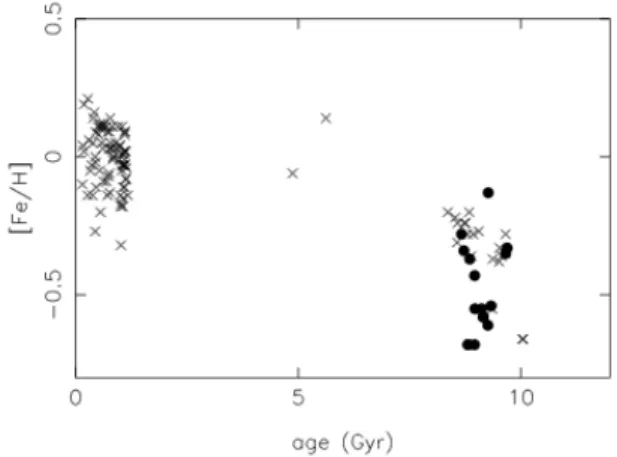
Silva et al. (2006), in their Fig. 5, the PDF of ages can be asy-metric or even double peaked, especially in the case of red clump giants. As a consequence, ages are accurate for only a tiny part of our sample. This should be kept in mind when using indi-vidual ages. Nevertheless the ages have significance when used statistically. As a proof, the age-metallicity plot for the 891 stars (Fig. 9) shows a regular trend and a remarkably low dispersion compared to other studies (e.g. Nordstr¨om et al. 2004, da Silva et al. 2006). The 143 stars (83 local, 60 distant) with relative age errors < 25% have been highlighted in Fig. 9. Considering only these stars, we measure a mean metallicity of -0.06 with a dispersion of 0.10 dex for stars younger than 2 Gyr, whereas the mean metallicity of older stars (age > 8 Gyr) is -0.44 with a
Fig. 8. The NGP sample in the Mv vs Teff, Mv vs [Fe/H] and V vs U
diagrams.
dispersion of 0.27 dex. There is no young star with a metallicity lower than -0.32, and no old star with a metallicity higher than -0.13, contrary to common findings in samples of dwarfs, as for instance in Feltzing et al. (2001) and Nordstr¨om et al. (2004). This is important property of our sample, because the existence of old metal-rich stars is often mentioned to explain the large dispersion of the AMR (Haywood 2006). We come back to the AMR of the thin disk in Sect. 5.
Fig. 9. Age - metallicity diagram for the 891 stars. Stars (83 local, 60
distant) with relative age errors lower than 25 % are highlighted as large filled circles.
The orbital parameters have been computed by integrat-ing the equations of motion in the galactic model of Allen & Santillan (1993), adopting a default value of 4 Gyr as the inte-gration time. The adopted velocity of the Sun with respect to the LSR is (9.7, 5.2, 6.7) km s−1(Bienaym´e 1999), the solar galac-tocentric distance R$=8.5 kpc and circular velocity VLSR=220
km s−1.
5. Population membership
The U vs V velocity distributions of the local and distant samples can be compared from Figures 1 and 8. It is clear, from these plots, that the two samples contain different kinematical populations. In the local sample, the velocities are clumpy and reflect moving groups and superclusters that dominate the kinematics in the solar neighbourhood. Compared to Fig. 9 of Famaey et al. (2005), we can identify the Hercules stream at (U, V)( (−40, −50) km s−1, the Hyades-Pleiades supercluster at (U, V)( (−30, −20) km s−1, and the Sirius moving group at
(U, V) ( (0, 0) km s−1. There are very few high velocity stars
that could correspond to the thick disk. On the contrary, the velocities of the distant sample are better mixed with higher dispersions. This reflects the dynamical heating of the disk together with the growing number of thick stars with increasing distance to the plane. In order to build a sample of pure thin disk stars, we have performed the classification of all the stars into different kinematic populations. We have taken into account the Hercules stream because its velocity ellipsoid is intermediate between that of the thin disk and the thick disk, and is likely to contaminate both populations. We did not attempt to distinguish the other groups of the thin disk.
We assign to each star its probability of belonging to the thin disk, the thick disk, the Hercules stream and the halo on the ba-sis of its (U, V, W) velocity and the velocity ellipsoids of these populations, in the same way as Soubiran & Girard (2005) and with similar kinematical parameters of the populations. In the distant sample we find that 305 stars and 65 stars have a proba-bility higher than 80% of belonging to the thin disk and the thick disk respectively. In the local sample, the numbers are 304 and 11.
One important question that we can immediately investigate with this kinematical classification is whether the thin disk and the thick disk overlap in age and metallicity. Our data strongly suggest that this is the case. Fig. 10 shows with different symbols the age-metallicity diagram for the most probable thin disk and the thick disk stars, restricted to relative age errors lower than 25 % (suspected binaries rejected). The oldest thin disk stars and thick disk stars overlap in the metallicity range -0.30≤ [Fe/H] ≤ -0.70, and age range 8-10 Gyr. There are no young thick disk stars.
Fig. 10. Age - metallicity diagram for stars with relative age errors lower
than 25 % and belonging to the thin disk (crosses) and the thick disk (filled circles).
All the parameters determined as described in the previous sections are presented in Table 2. The full table with all 891 stars is available in electronic form at the CDS. The file with the age PDFs is also available upon request.
T able 2. Stellar parameters of the program me stars deri ved in this w ork. The four columns p1, p2, p 3 and p4 refer to the probability of belonging to the thin disk, the thick disk, the Hercules stream and the halo respecti vely .SB = b indicate a suspected spectrosco pic binary . ID Mv B − V [Fe /H] U V W Rmin Rmax |Zmax | ecc d age σage p1 p2 p3 p4 SB de x km s − 1 km s − 1 km s − 1 kpc kpc kpc pc Gyr Gyr ... ... ... ... ... ... ... ... ... ... ... ... ... ... ... .. .... ... ... HD166229 1.471 1.165 0.01 50.3 -38.6 6.9 5.80 9.40 0.17 0.24 64 2.68 0.96 0.89 0.1 1 0.00 0.00 HD169913 1.510 1.050 0.00 -25.4 -5.6 0.4 7.96 8.87 0.08 0.05 100 1.32 0.39 0.98 0.0 2 0.00 0.00 HD171994 1.549 0.882 -0.23 -45.1 -15.9 -4.6 7.10 9.18 0.03 0.13 90 1.74 0.54 0.97 0.0 3 0.00 0.00 HD180610 1.525 1.160 -0.01 14.7 -25.6 -10.4 6.90 8.74 0.05 0.12 50 7.01 2.02 0.96 0.0 4 0.00 0.00 HD192836 1.321 1.040 0.01 3.5 -9.2 -8.3 7.99 8.66 0.02 0.04 91 1.85 1.18 0.98 0.0 2 0.00 0.00 HD196134 1.564 0.984 -0.14 25.1 -2.9 -17.9 7.77 9.58 0.14 0.10 97 4.46 1.94 0.98 0.0 2 0.00 0.00 HD198431 1.453 1.061 -0.37 -52.3 -42.4 -20.3 5.76 8.94 0.17 0.22 77 9.55 1.69 0.35 0.0 8 0.57 0.00 HD211006 1.461 1.175 0.07 -22.1 -23.4 -8.7 7.11 8.59 0.04 0.09 77 4.88 1.79 0.96 0.0 3 0.01 0.00 HD212943 1.336 1.040 -0.34 34.9 -16.1 -82.9 7.36 9.85 1.69 0.15 49 8.72 1.94 0.06 0.9 2 0.00 0.02 HD214995 1.363 1.101 -0.09 -29.7 -36.6 -4.9 6.28 8.64 0.05 0.16 82 6.36 2.36 0.73 0.0 6 0.21 0.00 HD221833 1.585 1.155 0.02 24.0 3.5 -3.0 7.94 9.95 0.10 0.11 95 5.57 2.35 0.98 0.0 2 0.00 0.00 T0880-00075 0.693 0.918 -0.49 -40.4 -33.9 81.8 7.05 9.10 2.21 0.13 423 4.62 2.72 0.02 0.9 7 0.00 0.01 T0880-00132 0.941 1.062 -0.11 -30.6 -20.8 -22.9 7.27 8.72 0.35 0.09 266 3.93 1.67 0.92 0.0 7 0.01 0.00 T0880-00746 2.416 0.996 0.14 8.1 -33.2 3.8 6.51 8.62 0.24 0.14 197 3.71 1.14 0.90 0.0 7 0.03 0.00 T0881-00374 1.327 1.085 -0.10 3.5 -38.4 -38.5 6.33 8.56 0.67 0.15 425 6.87 2.21 0.61 0.2 7 0.12 0.00 T0881-00435 0.816 1.000 -0.27 -46.7 -16.7 6.3 7.18 9.20 0.37 0.12 316 4.69 2.70 0.95 0.0 5 0.00 0.00 T0881-00494 0.948 1.049 -0.21 44.2 -69.6 -5.9 4.47 8.99 0.27 0.34 272 4.28 2.71 0.18 0.8 0 0.01 0.00 T0885-00642 1.105 1.044 -0.10 -54.7 -11.7 -13.5 7.22 9.57 0.35 0.14 322 4.03 1.73 0.94 0.0 6 0.00 0.00 T0888-00115 0.680 1.016 -0.28 -6.2 -3.6 5.9 8.40 8.72 0.33 0.02 283 3.94 2.37 0.97 0.0 3 0.00 0.00 T0888-00875 1.427 0.983 -0.20 18.3 -1.3 -33.6 7.89 9.61 0.45 0.10 210 8.33 2.11 0.93 0.0 7 0.00 0.00 T0889-01220 0.737 0.995 -0.30 -66.1 -34.2 7.5 6.04 9.38 0.30 0.22 223 4.47 2.51 0.55 0.1 2 0.33 0.00 T0897-00666 0.679 0.955 -0.44 -78.2 -31.4 1.3 5.98 9.81 0.24 0.24 205 4.25 2.11 0.63 0.1 5 0.21 0.00 T0897-00860 1.278 1.053 -0.01 5.7 -10.7 -5.4 7.80 8.75 0.38 0.06 378 3.03 1.16 0.97 0.0 3 0.00 0.00 T1442-00319 0.902 0.946 -0.64 49.1 5.2 -22.5 7.40 11.23 0.54 0.21 397 5.93 2.88 0.94 0.0 6 0.00 0.00 b T1442-00453 1.404 0.941 -0.56 27.8 -104.7 -28.4 3.17 8.71 0.39 0.47 247 7.23 2.96 0.00 0.9 9 0.00 0.01 ... ... ... ... ... ... ... ... ... ... ... ... ... ... ... .. .... ... ... ... ... ... ... ... ... ... ... ... ... ... ... ... ... ... .. .... ... ...
6. The thin disk traced by clump giants
Among the many studies that can be performed with the new sample presented here, we focus on the properties of the thin disk probed for the first time up to large distances above the Galactic plane, from a complete stellar sample and with 3D kine-matics and spectroscopic metallicities. In order to work with a homogeneous sample, with well defined boundaries in both its local and distant counterparts, we have selected clump giants on the basis of a colour and absolute magnitude restriction : 0.9 ≤ B − V ≤ 1.1, 0.0 ≤ Mv ≤ 1.6. According to Koen &
Lombard (2003), this ensures the lowest contamination by other giants. Rejecting suspected binaries, 597 stars fall into these lim-its. We further restrict the sample to the 396 stars having a prob-ability higher than 80% of belonging to the thin disk. In this section we investigate some basic distributions of this sample. 6.1. Raw metallicity distribution and vertical gradient
We compare the metallicity distributions of the local and dis-tant clump giants in Fig. 11. The local sample has an average of [Fe/H]=-0.11 and a standard deviation of σ[Fe/H] = 0.15
whereas the distant sample has an average of [Fe/H]=-0.21 and a standard deviation of σ[Fe/H]=0.17. The metallicity
distribu-tion of the thin disk is thus significantly shifted towards lower values at larger distances above the galactic plane. This is not due to the comparison of metallicities coming from the literature for the local sample and from TGMET for the distant sample since we have verified that the two scales are consistent (Sect. 2.2). More likely this difference indicates a vertical metallic-ity gradient which is represented in Fig. 12, using as the dis-tance the maximum height from the plane, Zmax, reached by the star in its galactic orbit. A linear fit indicates a gradient of ∂[Fe/H]/∂Z =−0.31 ± 0.03 dex kpc−1. Taking for each star its current distance from the plane, instead of Zmax, leads to a con-sistent result of ∂[Fe/H]∂z =−0.30 ± 0.03 dex kpc−1.
According to numerous previous studies, the existence of a vertical metallicity gradient in the thin disk seems to be firmly established. However the value of its amplitude, constrained by the observation of different kinds of tracers at various distances from the Sun still oscillates between ∼ -0.25 and -0.35 dex kpc−1. Using open clusters, Piatti et al. (1995) find -0.34 dex kpc−1 whereas Carraro et al. (1998) measure -0.25 dex kpc−1 and Chen et al. (2003) measure−0.295 ± 0.050 dex kpc−1. Like
ours, other studies are based on field stars and have used kine-matic information to select thin disc stars. This is the case of Marsakov & Borkova (2006) who have selected the most prob-able thin disk stars in their compilation of spectroscopic abun-dances, using their 3D velocties and orbital parameters. They measure a gradient of -0.29± 0.06 dex kpc−1. Bartaˇsi¯ut˙e et al.
(2003) observed 650 stars at high galactic latitude, up to 1.1 kpc, and identified thin and thick disk stars on the basis of their rota-tional lag. They measure a gradient of -0.23± 0.04 dex kpc−1in
the thin disk.
The direct comparison of the metallicity distribution of our sample with other distributions probing different galactic vol-umes would imply a scaleheight correction. The reason is that metal-poor stars, which have hotter kinematics, have a larger scaleheight than more metal-rich stars, and may be under-represented in local samples. A correction, relying on a mass model of the disk, would thus increase the number of metal-poor stars with hotter kinematics which would have been missed in our sample. On the contrary, stars more metal-rich than the Sun are supposed to be over-represented in local samples (see
for instance Fig. 3 in Haywood 2006). We have not attempted to correct for such a bias in our sample and we restrict the discus-sion here to a qualitative comparison between dwarfs and giants. When we compare the metallicity distribution of clump gi-ants to that of dwarfs, as presented by Haywood (2002), we find a good agreement for the metal-poor side. We confirm with this new sample Haywood’s finding that the thin disk is not an impor-tant contributor to stars with [Fe/H] < -0.5. We find that 2.5% of our sample has [Fe/H] < -0.5 with the most metal-poor thin disk giant at [Fe/H]=-0.71. According to Fig. 3 in Haywood (2006), the scaleheight correction factor is between∼ 1.5 and 3.5 in the metallicity range -0.70 < [Fe/H] < -0.50. Taking this correction into account would not substantially change our findings.
On the contrary, we find a significant difference between clump giants and dwarfs for the metal-rich side of the [Fe/H] his-togram. Haywood (2002) finds that 40-50% of long-lived dwarfs have a metallicity higher than [Fe/H]=0 whereas the proportion is only 20% in our local sample and 13% in our distant sample. Super Metal-Rich ([Fe/H] > +0.20) FGK dwarfs are quite usual in the Solar Neighbourhood, but we have only two thin disk clump giants at [Fe/H]=+0.21 and [Fe/H]=+0.27. Our first guess was that such a low ratio of metal-rich stars was correlated with the colour cutoffs that we used to restrict the sample to clump gi-ants. We have verified that this is not the case by comparing the metallicity histograms of local giants (0≤ Mv≤ 1.6) in the B-V
intervals [0.9; 1.1] and [0.7; 1.2]. We found that the metal-poor sides are similar. The ratio of metal-rich stars is slightly higher in the extended colour interval : 24% instead of 20%. We con-clude that our adopted colour cutoff affects the metallicity distri-bution such that metal-rich stars are slightly under-represented. This bias is however not sufficient to reconcile the metallicity distribution of clump giants with that of dwarfs.
Pasquini et al. (2007) also noticed a difference in the metal-licity distribution of giants and dwarfs hosting planets. They pro-pose as an interpretation the pollution of stellar atmospheres, causing a metal excess visible in the thin atmosphere of dwarfs, while diluted in the extended envelope of giants. Our sample suggests that the difference is not limited to stars hosting planets so that the pollution hypothesis should be investigated in a more general context. If validated in the general case, it would imply that dwarfs are not appropriate to probe the chemical history of the Galaxy.
6.2. Age - metallicity relation
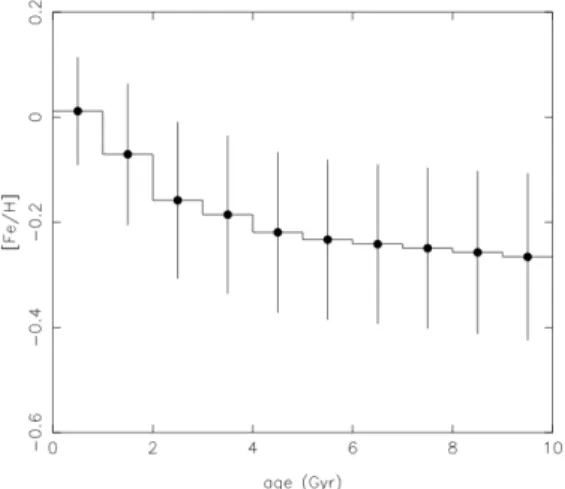
We use the same method as da Silva et al. (2006) to determine the AMR of the sample. For each time interval (∆t=1 Gyr), we measure the cumulative [Fe/H] by adding the measured [Fe/H] of each star weighted by its PDF. With such a method, a given star contributes to several bins which are consequently not inde-pendant. However it is a good way to take errors on ages into account. The mean metallicity and dispersion per age bin are presented in Fig. 13 and Table 3. A remarkable result is the low dispersion obtained at all ages. Subtracting the estimated ob-servational error (0.09 dex for local stars, 0.13 dex for distant stars) yields to a cosmic scatter in [Fe/H] lower than 0.12 dex. A transition occurs around 4 Gyr in both the mean metallicity and dispersion. From 10 Gyr to 4 Gyr, we see a very smooth and regular increase of the mean metallicity, 0.01 dex per Gyr, with constant spread, which characterizes an homogeneous interstel-lar medium. An upturn occurs at 4 Gyr with a steeper metallicity rise at younger ages.
What is the current knowledge of the AMR in the Solar Neighbourhood and how does our relation compare with
previ-Fig. 11. Metallicity distribution of thin disk clump giants of the local
(filled) and distant samples (red line).
Fig. 12. Vertical gradient in the metallicity distribution of thin disk
clump giants.
ous ones ? Despite numerous studies on the subject over nearly 30 years, there is still no consensus on the existence or not of a slope in the AMR, nor in the amplitude of the cosmic scatter. Major contributions like Edvardsson et al. (1993), Feltzing et al. (2001) and Nordstr¨om et al. (2004), using classical isochrone ages, find little evidence for a slope in the relation of [Fe/H] with age, and a broad dispersion (σ[Fe/H] > 0.20 dex). In contrast,
Rocha-Pinto et al. (2000), using chromospheric ages, find a sig-nificant trend in the AMR, with lower dispersion (σ[Fe/H]∼ 0.12
dex). Pont & Eyer (2004) have re-analysed Edvardsson et al.’s sample with a Bayesian approach and also find a significant trend with a dispersion σ[Fe/H]< 0.15 dex. We note that all these
stud-ies involve nearby dwarf stars. To our knowledge, the only AMR based on giants is that of da Silva et al. (2006). Despite the small size of their sample, they find like us metallicities rising from [Fe/H]∼ -0.23 at 10.5 Gyr to [Fe/H] ∼ 0.00 at 0.5 Gyr. The shape of their AMR is however different to ours, shallower at young ages and steeper at old ages. The dispersion of their AMR
Table 3. Age-metallicity relation derived from our sample of thin disk
clump giants. N is the number of stars contributing to each age bin. It is fractional because we use the complete probability function of each star to bin the age axis (see text).
< t > (Gyr) < [Fe/H] > σ[Fe/H] < N >
0.5 +0.01 0.10 43.8 1.5 -0.07 0.13 79.3 2.5 -0.16 0.15 54.6 3.5 -0.19 0.15 41.9 4.5 -0.22 0.15 34.1 5.5 -0.23 0.15 28.1 6.5 -0.24 0.15 28.5 7.5 -0.25 0.15 22.2 8.5 -0.26 0.16 15.3 9.5 -0.27 0.16 15.7
is also much larger than ours, reaching 0.30 dex in the oldest age bins.
We notice that the rather large metallicity variation that we observe in the 4 youngest bins in our AMR is also visible in the AMR derived by Nordstr¨om et al. (2004) and by Feltzing et al. (2001). Both studies interpret this feature as a bias against young metal-poor dwarfs due to a colour cutoff. This explaination is not valid for our sample since we have verified that our colour cutoffs only slightly affect the metal-rich part of the metallic-ity distribution (see previous Sect.). We thus conclude that this peculiar shape of the AMR is real.
Piatti et al. (1995) and Carraro et al. (1998) have corrected their AMR for the positional dependency, justified by the use of open clusters. Open clusters have a wide spatial distribution and trace different histories of the chemical evolution, depending on their galactocentric distances. The AMR has thus to be corrected for the observed radial metallicity gradient, which has an ampli-tude of 0.07 dex kpc−1according to Piatti et al. (1995), or 0.09 dex kpc−1according to Carraro et al. (1998). Field stars are also supposed to be affected by a radial metallicity gradient. A con-sequence of orbital diffusion is that samples of nearby stars may include stars born in the inner or outer parts of the disk where the chemical enrichement may have been different from that of the Solar Neighbourhood. Such stars are easily recognized by their orbital parameters Rmin and Rmax, respectively perigalactic ra-dius and apogalactic rara-dius, different from that of the true local stars. Edvardsson et al. (1993) have studied the AMR for stars restricted to the solar circle and still found a large and signifi-cant scatter. Our sample of thin disk clump giants is free of the influence of stars from other galactocentric distances since our kinematical selection has naturally eliminated stars on eccentric orbits.
The question of whether the AMR should be corrected for the vertical metallicity gradient is more difficult to assess. We note that Carraro et al. (1998) have not attempted to correct their open cluster AMR for the observed vertical metallicity gradient. Moreover they argue that ”In the case of field stars, orbital diffu-sion is expected to be effective enough to smooth out a vertical metallicity gradient within a single-age population, so that the vertical structure of the disk is dominated by the different scale-heights of different age populations”. In the case of field star AMRs, while the radial migration is often refered to (Edvardsson et al. 1993, Haywood 2006), the influence of the vertical metal-licity gradient is not discussed.
Fig. 13. Age - metallicity relation of thin disk clump giants. The error
bars represent the dispersion in each bin, including observational errors and cosmic scatter.
6.3. Age - velocity relation
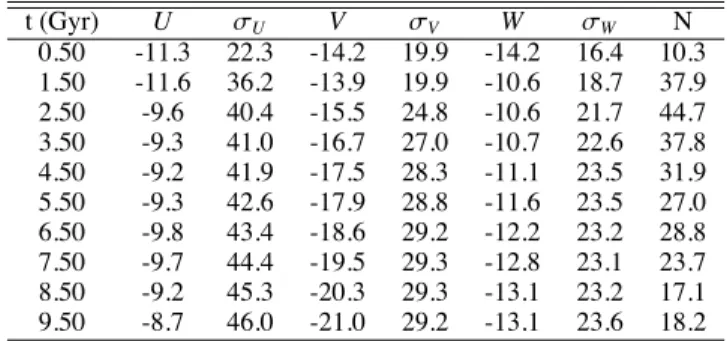
The thin disk AVR has been revisited recently by Seabroke & Gilmore (2007) using the data of Nordstr¨om et al. (2004) and Famaey et al. (2005). They show that the kinematical streams in these local samples do not permit one to safely constrain the relations in the U and V directions, contrary to the W direction where the samples are well mixed. Our sample of clump giants, spanning larger distances from the Galactic plane, is well suited to investigate these relations. However, for such a purpose, we cannot work on the thin disk sample which was built to study the metallicity and age distributions, in Sections 5.1 and 5.2. Our se-lection of thin disk stars on a kinematical criterion has favoured stars in the central parts of the velocity ellipsoid, with moder-ate velocities, resulting in a serious kinematical bias. In order to study how the velocity dispersions increase with time, we also need to study the warmer part of the thin disk, but excluding as well as possible stars that do not follow the kinematical be-haviour of the thin disk. To do so, we consider our distant sample of clump giants and reject stars having a probability higher than 80% of belonging to the thick disk, the Hercules stream and the halo, resulting in 320 stars. Results are presented in Fig. 14 and Table 4.
An important question is whether the dispersions saturate at a given age of the thin disk. Seabroke & Gilmore (2007) have shown that local data are in agreement with several models of disk heating : continuous or with saturation at 4.5, 5.5 and 6.5 Gyr. Our data show evidence for a transition at∼ 5 Gyr, with saturation occuring in V at 29 km s−1 and in W at 24 km s−1. The velocity dispersion in U seems to increase smoothly, reach-ing 46 km s−1 at 9.5 Gyr. A consequence is that the velocity ellipsoid axis ratios σV/σU and σW/σU are not constant. The ratio σV/σUis related to the Oort constants and is expected to be∼0.5. Here this ratio varies from 0.55 at 1-2 Gyr to a maxi-mum value of 0.68 at 4-5 Gyr. The ratio σW/σUis related to the scattering process responsible for the dynamical heating of the disk. With our data, it has a maximum value of 0.56 at 4-5 Gyr. Although these ratios are supposed to be constant in an axisym-metric Galaxy, there are previous reports of variations related to colour or spectral type (e.g. Mignard 2000) .
Vallenari et al. (2006) also probed the thin disk kinematics towards the NGP. Their method is however significantly dif-ferent from ours since they analyse, through a galactic model,
proper motions and the colour magnitude diagram of∼ 15000 stars down to V=20. Their best-fit for the velocity dispersions of the thin disk, presented in 4 age bins, differs significantly from ours, especially in the oldest age bin (7-10 Gyr) where their val-ues are lower by 3σ.
Simple statistics on our sample gives (σU, σV, σW) = (41.5, 26.4, 22.1) km s−1 , significantly higher than values de-termined from late-type Hipparcos stars (e.g. Bienaym´e 1999, Mignard 2000). Although we cannot rule out the contamina-tion of the sample with thick disk stars, it closely compares to recent results by de Souza & Teixeira (2007) who show that Mignard’s sample is better explained by the superposition of 2 velocity ellipsoids, the hotter one with (σU, σV, σW) = (41.0, 27.0, 19.0) km s−1 . In Table 4 the mean U and W are roughly constant at all ages whereas V declines from ∼ -14 km s−1to -21 km s−1. We retrieve for U and V the Solar motion with respect to late-type stars, as determined by Mignard (2000), although we find a significant difference in W. We obtain a mean value of W$ =11.5 km s−1, whereas he finds values around 7
km s−1. We recall that our W velocities of the distant stars at the NGP rely mainly on radial velocities, which have an accuracy better than 1 km s−1, and thus are not affected by uncertainties on distances and proper motions.
Fig. 14. Age - velocity relations of distant clump giants, with the most
probable thick disk, Hercules stream and halo stars being excluded.
7. Summary
The data presented here are the result of several years of effort to obtain high resolution spectra for a large and complete sam-ple of clump giants. Besides our own observations, using the ELODIE spectrograph at OHP, we have also taken advantage of other available material like the Hipparcos and Tycho2 cata-logues, the [Fe/H] catalogue (Cayrel de Strobel et al. 2001) up-dated with a number of new references and the PARAM code to derive ages (da Silva et al. 2006). We have described how these data were combined to provide a catalogue of stellar parameters for 891 stars, mainly giants, giving atmospheric parameters with spectroscopic metallicities, absolute magnitudes and distances, galactic velocities (U, V, W), orbits, ages and population mem-bership probabilities.
Table 4. Age-velocity relation derived from 320 distant clump giants,
with the most probable thick disk, Hercules stream and halo stars being excluded. t (Gyr) U σU V σV W σW N 0.50 -11.3 22.3 -14.2 19.9 -14.2 16.4 10.3 1.50 -11.6 36.2 -13.9 19.9 -10.6 18.7 37.9 2.50 -9.6 40.4 -15.5 24.8 -10.6 21.7 44.7 3.50 -9.3 41.0 -16.7 27.0 -10.7 22.6 37.8 4.50 -9.2 41.9 -17.5 28.3 -11.1 23.5 31.9 5.50 -9.3 42.6 -17.9 28.8 -11.6 23.5 27.0 6.50 -9.8 43.4 -18.6 29.2 -12.2 23.2 28.8 7.50 -9.7 44.4 -19.5 29.3 -12.8 23.1 23.7 8.50 -9.2 45.3 -20.3 29.3 -13.1 23.2 17.1 9.50 -8.7 46.0 -21.0 29.2 -13.1 23.6 18.2
Our main motivation in conducting this project was to probe the Galactic disk using an unbiased and significant sample, with high quality data, in particular with spectroscopic metallici-ties and accurate distances and radial velocimetallici-ties. We have cho-sen to observe giants in the direction of the NGP in order to reach distances to the galactic plane up to 1 kpc, which are not covered by spectroscopic surveys usually limited to the closer Solar Neighbourhood. Clump giants are particularly well suited for this purpose. Compared to previous studies, our analysis presents several improvements, which are briefly outlined:
– for binning of the age axis, we have considered for each star
its entire age PDF, instead of averaging it, following da Silva et al. (2006)
– we have considered several kinematical populations likely to
be present in our sample: the thin disk, the thick disk, the Hercules stream and the halo
– in order to study the thin disk metallicity and age
distribu-tions, we have taken care to select stars with the highest prob-ability of belonging to this population
– in order to study the thin disk velocity distribution, we have
taken care to reject the most probable non thin disk stars Our results are summarized as follows :
– we do not find any young metal-poor stars nor old metal-rich
stars, contrary to common findings in dwarf samples
– the old thin disk and the thick disk overlap in the metallicity
range -0.70≤ [Fe/H] ≤ -0.30 and age range 8-10 Gyr
– among stars with accurate individual ages, we do not find
any young thick disk stars
– the metallicity distribution of our sample of thin disk clump
giants extends down to [Fe/H](-0.70, but the fraction of stars with [Fe/H]≤-0.50 is only 2.5%
– the metallicity distributions of giants and dwarfs differ
sig-nificantly on the metal-rich side: metal-rich giants are less frequent
– a vertical metallicity gradient is measured in the thin disk:
∂[Fe/H]/∂Z =−0.31 ± 0.03 dex kpc−1
– the AMR of the thin disk presents a low dispersion,
imply-ing a cosmic scatter lower than 0.12 dex, in agreement with previous findings by Rocha-Pinto et al. (2000) and Pont & Eyer (2004)
– 2 regimes are visible in the AMR of the thin disk : from 10
Gyr to 4 Gyr, the metallicity increases smoothly by 0.01 dex per Gyr, while for younger stars the rise of [Fe/H] is steeper
– in the thin disk, the V and W dispersions saturate at 29 and
24 km s−1respectively at∼ 4-5 Gyr, whereas U shows con-tinuous heating
– the Solar motion is found to be nearly constant in U and W
with respect to stars of all ages, while the amplitude of the asymmetric drift increases from 14 to 21 km s−1with respect to young and old stars respectively
Acknowledgements. We are grateful to L. Girardi for computing the ages for the
891 stars of this sample. This research has made use of the SIMBAD and VIZIER databases, operated at CDS, Strasbourg, France. It is based on data from the ESA
Hipparcos satellite (Hipparcos and Tycho2 catalogues).
References
Allen, C., & Santillan, A. 1993, RMxAA, 25, 39
Alonso, A., Arribas, S., & Mart´ınez-Roger, C. 2001, A&A, 376, 1039 Baranne, A., Queloz, D., Mayor, M. et al. 1996, A&AS, 119, 373 Barbier-Brossat, M. & Figon, P. 2000, A&A Sup., 142, 217
Bartaˇsi¯ut˙e, S., Aslan, Z., Boyle, R. P., Kharchenko, N. V., Ossipkov, L. P., & Sperauskas, J. 2003, Baltic Astron., 12, 539
Biazzo, K., Pasquini, L., Girardi, L., et al. 2007, A&A, 475, 981 Blackwell, D.E., & Lynas-Gray, A.E. 1998, A&AS, 129, 505 Bienaym´e O. 1999 A&A, 341, 86
Bienaym´e, O., Soubiran, C., Mishenina, T.V., Kovtyukh, V.V., & Siebert, A. 2005, A&A, 456, 1109 (Paper III)
Carraro, G., Ng, Y. K., & Portinari, L. 1998, MNRAS, 296, 1045 Cayrel de Strobel, G., Soubiran, C., & Ralite, N. 2001, A&A, 373, 159 Chen, L., Hou, J. L., & Wang, J. J. 2003, AJ, 125, 1397
da Silva L., Girardi L., Pasquini L. et al 2006, A&A, 458, 609 de Souza, R.E. & Teixeira, R. 2007, A&A, 471, 475 di Benedetto, G.P. 1998, A&A, 339, 858
Edvardsson, B., Andersen, J., Gustafsson, B., Lambert, D. L., Nissen, P. E., & Tomkin, J. 1993, A&A, 275, 101
ESA 1997, The Hipparcos and Tycho Catalogues, (Noordwijk) Series: ESA-SP 1200
Famaey, B., Jorissen, A., Luri, X. et al. 2005, A&A, 430, 165 Feltzing, S., Holmberg, J., & Hurley, J. R. 2001, A&A, 377, 911 Girardi L., Bressan A., Bertelli G., & Chiosi C. 2000, A&AS, 141, 371 Harmanec, P. 1998, A&A, 335, 173
Haywood, M. 2002, MNRAS, 337, 151 Haywood, M. 2006, MNRAS, 371, 1760
Høg, E., Fabricius, C., Makarov, V. V. et al. 2000, A&A, 363, 385 Johnson, D.R.H. & Soderblom, D.R. 1987, AJ, 93, 864 Jørgensen, B.R. & Lindegren, L. 2005, A&A, 436, 127 Koen, C. & Lombard, F. 2003, MNRAS, 343, 241
Katz, D., Soubiran, C., Cayrel, R. et al. 1998, A&A, 338, 151
Kovtyukh, V.V., Soubiran, C., Bienaym´e, O., Mishenina, T.V., & Belik, S. I. 2006, MNRAS, 371, 879
Marsakov, V.A. & Borkova, T.V. 2006, AstL, 32, 376 McWilliam, A. 1990, ApJS, 74, 1075
Mignard, F. 2000, A&A, 354, 522
Mishenina, T.V., Bienaym´e, O., Gorbaneva, T.I., Soubiran, C., Charbonnel, C., Korotin, S.A., & Kovtyukh, V.V. 2006, A&A, 456, 1109
Moultaka, J., Ilovaisky, S.A., Prugniel, P., & Soubiran, C. 2004, PASP, 116,693 Nordstr¨om B., Mayor, M., Andersen, J., et al. 2004, A&A, 418, 989
Pasquini, L., D¨ollinger, M.P., Weiss, A. et al. 2007, A&A 473, 979 Piatti, A., Claria, J. J., & Abadi, M. G. 1995, AJ, 110, 2813 Pont, F., & Eyer, L. 2004, MNRAS, 351, 487
Prugniel, P., & Soubiran, C. 2004, astro-ph/0409214 Prugniel, P., & Soubiran, C. 2001, A&A, 369, 1048 Ram´ırez I., & Mel´endez J. 2005, ApJ, 626, 446
Rocha-Pinto, H. J., Maciel, W. J., Scalo, J., & Flynn, C. 2000, A&A, 358, 850 Seabroke G.M., & Gilmore G. 2007, MNRAS, 380, 1348
Siebert, A., Bienaym´e, O., & Soubiran, C. 2003, A&A, 399, 531 (Paper II) Soubiran, C., Bienaym´e, O., & Siebert, A. 2003, A&A, 398, 141 (Paper I) Soubiran, C., Katz, D., & Cayrel, D. 1998, A&A, 133, 221
Vallenari, A., Pasetto, S., Bertelli, G., Chiosi, C., Spagna, A., & Lattanzi, M. 2006, A&A, 451, 125
![Fig. 1. Our local sample in the M v vs T eff , M v vs [Fe/H] and V vs U diagrams](https://thumb-eu.123doks.com/thumbv2/123doknet/14793943.602739/4.892.75.348.150.1140/fig-local-sample-m-vs-eff-fe-diagrams.webp)
![Figure 8 shows the distribution of the 523 target stars in the planes M v vs T eff , M v vs [Fe/H] and V vs U.](https://thumb-eu.123doks.com/thumbv2/123doknet/14793943.602739/6.892.83.360.476.761/figure-shows-distribution-target-stars-planes-eff-fe.webp)
![Fig. 8. The NGP sample in the M v vs T eff , M v vs [Fe/H] and V vs U diagrams.](https://thumb-eu.123doks.com/thumbv2/123doknet/14793943.602739/7.892.104.399.124.1186/fig-ngp-sample-m-vs-eff-fe-diagrams.webp)