HAL Id: hal-00304993
https://hal.archives-ouvertes.fr/hal-00304993
Submitted on 1 Jan 2004HAL is a multi-disciplinary open access archive for the deposit and dissemination of sci-entific research documents, whether they are pub-lished or not. The documents may come from teaching and research institutions in France or abroad, or from public or private research centers.
L’archive ouverte pluridisciplinaire HAL, est destinée au dépôt et à la diffusion de documents scientifiques de niveau recherche, publiés ou non, émanant des établissements d’enseignement et de recherche français ou étrangers, des laboratoires publics ou privés.
Research Note:Use of a distributed erosion model
(AGNPS) for planning small reservoirs in the Upper
Torysa basin
P. Miklanek, P. Pekarova, A. Konicek, J. Pekar
To cite this version:
P. Miklanek, P. Pekarova, A. Konicek, J. Pekar. Research Note:Use of a distributed erosion model (AGNPS) for planning small reservoirs in the Upper Torysa basin. Hydrology and Earth System Sciences Discussions, European Geosciences Union, 2004, 8 (6), pp.1186-1192. �hal-00304993�
Research Note:
Use of a distributed erosion model (AGNPS) for planning small
reservoirs in the Upper Torysa basin
Pavol Miklanek
1, Pavla Pekarova
1, Alojz Konicek
1and Jan Pekar
21Institute of Hydrology, Slovak Academy of Sciences, Racianska 75, 831 02 Bratislava 3, Slovak Republic
2Department of Applied Mathematics and Statistics, Faculty of Mathematics, Physics and Informatics, Comenius University Bratislava, Mlynská dolina, 842 48 Bratislava
E-mail for corresponding author: [email protected]
Abstract
This paper assesses the vulnerability to erosion of the soils in the upper Torysa catchment down to the planned drinking water reservoir at Tichy Potok (Slovakia). Experimental observations in the Torysa catchment, together with the outputs of the AGricultural Non-Point Source pollution model (AGNPS), have been used to select optimal sites for small sediment-trapping dams on the Torysa tributaries. The rainfall scenario for the upper Torysa was determined from records at the Plavec climate station from 19801998. In addition, an extreme rainfall event scenario was envisaged (100 mm rainfall in three hours); AGNPS model simulations suggest that such an event might produce as much as half or even the total amount of sediment generated by all the rainfalls over the whole period of simulation, 19801998.
Keywords: erosion, sediment transport, simulation, AGNPS model, Torysa basin
Introduction
Intensive agriculture may lead to extensive erosion associated with changes in river morphology, sedimentation of reservoirs and changes in soil properties. If the locations most prone to erosion can be identified in a particular basin, the most effective erosion control measures can be effected at limited cost; such locations are usually only a small part of the catchment. These erosion control measures are directed not only at protecting the soil as an irreplaceable natural resource but they also safeguard water, residential areas, communications and water structures.
Vegetation, depending on its kind and state, may mitigate the intensity and time course of erosion in a catchment by protecting the soil surface against the direct impact of rain drops, by enhancing the infiltration of rainwater into the soil and so decreasing direct runoff, and by improving the physical, chemical and biological soil properties. Measurements of diverse vegetation covers under natural conditions facilitate their listing, in order of anti-erosion efficiency: forest, grass, cereal crops and root crops.
Siltation of reservoirs by sediments is a natural consequence of erosion processes and has a negative impact on human economic activities. Therefore, from times immemorial, efforts have been made to protect soils from erosion and to eliminate or minimise its adverse effects. Hence, there are already known and verified measures and activities to achieve this result. However, notwithstanding the publication of the results of extensive experiments under natural conditions (Walling et al., 1989; Hlavcova et al., 1993; Kostka and Holko, 1997; Asselman, 1999; Lichner
et al., 1999; Stålnacke et al. 1999; Russell et al., 2000;
Fassnacht, 2000; Konicek, 2000; Baca, 2002; Dolezal et
al., 2003), the complexity of erosion processes may leave
questions unanswered unless actual experiments have been conducted in the river basin under consideration.
One measure, here proposed for the upper Torysa catchment, is construction of relatively low dams or even low steps located directly in the river bed as small sediment storage reservoirs. As each such small reservoir becomes
Use of a distributed erosion model (AGNPS) for planning small reservoirs in the Upper Torysa basin silted up, the slope of the river bed will be decreased as will
the transport of sediment because of the reduction in shear stress at the river bed. Additional retention storage can be created, either by raising the crest of the small reservoir dams or by construction of additional reservoir storage dams at suitable locations.
Thus, with minimal financial investment, it may be possible, gradually, to expand the system of erosion protective measures and to be aware of future, often unpredictable, changes in the erosion processes in the catchment; these, unlike other more stationary natural processes, develop irregularly. The catchment vegetation cover, afforestation, agriculture and other anthropogenic activities are variables, as is the regime of intensive rains and the uncertainty in climate change predictions.
The aim of the present study is:
1. to use the experimental observations in the Torysa catchment and the outputs of the AGNPS model to locate the best sites for small sediment trapping dams on the Torysa tributaries;
2. to simulate the peak runoff and possible sediment yield of scenario rainfall events and to calculate the possible longevity of the proposed constructions.
Description of the Torysa catchment
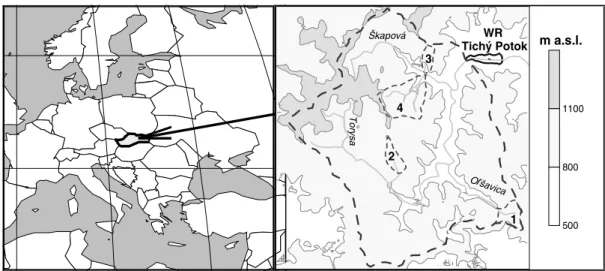
The River Torysa rises in the Levocske mountains at an altitude of 1140 m a.s.l. below the Skapova peak. Down to its cross-section after the planned backwater of the Tichy Potok dam (river km 113.0), the river is 18.3 km long, with a catchment area of 88.2 km2; the catchment slope parameter
is 0.23 and the altitude ranges from 600 to 1235 m a.s.l. with a mean of 910 m a.s.l. At the Slovak Hydro-meteorological Institute climatic station Plavec, 488 m a.s.l., to the north of the catchment (SHMI, 1963) over the period 19511980, the mean annual temperature was 6.6 oC and the mean annual rainfall 700 mm; for the Torysa catchment up to the point below Skapova (85.7 km2), the mean annual rainfall was 781 mm with evaporation 531 mm, runoff 250 mm, runoff coefficient 0.32, mean annual discharge 0.68 m3s1 and specific runoff 7.93 l s-1km2.
There have been plans to construct a reservoir as a source of water supply since 1954 but, in the last 30 years, the regions population in the municipalities of Torysky, Vysne Repase, Nizne Repase, Olsavica and Tichy Potok has dropped from 5000 to 1500 (Pekarova et al., 1998, 1999). Since 1977, the upper Torysa down to Tichy Potok has been included in the group of rivers used as sources for municipal water supply and from 1982, the waters of Torysa have already been abstracted for drinking purposes at Blazov, 200 m upstream of the planned Tichy Potok backwater). As for water quality, Torysa waters at Blazov are rated very highly (Halmova, 1996).
Forest stands comprise 50% of the catchment, mostly in the northern (lower) part of the catchment, while agriculture at higher elevations in the southerly parts of the upper Torysa and Olsavica amounts to 19%; the remaining 31% of the catchment is pasture and meadows (Fig. 2) (Pekarova et
al., 2000). Hence, the sediment yield experiment with the
AGNPS model was applied only to the arable areas at the highest elevations.
In 1966, four microcatchments with different land use (Fig. 1) were selected and monitored in the Torysa
Fig. 1. Scheme of the Torysa basin to the planned water reservoir Tichý Potok. Experimental microbasins: 1. Jedlinka arable, 2. Repiska
grass, 3. Chmelov forest, and 4. Dlhy Jarok forest.
Tor ysa Škapová O šavica 1 2 3 4 WR Tichý Potok 500 800 1100 m a.s.l.
catchment: 1: JEDLINKA (arable land), 2: REPISKA (permanent grass cover), 3: CHMELOV (coniferous forest), and, from 1997, 4: DLHY JAROK (coniferous forest). EVALUATION OF THE EROSION THREAT TO
CATCHMENTS BY THE AGNPS SIMULATION MODEL When studying high flows in small catchments, as well as protecting intensive agricultural catchments against erosion, the intensities of short flashy rainstorms must be measured. If automatic rainfall records are available, these may be determined as the tangent to the rainfall mass curve at any instant during the rainfall event.
Statistical processing of series of intensities of rainstorms of the same duration, relates rainfall intensity (i), its duration (t), and its periodicity (p), i = i( p, t ). Such relations for Slovakia were developed by Samaj and Valovic (1973).
In the erosion process, both in its crushing and in its
transporting phase, the dominant role is played by rains of high intensity, i.e. flashy rains and downpours of very short duration, usually affecting only small areas (Holy, 1994). Wischmeier and Smith (1965) state that the rainstorms which are most effective in causing erosion generally exceed 12.5 mm, with intensities of over 24 mm h1.
The rainfall scenario
The rainfall scenario for the upper Torysa was determined from rainfall recorded at the Plavec climate station over 19 years from 19801998.
The data were processed as follows:
1. from the records, simple rainfall events were selected with depths over 5 mm, May to October;
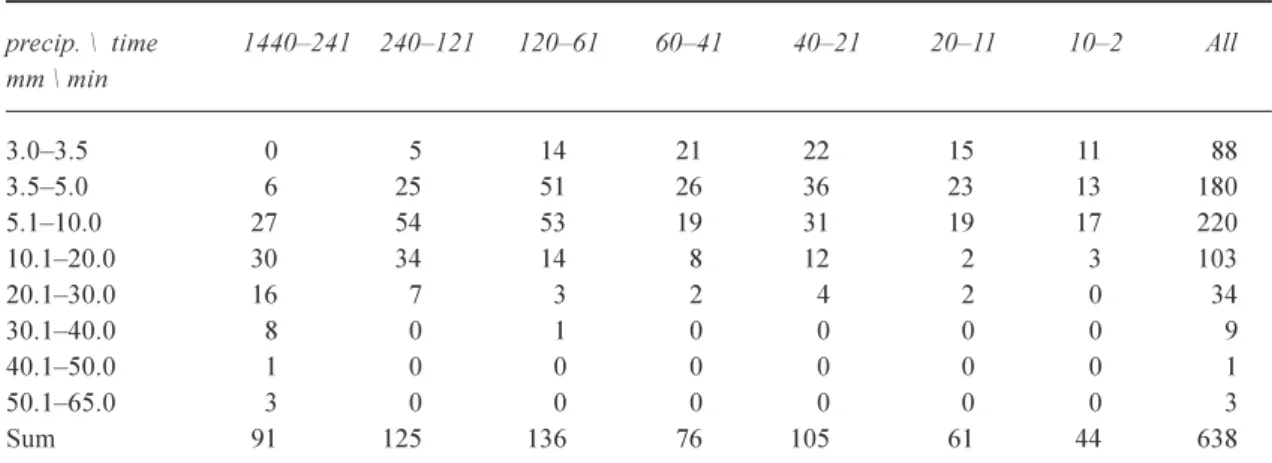
2. a rainstorm was considered uninterrupted, provided it stopped raining for no longer than 30 minutes; 3. rainfall events were sorted according to their duration; 4. for each group of a given duration, classes were created of the particular rainfall depths, and the event frequencies were determined for each of these classes. This approach was adopted because the AGNPS model, as input, uses rainfall depth and duration (hours) in each of its areal elements. Frequencies of classes of rainfall events are shown in Table 1. Altogether, from the 19 years of records, 638 rainfall events were selected and processed.
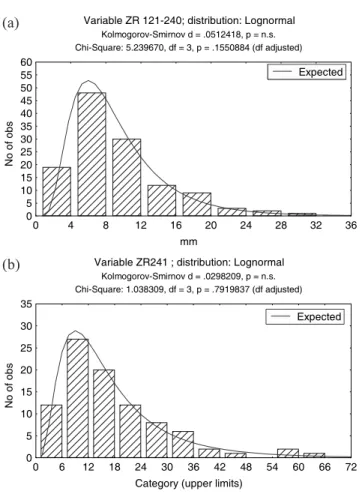
In addition to these rainfall events, an extreme scenario rainfall event was postulated, which has not been recorded during the 19-year history of observations at the Plavec station; this was 100 mm of rain falling within three hours. The return period of such a rainstorm is in excess of 5000 years, according to the theoretical lognormal distribution (Fig. 3a). The choice of such an extreme rainfall total and 1
2 3
Table 1. Frequencies of the rainfall runoff events in particular classes for the whole observation period 19801998,
in May to September, station Plavec
precip. \ time 1440241 240121 12061 6041 4021 2011 102 All mm \ min 3.03.5 0 5 14 21 22 15 11 88 3.55.0 6 25 51 26 36 23 13 180 5.110.0 27 54 53 19 31 19 17 220 10.120.0 30 34 14 8 12 2 3 103 20.130.0 16 7 3 2 4 2 0 34 30.140.0 8 0 1 0 0 0 0 9 40.150.0 1 0 0 0 0 0 0 1 50.165.0 3 0 0 0 0 0 0 3 Sum 91 125 136 76 105 61 44 638
Fig. 2. Land use in the upper Torysa basin. 1 Forest, 2 Grass,
Use of a distributed erosion model (AGNPS) for planning small reservoirs in the Upper Torysa basin
duration was based on the most catastrophic flash flood in the history of Slovakia, in the Mala Svinka basin (adjoining Torysa) on July 20, 1998. The rainfall depth was estimated at over 100 mm in one hour on the 50 km2 catchment of the upper Mala Svinka (Svoboda and Pekarova, 1998; Miklanek
et al, 2003). Forty-eight people died in the resulting
catastrophic flood and material damage was extensive. However, this was not the highest rainstrorm observed in Slovakia; in Salka, 232 mm rain was measured on July 12, 1957 in a storm lasting 65 minutes and 162.8 mm was gauged in Trnava on June 3, 1951 in two hours. Samaj et
al. (1985) estimated the 200-year maximum daily rainfall
at Brezovica above Torysa station as 99 mm.
EROSION SIMULATION FROM THE DESIGN RAINS BY AGNPS MODEL
The AGNPS 5.00 (Young et al., 1989, 1996) model is a runoff episode-oriented conceptual model with distributed parameters. It can be used to compare variants of agricultural
soil use in a catchment of concern as it analyses quantity and quality of runoff from catchments from a few hectares to, typically, 200 km2 in area. It was tested in Slovak conditions by Pekarova el al. (1999). The model outputs are: the runoff, sediment loads, pollution of runoff waters by N, P and COD (chemical oxygen demand).
The model operates on a uniform rectangular grid on the assumption of homogeneity of all model characteristics and parameters in each particular grid element (grid cell). All input data (except the characteristics of the flashy rainfall) are determined individually for each grid cell. These are identified by numbers, starting in the north-western corner of the catchment and proceeding by rows from west to east. For catchments larger than 800 hectares, the cell size recommended by the authors is 16 ha but, if good data are available, higher areal resolution can be achieved by reducing the cell size. The model comprises the hydrological rainfallrunoff sub-model, erosion-, sediment transport- and chemical substances transport sub-models.
In estimating an annual sediment yield, the erosion process for all the relevant rainfallrunoff events must be simulated and summed. In designing a reservoir storage for, say, 10 years protection against excessive sediment transport, such an annual sediment yield has to be multiplied by the length of the chosen period. The last task (not the least problematic) is then to find a suitable location for such storage with respect to the local topography.
RESULTS OF SIMULATIONSEDIMENTATION RESERVOIRS DESIGN
According to the data in Table 1, 34 combinations of sediment-producing rainfall events were simulated by the AGNPS model for the upstream catchment of the Torysa Olsavica confluence. Simulations used the average catchment conditions of vegetation cover and the average moisture conditions prior to each rainfall event.
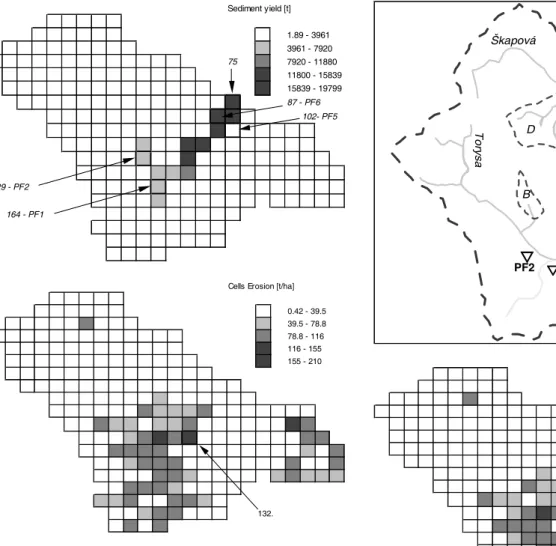
In addition, a hypothetical 100 mm extreme rainfall runoff event was simulated over the catchment. Graphical results of this extreme rainstorm are given in Fig. 4; Fig. 4a shows the sediment yield in cells and in Fig. 4b cells erosion is presented.
The simulation shows that the highest sediment production areas are concentrated in the upper parts of catchments of the rivers Torysa, Olsavica and the Rovinny Creek (left-hand tributary of Torysa in Nizne Repase), see Fig. 4b. These catchments are also characterised by the least percentage of forests; they are mostly used for agriculture so higher erosion is to be expected. The highest erosion value was 202 t ha1, simulated in grid cell No. 132, in the Torysa catchment, downstream of Nizne Repase. This result is due, primarily, Variable ZR 121-240; distribution: Lognormal
Kolmogorov-Smirnov d = .0512418, p = n.s. Chi-Square: 5.239670, df = 3, p = .1550884 (df adjusted) mm N o of obs 0 5 10 15 20 25 30 35 40 45 50 55 60 0 4 8 12 16 20 24 28 32 36 Expected
Variable ZR241 ; distribution: Lognormal Kolmogorov-Smirnov d = .0298209, p = n.s. Chi-Square: 1.038309, df = 3, p = .7919837 (df adjusted)
Category (upper limits)
N o of obs 0 5 10 15 20 25 30 35 0 6 12 18 24 30 36 42 48 54 60 66 72 Expected
Fig. 3. Comparison of the frequency of the precipitation totals to the
theoretical lognormal distribution. Kolmogorov-Smirnov (goodness-of-fit) and Chi-square tests. Plavec rainfall station, period 1980 1998, a) 24 hours rainfall duration, b) above 4 hours rainfall duration.
(a)
to the simultaneous combination of unfavourable soil and physiographic factors in the vicinity of this location, and to the sediments transported from upstream..
On the basis of the results of the simulations and also on detailed local observations and survey, six locations, PF1 PF6, were selected for construction of small earth-fill dams to trap and store sediment in the catchment. (Fig. 5). The area of the reservoir catchments, the dam height, retention capacity and area flooded are presented in Table 2.
The results of the model runs represent the scenario of sediment transport for all the profiles over the 19 years. The mean annual sediment yield was taken as 1/19 of the cumulative value. (Table 3).
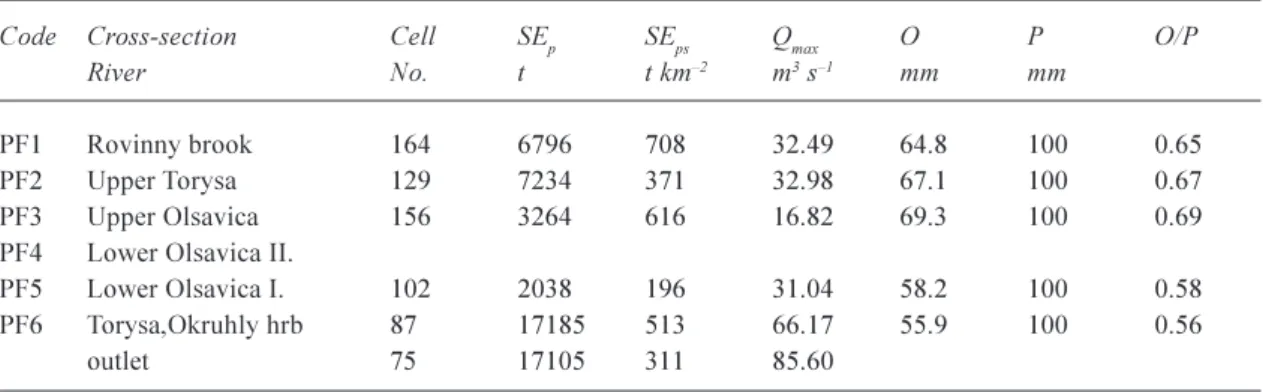
The simulation of the catastrophic rainfall event (100 mm in three hours) for all profiles is in Table 4. The highest erosion during the simulated event was 206 t ha1, in cell
Sediment yield [t] 1.89 - 3961 3961 - 7920 75 7920 - 11880 11800 - 15839 15839 - 19799 87 - PF6 102- PF5 129 - PF2 164 - PF1
Cells Erosion [t/ha] 0.42 - 39.5 39.5 - 78.8 78.8 - 116 116 - 155 155 - 210 132.
Fig. 4 (a). Model-simulated sediment yield, model output for extreme
100 mm rainfall depth. Note: AGNPS model was calibrated to Torysa and Olsavica confluence only. (b). Model-simulated cells erosion from the upper Torysa (55 km2) model cells, model output for
extreme 100 mm rainfall depth.
To ry sa Škapová O šavica PF1 PF2 PF3 PF4 VN Tichý Potok PF5 PF6 A B C D
Cells Erosion [t/ha] 0.42 - 39.5 39.5 - 78.8 78.8 - 116 116 - 155 155 - 210 132.
Fig. 5. Torysa catchment up to the planned Tichy Potok dam. PF1
through PF6 locations of the proposed sediment retention reservoirs.
No. 130. Comparison of Tables 3 and 4 shows that the sediment transport during one extreme rainfallrunoff event may exceed the 10-year cumulative transport for average rainfall and runoff events.
Conclusions
At the present state of knowledge of erosion processes and of the existing models for their determination, construction of small sediment retention reservoirs represents the most economic means of reducing the amount of sediment transported by the Torysa river from the higher parts of the catchments.
Use of a distributed erosion model (AGNPS) for planning small reservoirs in the Upper Torysa basin
Table 4. Sediment yield during extreme rainfall-runoff event (SEp) (P=100 mm, T=3 hrs), SEps - specific sediment
yield during extreme rainstorm, Qmax peak discharge, O and P runoff and rainfall depth, O/P runoff coefficient
Code Cross-section Cell SEp SEps Qmax O P O/P
River No. t t km2 m3s1 mm mm
PF1 Rovinny brook 164 6796 708 32.49 64.8 100 0.65
PF2 Upper Torysa 129 7234 371 32.98 67.1 100 0.67
PF3 Upper Olsavica 156 3264 616 16.82 69.3 100 0.69
PF4 Lower Olsavica II.
PF5 Lower Olsavica I. 102 2038 196 31.04 58.2 100 0.58
PF6 Torysa,Okruhly hrb 87 17185 513 66.17 55.9 100 0.56
outlet 75 17105 311 85.60
Table 3. Mean yearly sediment yield (Sp) and mean yearly specific sediment yield (Spr) in the selected cells
Code Cross-section Cell Area. Sp Spa Volume Working life
River No. km2 t t km2a1. m3×103 (years)
PF1 Rovinny brook 164 9.6 680 70.9 30 70
PF2 Upper Torysa 129 19.5 614 31.5 20 53
PF3 Upper Olsavica 156 5.3 205 38.7 20 165
PF4 Lower Olsavica II. 6.0 25
PF5 Lower Olsavica I. 102 10.4 136 13.1 45 530
PF6 Torysa,Okruhly hrb 87 33.5 787 23.5 35 70
outlet 75 55.0 737 13.4
Table 2. Parameters of small erosion reservoirs
Code Cross-section Area Height Flooded area Volume
River km2 M ha m3×103
PF1 Rovinny brook 9.6 3.0 1.5 30
PF2 Upper Torysa 19.5 3.5 1.8 20
PF3 Upper Olsavica 5.3 4.0 1.0 20
PF4 Lower Olsavica II. 6.0 4.0 1.5 25
PF5 Lower Olsavica I. 10.4 6.0 1.0 45
PF6 Torysa,Okruhly hrb 33.5 5.5 1.5 35
Initially, retention reservoirs PF1-6 are proposed on Torysa itself (upstream of Nizne Repase PF2), and on its two right-hand tributaries with the highest erosion (Rovinny Potok PF1, and Olsavica PF3). This recommendation is based on the total and specific sediment yield and transport in Table 3. The next reservoir to be constructed should be at the PF6 cross-section downstream of the Okruhly Hrb on the Torysa river. This reservoir should trap sediments from the sub-catchment downstream of PF1, 2 and 3 and the PF6 cross-section. Finally, a reservoir may have to be constructed at PF5 on the Olsavica river but only if sediment production
from the upper catchment part of this tributary has been underestimated.
The above conclusions are based upon simulations of sediment discharge by the AGNPS model and on the amount of its deposits. The model is an objective tool but the results depend also upon the reliability of the inputs from the Plavec climatological station some 20 kilometres from the study area, over the period 19801998. The reliability of these conclusions depends firstly, upon the representativeness of extrapolation of the rainfall data from the recorder site to the upper Torysa catchment and secondly, upon the
representativeness of the observation period chosen with respect to long-term intensive rainfall characteristics. The impact of a hypothetical occurrence of an extremely extreme rainfall has been documented by simulation of the total and specific sediment production following a single event of 100mm rain falling within three hours. Such a single event would produce as much as a half or even an amount equal to the total sediment produced by all the rain falling over the whole 19-year simulation period (Table 3 and Table 4). However, the consequences of even such an extreme event can be mitigated by construction of a series of sediment retention storages as proposed here. This solution would also be appropriate in the case of a change in the heavy rainfall areal distribution, e.g. for cases with high areal variability in the rainfall intensity over the catchment and, thus, also extremely high variability of the sediment production and transport in the river network over the site of concern.
Acknowledgement
The study was supported by Science and Technology Assistance Agency under the contract No. APVT-51-006502 as well as by project VEGA 2016.
References
Asselman, N.E.M., 1999. Suspended sediment dynamics in large basin: the River Rhine. Hydrol. Process., 13, 14371450. Baca, P., 2002. Temporal variability of suspended sediment
availability during rainfall-runoff events in a small agricultural basin. CD - ERB and NEFRIEND Proj.5. Interdisciplinary
Approaches in Small Catchment Hydrology: Monitoring and Research, Slovak NC IHP UNESCO / IH SAS, 711. Dolezal, F., Kulhavy, Z., Kvitek, T., Peterkova, J., Soukup, M.
and Tippl, M., 2003. Influence of drained lands on water quality and quality in foothill agricultural basins of Bohemia. In:
Monitoring and Modeling Catchment Water Quality and Quantity, Verhoest, Hudson, Hoeben, De Troch (Eds.).
UNESCO, Paris, Technical Documents in Hydrology no. 66, 2936.
Fassnacht, S.R., 2000. Flow modelling to estimate suspended sediment travel times for two Canadian Deltas. Hydrol. Earth
Syst. Sci., 4, 425438.
Halmova, D., 1996. Pollution trends in the central and upper parts
of the Torysa catchment (in Slovak). Proc. IV. Poster day, (Eds.
Hurtalova, Majercak), IH SAS, Bratislava. 2325.
Hlavcova, K. and Macura, V., 1993. Modelling of Overland Flow and Erosion Processes. Slovak J. Civil Eng., 1, 38.
Holy, M., 1994. Erosion and the environment (in Czech). CVUT, Praha, 383pp.
Konicek, A., 2000. Monthly regime of the insoluble matters content in rural basin runoff (in Slovak). Acta Hydrologica Slovaca, 1, 2332.
Kostka, Z. and Holko, L., 1997. Soil moisture and runoff generation in small mountain basin. Publication of SVH 2 (ISBN 80-967808-1-6), IH SAS and NC IHP Bratislava, 90pp. Lichner, L., Meszaros, I., Germann, P., Mdaghri Alaoui, A., Sir,
M. and Fasko, P., 1999. Impact of land-use change on nutrient fluxes in a structured clay-loam soil. IAHS Publication no. 257, 171177.
Miklanek, P., Halmova, D. and Pekarova, P., 2003. Extreme runoff simulation in Mala Svinka Basin. In: Monitoring and Modeling
Catchment Water Quality and Quantity, Verhoest, Hudson,
Hoeben, De Troch (Eds.). UNESCO, Paris, Technical Documents in Hydrology no. 66, 6168.
Pekarova, P., Konicek, A., Miklanek, P., Stancik, S. and Pekar, J., 1998. Non-point source water quantity and quality simulation at upper Torysa catchment. (Part I. AGNPS model and analysis of monitoring results from experimental catchments). In Slovak with English summary. J. Hydrol. Hydromech., 46, 373397. Pekarova, P., Konicek, A., Miklanek, P., Stancik, S. and Pekar, J.,
1999. Non-point source water quantity and quality simulation at upper Torysa catchment. (Part II. Analysis of AGNPS model results). In Slovak with English summary. J. Hydrol.
Hydromech., 47, 518.
Pekarova, P., Konicek, A. and Miklanek, P., 1999. Testing AGPNS model application in Slovak micro basins. Phys. Chem. Earth,
24, 303305.
Pekarova, P., Konicek, A. and Miklanek, P., 2000. Nutrient and sediment transport simulation in the upper Torysa catchment during the catastrophic flood of July 1997. In: Catchment
hydrological and biochemical processes in the changing environment, Elias, Littlewood (Eds.). UNESCO Technical
Documents in Hydrology No. 37, 181189.
Russell, M.A., Walling, D.E. and Hodgkinson, R.A., 2000. Suspended sediment sources in two small lowland agricultural catchments in the UK. J. Hydrol., 252, 124.
Samaj, J. and Valovic, S., 1973. Short rainfall intensities over the
territory of Slovakia (in Slovak). SHMU, Bratislava, No 5.
Samaj, F., Valovic, S. and Brazdil, R., 1985. Daily totals of
precipitation with extreme intensity in Czechoslovakia during the period 1901-1980. (In Slovak.) Collection of papers of the
SHMI 24, Bratislava, 9-112.
SHMI, 1963. Characteristic hydrological data of the rivers of
Slovakia (in Slovak). SHMU, Bratislava, 37pp.
Stålnacke, P., Tamminen, T., Vagstad, N., Wassmann, P., Loigu, E. and Jansons, V., 1999. Nutrient runoff and transfer from land and rivers to the Gulf of Riga. Hydrobiologia, 410, 103110 Svoboda, A. and Pekarova, P., 1998. Catastrophic flood of July
1998 in the Mala Svinka catchment - its simulation. J. Hydrol.
Hydromech., 46, 356372 (in Slovak with English summary).
Walling, D.E. and Moorhead, P.W., 1989. The particle size characteristics of fluvial suspended sediment: an overview.
Hydrobiologia, 176/177, 125149.
Wischmeier, W.H. and Smith, D.D., 1965. Predicting
Rainfall-Erosion Loss from Cropland East of the Rocky Mountains.
Agriculture Handbook 282, Washington, USA.
Young, R.A., Onstad, C.A. and Anderson, W.P., 1989. AGNPS: A Non-point Source Pollution Model for evaluating agricultural watersheds. J. Soil Water Conserv., 44, 168173.
Young, R.A., Onstad, Ch., A., Bosch, D. and Anderson, W.P., 1996.
Agricultural non-point source pollution model, Version 4.03. User´s guide. Minnesota, MPCA.