HAL Id: hal-00302566
https://hal.archives-ouvertes.fr/hal-00302566
Submitted on 5 Feb 2007HAL is a multi-disciplinary open access
archive for the deposit and dissemination of sci-entific research documents, whether they are pub-lished or not. The documents may come from teaching and research institutions in France or abroad, or from public or private research centers.
L’archive ouverte pluridisciplinaire HAL, est destinée au dépôt et à la diffusion de documents scientifiques de niveau recherche, publiés ou non, émanant des établissements d’enseignement et de recherche français ou étrangers, des laboratoires publics ou privés.
Simulation study of the aerosol information content in
OMI spectral reflectance measurements
B. Veihelmann, P. F. Levelt, P. Stammes, J. P. Veefkind
To cite this version:
B. Veihelmann, P. F. Levelt, P. Stammes, J. P. Veefkind. Simulation study of the aerosol information content in OMI spectral reflectance measurements. Atmospheric Chemistry and Physics Discussions, European Geosciences Union, 2007, 7 (1), pp.1785-1821. �hal-00302566�
ACPD
7, 1785–1821, 2007 Aerosol information in OMI spectral reflectance measurements B. Veihelmann et al. Title Page Abstract Introduction Conclusions References Tables Figures ◭ ◮ ◭ ◮ Back Close Full Screen / EscPrinter-friendly Version Interactive Discussion Atmos. Chem. Phys. Discuss., 7, 1785–1821, 2007
www.atmos-chem-phys-discuss.net/7/1785/2007/ © Author(s) 2007. This work is licensed
under a Creative Commons License.
Atmospheric Chemistry and Physics Discussions
Simulation study of the aerosol
information content in OMI spectral
reflectance measurements
B. Veihelmann, P. F. Levelt, P. Stammes, and J. P. Veefkind
Royal Netherlands Meteorological Institute (KNMI), P.O. Box 201, 3730 AE De Bilt, The Netherlands
Received: 20 November 2006 – Accepted: 1 February 2007 – Published: 5 February 2007 Correspondence to: B. Veihelmann ([email protected])
ACPD
7, 1785–1821, 2007 Aerosol information in OMI spectral reflectance measurements B. Veihelmann et al. Title Page Abstract Introduction Conclusions References Tables Figures ◭ ◮ ◭ ◮ Back Close Full Screen / EscPrinter-friendly Version Interactive Discussion
Abstract
The Ozone Monitoring Instrument (OMI) is designed and used primarily to retrieve trace gases like O3and NO2from the measured Earth reflectance spectrum in the UV-visible (270–500 nm). However, also aerosols are an important science target of OMI. Therefore, a Principal Component Analysis (PCA) is performed to quantify the infor-5
mation content of OMI reflectance measurements on aerosols. This analysis is applied to synthetic reflectance measurements for desert dust, biomass burning aerosols, and weakly absorbing anthropogenic aerosol with a variety of aerosol optical thicknesses, aerosol layer altitudes, refractive indices and size distributions. The range of aerosol parameters considered covers the natural variability of tropospheric aerosols. This the-10
oretical analysis is performed for a large number of scenarios with various geometries and surface albedo spectra for ocean, soil and vegetation. When the surface albedo spectrum is accurately known and clouds are absent, OMI reflectance measurements have 2 to 4 degrees of freedom that can be attributed to aerosol parameters. This in-formation content depends on the observation geometry, the surface albedo spectrum, 15
and on the aerosol parameters themselves. An additional wavelength band is evalu-ated, that comprises the O2-O2absorption band at a wavelength of 477 nm. It is found that this wavelength band adds significantly more information than any other individual band. The PCA is applied to assess the capability of the aerosol retrieval to discern various aerosol types as well as clouds.
20
1 Introduction
Several satellite instruments measuring backscattered solar radiation are currently used to monitor atmospheric aerosols. The characterization of aerosols using satel-lite observations is challenging since aerosols vary in many respects such as amount, composition, phase, size, particle shape and vertical distribution. In order to deter-25
mine as many relevant aerosol parameters as possible, radiometric and polarimetric 1786
ACPD
7, 1785–1821, 2007 Aerosol information in OMI spectral reflectance measurements B. Veihelmann et al. Title Page Abstract Introduction Conclusions References Tables Figures ◭ ◮ ◭ ◮ Back Close Full Screen / EscPrinter-friendly Version Interactive Discussion observations in a broad wavelength range with many viewing angles and a high spatial
and spectral resolution would be optimal (Chowdhary et al., 2001). However, such measurements are technically challenging. Until now only POLDER (POLarization and Directionality of the Earth’s Reflectances) uses polarization data for aerosol re-trieval (Deuz ´e et al., 2000, 2001). Most satellite instruments measuring aerosols with 5
global coverage are using radiometry only and provide only a subset of the required information (cf. Tanr ´e et al., 1997, for MODIS (Moderate Resolution Imaging Spec-troradiometer); Mishchenko et al., 1999, for AVHRR (Advanced Very High Resolution Radiometer); Diner et al., 1999, for MISR (Multiangle Imaging SpectroRadiometer)). In this case, a subset of aerosol parameters is retrieved (e.g. aerosol optical thickness 10
and single scattering albedo) and a-priori information is used for aerosol parameters, which cannot be retrieved from the measurement. Various studies have been made to quantify the information content of satellite measurements of the solar backscatter on aerosol. Tanr ´e et al. (1996) report that one to two parameters of the size distribution can be retrieved from observations with MODIS in the wavelength range from 470 nm 15
to 2130 nm. Hasekamp and Landgraf (2005) report that observations using GOME-II in the wavelength range from 300 nm to 800 nm contain 3.5 to 5 independent pieces of information when only intensity measurements are evaluated. In this study the infor-mation content of measurements of the Ozone Monitoring Instrument (OMI) on aerosol is investigated.
20
The OMI instrument is an imaging UV-VIS solar backscatter spectrometer (Levelt et al., 2006a). It is a Dutch-Finnish instrument onboard the NASA satellite EOS-Aura that has been launched in July 2004. The Aura platform moves on a sun synchronous polar orbit with an equator crossing-time at 13:38 local time (ascending node). With a novel detector concept using a 2-D CCD array Earth radiance spectra are measured 25
simultaneously on a 2600 km wide swath and global coverage is achieved on a daily basis. The (binned) nadir pixel size is about 13×24 km2. Due to this relatively small pixel size, more than 20% of the pixels have a cloud fraction of 0.05 or lower (Ker-ridge et al., 2001). This is an advantage with respect to other satellite spectrometers
ACPD
7, 1785–1821, 2007 Aerosol information in OMI spectral reflectance measurements B. Veihelmann et al. Title Page Abstract Introduction Conclusions References Tables Figures ◭ ◮ ◭ ◮ Back Close Full Screen / EscPrinter-friendly Version Interactive Discussion with a larger footprint such as the Global Ozone Monitoring Experiment-2
(GOME-2) or the SCanning Imaging Absorption spectroMeter for Atmospheric CHartographY (SCIAMACHY) especially when tropospheric constituents are measured. OMI mea-sures Earth radiance spectra in the wavelength range from 270 nm to 500 nm with a spectral resolution of 0.45 nm in the ultraviolet (UV-2 channel) and 0.63 nm in the vis-5
ible. Solar irradiance spectra are measured on a daily basis with the same detectors used for the radiance measurements. Atmospheric parameters are derived from the sun-normalized reflectance spectrum defined as
R(λ) = πE (λ)
cos(θs)F (λ), (1)
whereE (λ) and F (λ) are the Earth radiance and the solar irradiance spectrum
respec-10
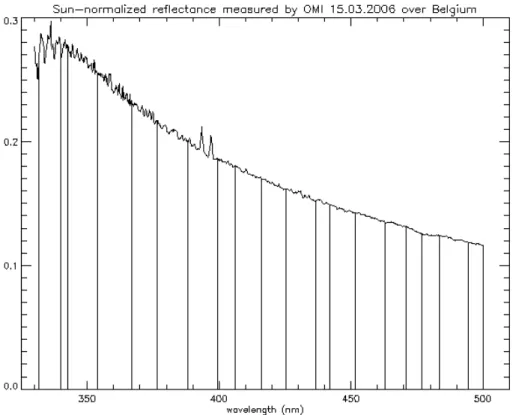
tively andθsis the solar zenith angle. An example for an OMI reflectance measurement is shown in Fig. 1. Evaluating the reflectance has the advantage that various instru-ment effects cancel out. The OMI instruinstru-ment is used to measure atmospheric O3, SO2, NO2, aerosols, clouds and several minor atmospheric trace gases.
Although the instrument concept is not optimized for monitoring aerosol, OMI re-15
flectance measurements are sensitive to various aerosol parameters (Torres et al., 2002a, b). UV absorbing aerosols, like desert dust and biomass burning aerosols can be detected using OMI reflectance measurements due to their spectral contrast to Rayleigh scattering (Torres et al., 1998). Mineral dust aerosol can be distinguished from other aerosol types due to the absorption of mineral particles in the UV. As com-20
pared to longer wavelengths, the Earth’s reflectance in the UV is less sensitive to the surface albedo. This is partly because of the rather low values of the surface albedo of both ocean and land in this wavelength range, and partly because the relative contribu-tion of the surface refleccontribu-tion to the signal at the top of the atmosphere is smaller than at longer wavelengths. Hence, the information of OMI reflectance measurements on 25
aerosols is particularly valuable for a global data set including ocean and land. Also, OMI can add complementary information in combined retrievals with other instruments such as MODIS that do not measure in the UV.
ACPD
7, 1785–1821, 2007 Aerosol information in OMI spectral reflectance measurements B. Veihelmann et al. Title Page Abstract Introduction Conclusions References Tables Figures ◭ ◮ ◭ ◮ Back Close Full Screen / EscPrinter-friendly Version Interactive Discussion Two algorithms are applied to retrieve aerosol parameters from OMI reflectance
mea-surements, referred to as the near-UV algorithm and the multi-wavelength algorithm, respectively. The near-UV algorithm uses measurements at 354 nm and 388 nm. It is based on the inversion procedure that has been used for aerosol retrievals from mea-surements of the Total Ozone Mapping Spectrometer (TOMS) (Torres et al., 1998, 5
2002a) using measurements at 340 and 380 nm. It has been shown that one or two aerosol parameters, namely the Aerosol Optical Thickness (AOT) and the Single-Scattering Albedo (SSA), can be retrieved independently using the near-UV algorithm. The multi-wavelength algorithm uses up to 20 wavelength bands between 331 nm and 500 nm specified in Table 1 (Torres, 2002b) (see also Fig. 1). Wavelengths longer than 10
500 nm are outside the spectral range of the OMI instrument. The sensitivity of the sig-nal at wavelengths shorter than 330 nm to troposheric aerosol is low due to absorption by ozone and due to Rayleigh scattering. Therefore, wavelengths shorter than 330 nm are not useful for the retrieval of tropospheric aerosol. The wavelength bands are about 1 nm wide and are chosen such that the reflectance spectrum within the bands is es-15
sentially free from molecular absorption and strong Raman features. The impact of scattering and absorption by aerosol on the measured reflectance in the chosen wave-length bands is spectrally smooth. Aerosol parameters are retrieved by fitting spectral reflectance measurements. Synthetic reflectance data are stored in a Look-Up Table (LUT) allowing efficient forward simulations for a broad range of aerosol models. 20
In this study we investigate the information content of OMI reflectance measure-ments in the wavelength bands used in the multi-wavelength aerosol algorithm. The number of Degrees of Freedom of the Signal (DFS) is quantified by applying a Prin-cipal Component Analysis (PCA, Sect. 2) to synthetic reflectance spectra for a large number of scenarios with various aerosol models, observation geometries and sur-25
face types. About 250 aerosol models for biomass burning, desert dust, and weakly absorbing aerosol are taken into account with a wide range of aerosol optical thick-nesses, layer altitudes, refractive indices and size distributions (Sect. 3). As compared to using real measurements, using synthetic data has the advantage that aerosol
ACPD
7, 1785–1821, 2007 Aerosol information in OMI spectral reflectance measurements B. Veihelmann et al. Title Page Abstract Introduction Conclusions References Tables Figures ◭ ◮ ◭ ◮ Back Close Full Screen / EscPrinter-friendly Version Interactive Discussion rameters can be controlled and that cloud effects can be controlled or excluded. The
results of the principal component analysis are immediately applicable to the multi-wavelength algorithm, since the PCA is applied to the synthetic reflectance data stored in the aforementioned LUT. The number of DFS obtained from the PCA is represen-tative for the number of aerosol parameters that can be retrieved independently from 5
OMI reflectance measurements provided that the surface albedo spectrum is accu-rately known and the presence of clouds can be completely excluded. In practice, the multi-wavelength algorithm relies on cloud data from an operational OMI product and on a-priori data for the surface albedo spectrum from climatologies. Such surface albedo climatologies have been generated based on TOMS data (Herman and Celar-10
ier,1997; Herman et al., 2001) GOME data (Koelemeijer et al., 2003) and MODIS data (Vermote and Vermeulen, 1999). A dedicated sensitivity study has been performed to assess the impact of errors in the surface albedo spectrum on the aerosol retrieval. Cloud models (ice clouds and water clouds) are included in the analysis.
An additional wavelength band is included in the analysis comprising the absorption 15
band of the O2-O2collision complex at 477 nm. This absorption band is used for the re-trieval of the cloud height from OMI reflectance measurements (Acarreta and de Haan, 2002; Acarreta et al., 2004). For a cloud-free atmosphere the depth of the O2-O2 ab-sorption band gives the effective scattering height of the atmosphere, which is different for an aerosol-loaded atmosphere than for an aerosol-free atmosphere. This sensitivity 20
is pronounced especially at low altitudes since the vertical distribution of O2-O2, being proportional to the square of the pressure, is strongly peaked over the ground. There-fore, it is expected that the multi-wavelength algorithm provides information about the altitude of aerosol layers with a sufficiently high AOT when the wavelength band at 477 nm is included.
25
In Sect. 4 the number of DFS of OMI reflectance measurements is discussed for sev-eral different surface albedo spectra and observation geometries. We quantify the im-portance of including the wavelength bands in the UV and estimate how much informa-tion is added when the wavelength band at 477 nm is included in the multi-wavelength
ACPD
7, 1785–1821, 2007 Aerosol information in OMI spectral reflectance measurements B. Veihelmann et al. Title Page Abstract Introduction Conclusions References Tables Figures ◭ ◮ ◭ ◮ Back Close Full Screen / EscPrinter-friendly Version Interactive Discussion algorithm. The weights associated with the principal components provide a graphical
view on the aerosol retrieval. This concept is used to investigate the cross correlations of the retrieved aerosol parameters such as AOT, SSA, aerosol layer altitude and par-ticle size. The multi-wavelength aerosol retrieval algorithm is assessed regarding its capability to distinguish various aerosol types and to discern high cirrus clouds and low 5
water clouds from aerosols.
2 Principal Component Analysis
The Principal Component Analysis (PCA) (cf. Jolliffe, 1986; Tanr ´e, 1996) is applied to determine the number of Degrees of Freedom of Signal (DFS) of OMI reflectance measurements. The DFS that are associated with aerosol parameters are quantified 10
by applying the PCA to synthetic reflectance data in the wavelength bands used in the multi-wavelength aerosol retrieval. These synthetic reflectance data are based on radiative transfer simulations for scenarios with variable aerosol parameters. The obtained number of DFS is interpreted as the number of aerosol parameters that can be extracted from real OMI reflectance measurements in cloud-free cases with a known 15
surface albedo spectrum.
The PCA works as follows: The set ofm reflectance measurements is stored in the
measurement matrix R with the elements Rl m where the column vectors are the m
reflectance vectors and the indexl indicates the wavelength band. The measurement
matrix R is standardized such that for each wavelength, the mean value of all mea-20
surements is zero and the standard deviation is unity. The covariance matrix A=RRT is diagonalized according to
A = VT D V (2)
such that the row vectors of the matrix V form an ortho-normal set ofK eigenvectors
and that the eigenvaluesγk on the diagonal of the matrix D are sorted in descending 25
ACPD
7, 1785–1821, 2007 Aerosol information in OMI spectral reflectance measurements B. Veihelmann et al. Title Page Abstract Introduction Conclusions References Tables Figures ◭ ◮ ◭ ◮ Back Close Full Screen / EscPrinter-friendly Version Interactive Discussion order. The eigenvectors are referred to as the Principal Components (PC) of the
mea-surement. Each reflectance measurement can be decomposed into a weighted sum of principal components viz.
Rl m= ˆRl m+ ε =
kmax
X
k
WmkVkl+ ε, (3)
where ˆRl mare the elements of the reconstructed measurement matrix with an error
5
ε. This can be written compactly in matrix notation as R=VT W withWmk being the
elements of the matrix W. The weightsWmkare determined by the linear transformation
W=V R which projects each measurement vector on each PC. In the following, the
indexm will be omitted for convenience when the weights are referred to. The matrix
V transforms the measurement matrix R into the space of weights with the principal
10
components as basis vectors.
The eigenvalue γk is the variance of the weights Wk of all m measurements for
a given order k. Due to the standardization the weights are scattered around zero.
Therefore the eigenvalueγk is a measure for the importance of the principal
compo-nent of the order k. The principal components are ordered in descending order of
15
importance.
Naturally, when a measurement is reconstructed using all K principal components
(kmax=K in Eq. 3), the error ε is zero. The sum in Eq. (3) can be truncated at kmax<K
without any loss of information as long as the errorε is smaller than the error due to
instrument noise. We define the error Ψm of the reconstructed reflectance
measure-20
ments viz. (see Tanr ´e et al., 1996)
Ψm= 1 (N − 1) N X l ˆRl m−Rl m Rl m !2 1/2 , (4)
whereN is the number of wavelengths. This reconstruction error is compared to an
equivalent error Ψnoise associated with instrument noise assuming a Signal to Noise 1792
ACPD
7, 1785–1821, 2007 Aerosol information in OMI spectral reflectance measurements B. Veihelmann et al. Title Page Abstract Introduction Conclusions References Tables Figures ◭ ◮ ◭ ◮ Back Close Full Screen / EscPrinter-friendly Version Interactive Discussion Ratio (SNR) of 1000. This is a typical value for OMI reflectance measurements in the
UV. The SNR of OMI reflectance measurements in the visible ranges between 1000 and 1500 (Levelt et al., 2006b). Principal components that are necessary to reconstruct a given measurement R up to an error Ψm<Ψnoise are considered significant. The number of DFS is identified with the number of significant PC.
5
Summing up, we note that the PCA provides an ordered series of principal com-ponents forming an ortho-normal set of basis-vectors that capture the variability of all measurements considered. The eigenvalue of the orderk is a measure for the
impor-tance of the PC of the same order for reconstructing the variability of all measurement vectors. The number of degrees of freedom of the signal is specific to individual re-10
flectance measurement and is derived from reconstructing individual reflectance mea-surements with errors below a given noise threshold. The PCA provides a transforma-tion of the observatransforma-tion space to a new coordinate system with the principal components as basis functions. The number of dimensions of this new parameter space is reduced to the number of DFS.
15
3 Synthetic reflectance data
A large number of synthetic reflectance spectra is used in the PCA. Radiative transfer simulations are based on a Look-Up Table (LUT) that includes simulations for a many different aerosol models for various aerosol types including biomass burning, desert dust, weakly absorbing and volcanic aerosols. The aerosol models cover a range 20
of microphysical parameters including the wavelength-dependent complex refractive index and the size distribution, as well as a range of atmospheric scenarios with varying AOT and aerosol layer altitudes. The size distribution and the refractive index of the aerosol models are listed in Table 2. Aerosol layer altitudes of 1, 3 and 5 km are considered for biomass burning and desert dust aerosol. A layer altitude of 1 km is 25
assumed for the models for weakly absorbing aerosols. The AOT varies between 0 and an upper limit that takes values of 2.5, 5 or 10 for weakly absorbing, biomass
ACPD
7, 1785–1821, 2007 Aerosol information in OMI spectral reflectance measurements B. Veihelmann et al. Title Page Abstract Introduction Conclusions References Tables Figures ◭ ◮ ◭ ◮ Back Close Full Screen / EscPrinter-friendly Version Interactive Discussion burning or desert dust aerosol respectively. AOT values are given in terms of the
AOT at the reference wavelength of 500 nm, throughout this article. The range of aerosol parameters is representative for the natural variability of aerosol and is chosen based on AERONET data (Holben et al., 1998). With the range of refractive indices considered, the SSA of the aerosol ranges between 0.8 and 1. The effective radius 5
reff of the bi-modal size distributions (for definition Hansen and Travis, 1974) varies between 0.1µm and 0.8 µm. Altogether, about 250 aerosol models are taken into
account. In the framework of the present study the LUT has been extended by the additional wavelength band at 477 nm and by cloud models for ice-clouds and water clouds (see Table 2). The first cloud model represents ice clouds consisting of imperfect 10
hexagonal prisms large compared to the wavelength (with linear dimensions larger than 25µm) (Hess et al., 1998; Knap et al., 1998). The ice cloud layer has an altitude of
10 km. The second cloud model (model C1; Deirmendjian, 1969) represents water clouds consisting of spherical particles at an altitude of about 2.5 km.
Single-scattering properties of all aerosols types have been simulated using Mie-15
theory assuming spherical particles (Van de Hulst, 1957). The non-sphericity of desert dust is not taken into account in this study. The phase function predicted by Mie the-ory overestimates the phase function of irregular dust particles at scattering angles close to the backward scattering direction and underestimates the phase function at sideward scattering angles (Volten et al., 2001). For single-viewing instruments such 20
as OMI, this can cause biases in the retrieved AOT (Mishchenko et al. 1995; Masuda et al., 2002; Veihelmann et al., 2004). When the variability of single-view reflectance spectra is analyzed using PCA, such scaling effects are of minor importance. In this context, the most important characteristic of desert dust in OMI reflectance spectra is the absorption in the ultraviolet, which is taken into account in the desert dust model. 25
Therefore, we assume that non-sphericity of desert dust particles has a minor impact on the information content of OMI reflectance measurements estimated in the present study.
Optical properties of an atmosphere containing aerosol are computed with the 1794
ACPD
7, 1785–1821, 2007 Aerosol information in OMI spectral reflectance measurements B. Veihelmann et al. Title Page Abstract Introduction Conclusions References Tables Figures ◭ ◮ ◭ ◮ Back Close Full Screen / EscPrinter-friendly Version Interactive Discussion DAK program (Doubling-Adding KNMI) (de Haan et al., 1987; Stammes et al., 1989;
Stammes, 2001). The results of the radiative transfer simulations are stored in the LUT for all wavelengthsλ used in the multi-wavelength algorithm in terms of the path
radi-ance Rp, the surface albedo spectruma, the spherical albedo of the atmospheric for
illumination from belowS, as well as the atmospheric transmission T . The reflectance
5
R at the top of the atmosphere can be evaluated very fast using (Chandrasekhar, 1960)
R(λ, µ, µ0, ∆φ, ps) = Rp(λ, µ, µ0, ∆φ, ps) +
a(λ) T (λ, µ, µ0, ps)
1 −a(λ)S(λ, ps) (5) for any given scenario with a geometry defined by the cosines of the solar zenith angle
µ0=cos(θs) and the viewing zenith angleµ=cos(θv) and the relative azimuth angle ∆φ,
the surface albedoa and the terrain height expressed in terms of the ground pressure
10
ps. The relative azimuth angle φ is defined such that the sun-glint is observed at
∆φ=0◦ for θs=θv. The synthetic reflectance data used in the PCA are calculated for
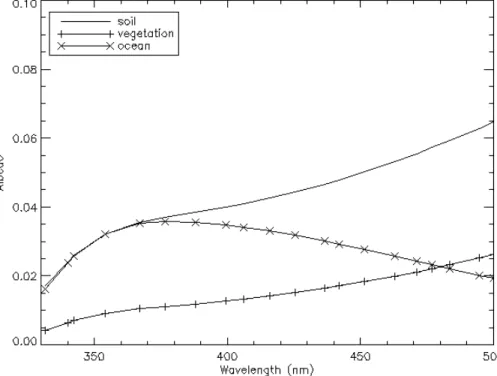
a given geometry using many different aerosol models and a constant surface albedo spectruma(λ) that is typical for ocean, vegetation or soil (see Fig. 2).
4 Results
15
In this section the results of the PCA are discussed for a large number of scenarios. The capabilities of the multi-wavelength algorithm are assessed using the number of DFS as well as the weights of the principal components. Special attention is paid to clouds and to errors in the surface albedo spectrum.
4.1 Principal components 20
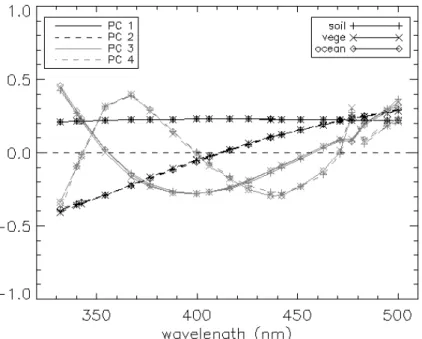
The set of principal components obtained from the PCA is largely independent from the surface albedo spectrum. Figure 3 shows the first four principal components for surface albedo spectra of ocean (+), soil (*), and vegetation (diamonds) for a typical
ACPD
7, 1785–1821, 2007 Aerosol information in OMI spectral reflectance measurements B. Veihelmann et al. Title Page Abstract Introduction Conclusions References Tables Figures ◭ ◮ ◭ ◮ Back Close Full Screen / EscPrinter-friendly Version Interactive Discussion observation geometry with a solar zenith angleθs=53
◦
, a viewing angleθv=26
◦
, and a relative azimuth ∆φ=30◦. The first PC is nearly constant for all wavelength bands and therefore controls the global level of the reflectance. The second component controls the slope of the reflectance as a function of the wavelength. Higher order components capture “slow” variations of the reflectance spectrum as well as the absorption feature 5
at 477 nm. When more than the first and the second PC are required for reconstructing a measurement, the 477 nm band becomes important. Although the principal com-ponents in general depend on the observation geometry, the amplitudes and overall shapes of the components of other geometries resemble the graphs shown in Fig. 3. 4.2 Number of degrees of freedom of signal
10
The eigenvalues (and hence also the weights associated with the principal compo-nents) drop fast with increasing order: for most geometries and surface types, more than 80% of the reflectance measurements can be reproduced within the measurement error when including 2 to 4 PC; Principal components of higher orders are not relevant for most models since their contribution to the reflectance is dominated by instrument 15
noise.
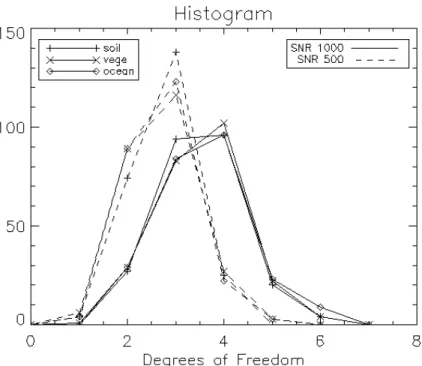
The number of DFS calculated as explained in the previous section depends on the observation geometry, the surface albedo and the choice of the noise threshold. In order to give an overview of the information content of OMI reflectance measurements we show histograms of the number of DFS of all aerosol models considered for various 20
scenarios. In Fig. 4 the histogram of the number of DFS is plotted for the observa-tion geometry withθs=53◦, θv=26◦, ∆φ=30◦ and surface albedo spectra for soil (+), vegetation (x) and ocean (diamonds). When a SNR of 1000 is assumed for the error threshold Ψnoise, we obtain 3 or 4 degrees of freedom for most of the aerosol models (solid lines). When this noise criterion is relaxed by assuming a lower SNR (with a 25
value of 500), 2 or 3 degrees of freedom are sufficient to reproduce most of the aerosol models (dashed lines). This may be a conservative estimate for the number of DFS taking into account possible error contributions that are not represented by the
ACPD
7, 1785–1821, 2007 Aerosol information in OMI spectral reflectance measurements B. Veihelmann et al. Title Page Abstract Introduction Conclusions References Tables Figures ◭ ◮ ◭ ◮ Back Close Full Screen / EscPrinter-friendly Version Interactive Discussion ment noise characterization but nevertheless introduce random-like structures in the
reflectance measurement.
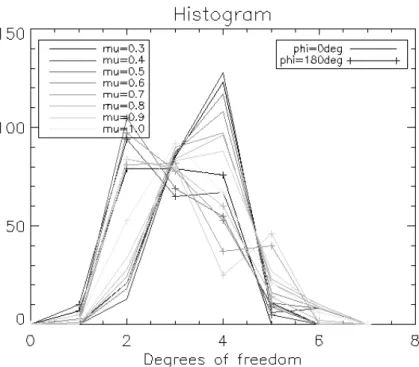
The geometry dependence of the number of DFS is depicted in Fig. 5. Histograms for the number of DFS of all aerosol models are shown for a series of geometries with viewing angles ranging fromθv=73
◦
(black) toθv=0
◦
(light grey), relative azimuth an-5
gles ∆φ=0◦(no symbols) and ∆φ=180◦(+) and a solar zenith angle of θs=53
◦
. A SNR of 1000 is used for the noise threshold. The information content of OMI reflectance measurements tends to be higher for geometries with ∆φ=0◦
than for geometries with ∆φ=180◦. This may be related to the fact that in the latter geometries, the signal is stronger influenced by Rayleigh scattering. In most cases the number of DFS varies 10
between 2 and 4.
The AOT varies between 0 and 5.0 in the dataset used for the PCA. Values of 2.5 and larger are observed in the lee of desert during dust outbreak events. Globally, however, the frequency of occurrence of such high AOT is low. Hence, the choice of the upper boundary of the AOT variation is arbitrary to a certain extent. An additional 15
PCA is performed on a reduced dataset based on aerosol models with a maximum AOT of 2.5. As compared to the nominal case, the average number of DFS becomes smaller by about 0.2 for all surface types considered. This decrease is small compared to the total number of DFS. Hence, we conclude that the choice of the upper boundary of the AOT variation is not critical for the results of the present study.
20
4.3 Wavelength bands
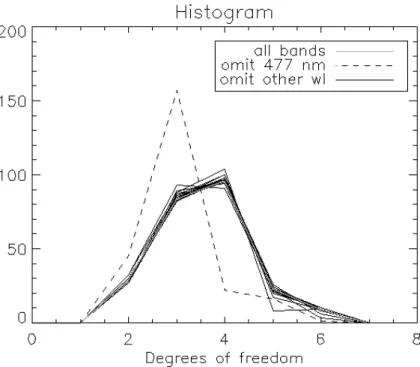
The relative importance of the individual wavelength bands is investigated by perform-ing PCA repeatedly on reduced reflectance data where one wavelength band is omit-ted. Figure 6 shows a comparison of the nominal case where all wavelength-bands are included (light grey) with one case where the 477 nm band is omitted (dashed) and 25
with other cases where other wavelength bands are omitted (black). The observation geometryθs=53◦, θv=26◦, ∆φ=30◦ and a typical surface albedo spectrum of soil is chosen. The noise threshold is based on a SNR of 1000. This comparison shows
ACPD
7, 1785–1821, 2007 Aerosol information in OMI spectral reflectance measurements B. Veihelmann et al. Title Page Abstract Introduction Conclusions References Tables Figures ◭ ◮ ◭ ◮ Back Close Full Screen / EscPrinter-friendly Version Interactive Discussion that the wavelength band at 477 nm adds more information than any other individual
wavelength band. Excluding any of the nominal wavelength bands has essentially no impact on the information content.
Furthermore, we find that the number of DFS remains nearly constant when up to 10 of the nominal wavelength bands are excluded such that the remaining bands are 5
evenly distributed over the total wavelength range (from 331 nm to 500 nm). Hence, the nominal wavelength bands contain redundant information. Nevertheless increasing the number of wavelength bands reduces errors due to noise. Note that this is not reflected by the number of DFS derived in this study as can be seen from the definition of the reconstruction error (see Eq. 4): this error as well as the threshold value applied is 10
independent from the number of wavelength bands when a large number of bands with the same SNR is considered. When all 8 wavelength bands below 400 nm are excluded, about one DFS is lost. This highlights the importance of the wavelength bands in the UV for the aerosol retrieval.
4.4 Separation of aerosol parameters 15
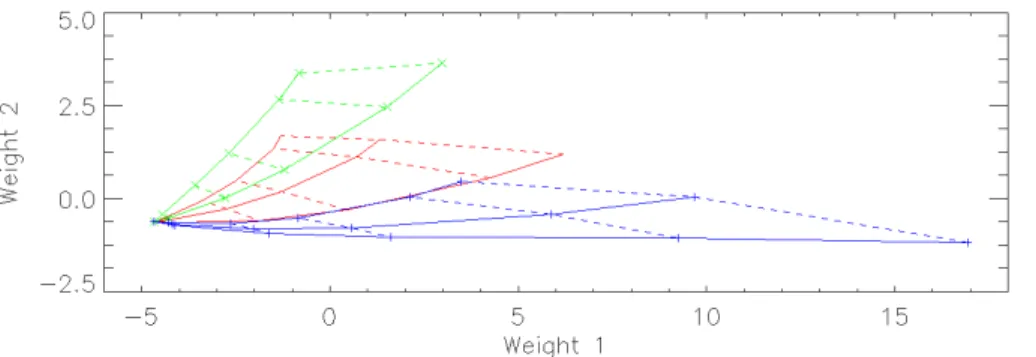
The distribution of aerosol models in the space of weights is employed in order to in-vestigate whether aerosol parameters can be separated in the aerosol retrieval using the multi-wavelength algorithm. Figure 7 shows the variation of the SSA and the AOT in the space of the first two weights for biomass burning (red, no markers), desert dust (green, x) and weakly absorbing aerosols (blue, +). Solid lines connect models with a 20
variable aerosol optical thickness ranging from 0 to 5, while all other parameters are constant. Dashed lines connect models with a variable single scattering albedo. The range of the SSA depends on the aerosol type (e.g. 0.82 to 0.94 for biomass burning aerosols, see Table 2). For clarity, only models with one constant layer altitude and one aerosol size are shown. The weights are plotted with the same scale. When the solid 25
and the dashed lines in this plot intersect at a right angle, the retrieved values of AOT and SSA for a given measurement are uncorrelated provided that at least two DFS can be associated with aerosol parameters. The correlation of the retrieved values of
ACPD
7, 1785–1821, 2007 Aerosol information in OMI spectral reflectance measurements B. Veihelmann et al. Title Page Abstract Introduction Conclusions References Tables Figures ◭ ◮ ◭ ◮ Back Close Full Screen / EscPrinter-friendly Version Interactive Discussion AOT and SSA becomes more pronounced when the inscribed angle decreases. AOT
and SSA can be separated in the retrieval when the mutual correlation is weak and the weights are sufficiently sensitivity to both parameters. It appears that the AOT and the SSA can be rather well separated in most cases. For aerosols with a low absorp-tion, the retrieved values of AOT and SSA are somewhat correlated. Nevertheless the 5
large separation of the models for weakly absorbing aerosols in the space of weights indicates a strong sensitivity of the reflectivity signal to both parameters.
The mutual correlations between other retrieved aerosol parameters have been in-vestigated using graphs (not shown) similar to the one shown in Fig. 7. It appears that both the layer altitude and the particle size are rather well separable from the AOT in 10
most cases. If only two DFS are available, retrieved values of the SSA are strongly correlated with retrieved values of both the layer altitude and the particle size. When three or more DFS are available, our results indicate pronounced correlations of the particle size with the SSA; at the same time the SSA and the layer height appear to be separable in many cases especially when desert dust is present.
15
4.5 Distinction of aerosol types
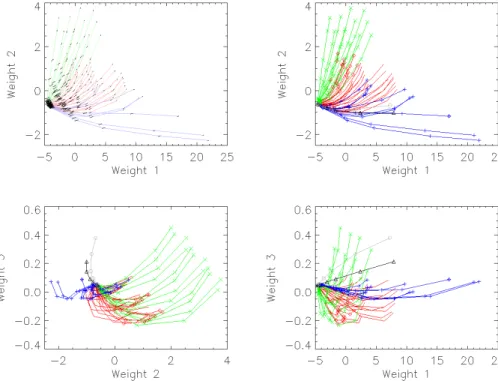
The capability of the multi-wavelength algorithm to discern aerosol types is investigated using the distribution of the models in the space of weights of the PC. Figures 8 and 9 show the weights of the first three componentsW1,W2andW3of all models for biomass burning (red, no markers), desert dust (green, x) and weakly absorbing aerosols (blue, 20
+). In Fig. 9 the weights are depicted in a 3-dimensional scatter-plot. The vertical bars in Fig. 9 are a guide for the eye and connect the symbols with the horizontal plane with the weight of the third PC of the case with AOT=0. Models with the same aerosol parameters but with a varying AOT are connected with solid lines. Figure 8 shows projections of the 3-dimensional scatter-plot along each one of the coordinate 25
axes, respectively. Such plots have been investigated for various typical observation geometries and various surface albedo spectra. In Figs. 8 and 9 we show results for cases with a geometry defined by θs=53◦, θv=26◦, ∆φ=30◦, and with an ocean
ACPD
7, 1785–1821, 2007 Aerosol information in OMI spectral reflectance measurements B. Veihelmann et al. Title Page Abstract Introduction Conclusions References Tables Figures ◭ ◮ ◭ ◮ Back Close Full Screen / EscPrinter-friendly Version Interactive Discussion surface, while the wavelength band at 477 nm is included.
The weightsW1 andW2(upper right panel of Fig. 8) indicate, whether aerosol mod-els can be discerned or not, for cases where only two DFS are available. Here, modmod-els for different aerosol types appear in rather well defined for AOT values of 0.5 and larger. The domain of biomass burning aerosols overlaps with both the domains of 5
desert dust and weakly absorbing aerosols. The overlap regime with the domain of desert dust models comprises predominantly models for strongly absorbing biomass burning aerosols. This overlap is less pronounced for scenes observed in the west-ern part of the swath. When desert dust is mistakenly classified as biomass burning aerosol the AOT is overestimated. The overlap regime of the domain of biomass burn-10
ing aerosols with the domain for weakly absorbing aerosol comprises models with very similar aerosol parameters. This includes models for biomass burning aerosols with the lowest absorption (m=1.5–0.01i) and weakly absorbing aerosols with the highest
absorption (m=1.4–0.012i) at a layer altitude of 1 km. Aerosol models of these types can be distinguished in the aerosol retrieval if their imaginary part of the refractive index 15
differs by about 0.1 or more or if the layer altitude differs by 1 km or more. Desert dust and weakly absorbing aerosols can be well distinguished except for very low values of the AOT.
If three DFS are available, the weightsW1,W2andW3have to be taken into account in order to decide, whether aerosol models can be discerned or not. Some of the 20
models that appear in an overlap regime in the upper right panel of Fig. 8 can be assigned to one aerosol type based on the third weight W3 (lower panels in Fig. 8). Models for biomass burning aerosol that fall in the domain of desert dust models in the 3-dimensional space of weights are marked with red diamonds. In the space of the weightsW2 and W3 (lower left panel), the overlap of the regimes appears more 25
pronounced when a scene is observed with a high viewing zenith angles (θv>30
◦ ) in the western part of the swath (toward the sun), whereas no overlap is found in various cases where a scene is observed with a high viewing zenith angles (θv>30◦
) in the eastern part of the swath (away from the sun). Figure 8 shows an intermediate case
ACPD
7, 1785–1821, 2007 Aerosol information in OMI spectral reflectance measurements B. Veihelmann et al. Title Page Abstract Introduction Conclusions References Tables Figures ◭ ◮ ◭ ◮ Back Close Full Screen / EscPrinter-friendly Version Interactive Discussion with a moderate overlap which is also typical for nadir observation geometries.
4.6 Surface albedo
The multi-wavelength aerosol retrieval requires a-priori information about the surface albedo spectrum since it is not possible to discern signatures due to the surface albedo spectrum from signatures due to aerosols in OMI reflectance measurements. A PCA 5
has been performed to extended sets of synthetic reflectance measurements where a variability of the surface albedo spectrum is included by means of an additional free parameter. In one case a variable wavelength-independent term is added to the surface albedo spectrum of an ocean surface. In another case the surface albedo spectra of soil and vegetation are mixed with a variable weight ranging from 0 (pure soil) to 1 10
(pure vegetation). We observe that the number of DFS does not increase as compared to cases where the surface albedo spectrum is fixed. This confirms that the surface albedo spectrum cannot be retrieved independently from aerosols parameters using OMI reflectance measurements.
The surface albedo data used in the aerosol retrieval is taken from a climatology 15
and may deviate from the true surface albedo spectrum of a given scenario. Typical values for this deviation are on the order of 0.01 in terms of absolute values, which corresponds to a relative error of up to several tens of percent of the surface albedo in the UV wavelength region. In order to estimate the impact of such errors on the aerosol retrieval the surface albedo is varied by ±0.01 (at all wavelengths simultaneously) for 20
an aerosol laden atmosphere over an ocean surface (Fig. 8 upper left panel). Black solid lines show the variation of the weights of each aerosol model due to this variation. The faintly coloured lines correspond to the coloured lines in the upper right panel and are included for clarity. When the AOT has a value of about 0.1 or lower, the variation of the weights due to the variation in the surface albedo has a similar magnitude as 25
the separation of the models in the space of weights. In this case, an error of 0.01 (absolute value) has a large impact on the all retrieved aerosol parameters. When the AOT is about 0.5 or larger, the impact of such an error in the surface albedo has a minor
ACPD
7, 1785–1821, 2007 Aerosol information in OMI spectral reflectance measurements B. Veihelmann et al. Title Page Abstract Introduction Conclusions References Tables Figures ◭ ◮ ◭ ◮ Back Close Full Screen / EscPrinter-friendly Version Interactive Discussion impact on the retrieved values of the AOT and the SSA. An error of 0.01 in the surface
albedo does not affect substantially the capability of the retrieval to distinguish aerosol types: For a given measurement, the choice of the optimal aerosol type will only be affected if the measurement lies in one of the overlap regions discussed in Sect. 4.5 or if the AOT is lower than 0.5.
5
4.7 Clouds
The models for both high ice clouds and low water clouds are well distinguishable from most aerosol models based on the weights W2 and W3 (lower left panel in Fig. 8) for an optical thickness of about 0.5 or larger. The model for weakly absorbing with the largest particle sizes and an AOT of 5.0, which comes close to the cloud models in this 10
projection (blue diamond in Fig. 8), can be distinguished well from the cloud models when the weightW1is taken into account. For the cloud models, the weight of the third component increases monotonically with increasing optical thickness. In contrast, most aerosol models exhibit a decrease for low values and an increase for high values of the AOT. The signature of clouds differs from aerosols due to the difference in particle 15
size and due to the absence of pronounced absorption features of water and ice in the wavelength region considered. In contrast to scattering by aerosols, scattering by cloud particles is essentially independent from the wavelength. Furthermore, the signature of high ice clouds differs from the signature of low aerosols since Rayleigh scattering above 10 km is nearly negligible and due to the altitude dependence of the 20
O2-O2 absorption feature at 477 nm. According to the weightsW1 andW2 (upper left panel), two DFS are not enough to discern clouds from biomass burning aerosols with a low imaginary part of the refractive index (∼0.01) and from weakly absorbing aerosols. The results discussed here concerning the capability of the multi-wavelength algorithm to discern clouds from aerosol are representative for a broad variety of cases 25
with different observation geometries and surface albedo spectra.
Cloudy scenes are flagged using the results of the OMI cloud product prior to the aerosol retrieval. Scenes with a very low cloud fraction or a very low cloud optical
ACPD
7, 1785–1821, 2007 Aerosol information in OMI spectral reflectance measurements B. Veihelmann et al. Title Page Abstract Introduction Conclusions References Tables Figures ◭ ◮ ◭ ◮ Back Close Full Screen / EscPrinter-friendly Version Interactive Discussion thickness can be erroneously classified as cloud-free. In this case the deviation of
the signal of the cloud model from the Rayleigh case may provide an estimate for the impact of the clouds on the signal in the presence of the aerosol. Whether the choice of the optimal aerosol model in the retrieval is influenced by an undetected cloud with an optical thickness of e.g. 0.1, depends strongly on the scenario. For desert dust 5
with an AOT of 1.0 and larger such an undetected cloud has most probably no impact. Note that at 500 nm a cloud optical thickness of 0.1 corresponds to a retrieved effective cloud fraction of about 0.02 from the OMI cloud product based on O2-O2 absorption (Acarreta, 2002). In other cases, when the aerosol models are very close in the space of weights, undetected clouds can cause errors in all retrieved aerosol parameters. We 10
note that if only the AOT is affected, the amplitude of the error is on the order of the cloud optical thickness.
4.8 Retrieval using weights
We have tested a retrieval scheme that is based on minimizing the residual of the weights of PC. The results of this retrieval scheme are equal to the results of the nom-15
inal retrieval scheme (minimizing the residual of the reflectance) since the linear trans-formation from the space of reflectance values into the space of weights does not add or remove information. Using a LUT of weights, rather than reflectances, can speed up the aerosol retrieval since the number of the dimensions (the number of wavelength bands) can be reduced to the number of DFS. The number of DFS of an individual OMI 20
reflectance measurement can be determined using the PC obtained from synthetic re-flectance data. Hereby, the measurement has to be standardized in the same way as the synthetic data. The number of DFS can be provided as diagnostic output for a given measurement.
ACPD
7, 1785–1821, 2007 Aerosol information in OMI spectral reflectance measurements B. Veihelmann et al. Title Page Abstract Introduction Conclusions References Tables Figures ◭ ◮ ◭ ◮ Back Close Full Screen / EscPrinter-friendly Version Interactive Discussion
5 Discussion and conclusions
The information content of OMI reflectance measurements has been investigated us-ing a principal component analysis. The results of this study are applicable to the multi-wavelength aerosol algorithm (Torres et al., 2002b). This analysis has been per-formed on a total of about 250 synthetic OMI reflectance measurements in 20 narrow 5
wavelength bands between 331 nm to 500 nm. The obtained number of Degrees of Freedom of Signal (DFS) of OMI reflectance measurements varies between 2 and 4 depending the solar zenith angle, the observation geometry, the instrument noise, the aerosol parameters, and also the surface albedo spectrum. The information content of OMI reflectance measurements tends to be higher for geometries with ∆φ=0◦
than for 10
geometries with ∆φ=180◦. This may be related to the fact that in the latter geometries, the signal is stronger influenced by Rayleigh scattering. The number of DFS does not depend critically on the surface albedo spectrum.
The number of DFS reported here are consistent with the results of a theoretical study on the information content of single-viewing satellite observations (Hasekamp 15
and Landgraf, 2005). In that study the DFS is derived from the averaging kernel ma-trix (Rodgers, 2000). Hasekamp and Landgraf (2005) report that observations using GOME-2 data in 15 wavelength bands between 300 nm and 800 nm with a SNR of 2000 contain 3.5 to 5 independent pieces of information when only intensity measure-ments are evaluated. The number of degrees of freedom found for OMI measuremeasure-ments 20
may be lower because of the narrower wavelength range and the lower SNR (1000 to 1500 in the UV-visible). Also, part of this difference may be due to the fact that different methods have been employed in order to derive the number of DFS. Tanr ´e et al. (1996) report that one to two parameters can be retrieved from observations with MODIS in the wavelength range from 470 nm to 2130 nm. The relatively large number of DFS 25
found for satellite observations of the solar backscatter in the UV VIS wavelength re-gion is due to the sensitivity of the reflectance to the aerosol layer height, as well as to the fact that the absorption of mineral dust aerosols is wavelength dependent. In this
ACPD
7, 1785–1821, 2007 Aerosol information in OMI spectral reflectance measurements B. Veihelmann et al. Title Page Abstract Introduction Conclusions References Tables Figures ◭ ◮ ◭ ◮ Back Close Full Screen / EscPrinter-friendly Version Interactive Discussion study we have shown that including wavelength bands in the UV at wavelengths below
400 nm adds about one degree of freedom.
It has been shown that the wavelength band at 477 nm, which comprises an ab-sorption feature of the O2-O2collision complex, adds more information than any other individual band. This band becomes important for the retrieval when the number of 5
DFS of OMI reflectance measurements is larger or equal to 3. The other wavelength bands contain redundant information: Up to 10 wavelength bands other than the band at 477 nm can be excluded without reducing the number of DFS significantly as long as the bands are evenly distributed over the total wavelength range. Hence, it is expected that including more wavelengths bands (additional to the 20 bands taken into account 10
in this study) within the OMI wavelength range can reduce the errors due to noise but will not increase the information content significantly.
The weights of the principal components of all aerosol models have been employed to investigate the capability of the multi-wavelength algorithm to distinguish different aerosol types as well as to distinguish clouds from aerosols. Desert dust aerosol can 15
be discerned from weakly absorbing aerosols when the AOT takes values of about 0.5 or higher. Some models for biomass burning with a high absorption cannot be distin-guished from desert dust. Some models for biomass burning with a low absorption cannot be distinguished from weakly absorbing aerosol. This ambiguity depends on the number of DFS and is less pronounced if three or more degrees of freedom of 20
the signal can be assigned to aerosol. High ice clouds and low water clouds can be distinguished from most aerosols types when 3 or more degrees of freedom of the sig-nal are available and when the optical thickness takes values of about 0.5 or higher. An efficient cloud screening algorithm is essential for the aerosol retrieval from OMI reflectance measurements especially in background conditions when the AOT takes 25
values of about 0.1 and lower.
The multi-wavelength algorithm relies on a-priori data for the surface albedo spec-trum taken from a surface albedo climatology. We have analyzed the impact of an error in the assumed surface albedo spectrum of 0.01 in terms of absolute value, which
ACPD
7, 1785–1821, 2007 Aerosol information in OMI spectral reflectance measurements B. Veihelmann et al. Title Page Abstract Introduction Conclusions References Tables Figures ◭ ◮ ◭ ◮ Back Close Full Screen / EscPrinter-friendly Version Interactive Discussion responds to a relative error of up to several tens of percent in the UV wavelength region.
We find that such an error in the surface albedo does not affect substantially the capa-bility of the retrieval to distinguish aerosol types: For a given reflectance measurement, the choice of the optimal aerosol type will only be affected if the measurement lies in one of the overlap regions discussed in Sect. 4.5 or if the AOT is lower than 0.5. When 5
the AOT has a value of about 0.1 or lower, an error of 0.01 (absolute value) in the sur-face albedo has a large impact on the all retrieved aerosol parameters. When the AOT is about 0.5 or larger, the impact of such an error in the surface albedo has a minor impact on the retrieved values of the AOT and the SSA. For an quantitative estimate of the impact on the retrieved SSA we refer to Torres et al. (2002b), who report that an 10
absolute error of 0.01 in the surface albedo can cause an error of 0.01 in the retrieved SSA when OMI reflectance measurements are evaluated using the multi-wavelength-algorithm. In 80% of all cases the error had no impact on the optimal aerosol model chosen by the retrieval (Torres et al., 2002b).
Results indicate that in the retrieval the AOT can be separated rather well from other 15
aerosol parameters such as SSA, layer altitude and particle size. The SSA can be retrieved nearly independently from the AOT if at least two DFS can be assigned to aerosol parameters and if all other aerosol parameters are known accurately. How-ever, when two DFS are available is not possible to separate SSA from aerosol layer height and particle size. When three or more DFS are available and desert dust aerosol 20
is present, information about the SSA appears to be difficult to separate from informa-tion about the particle size, whereas the height informainforma-tion may be separable. These results give an indication for which aerosol parameters to choose when only a subset of aerosol parameters is used as the free fit parameters in the aerosol retrieval and a-priori information is used for the remaining parameters.
25
The results of the PCA can be used in order to determine the number of DFS for a given reflectance measurement. This quantity can be provided as diagnostic output of the aerosol retrieval using the multi-wavelength algorithm.
ACPD
7, 1785–1821, 2007 Aerosol information in OMI spectral reflectance measurements B. Veihelmann et al. Title Page Abstract Introduction Conclusions References Tables Figures ◭ ◮ ◭ ◮ Back Close Full Screen / EscPrinter-friendly Version Interactive Discussion Acknowledgements. The authors thank J. de Haan (Royal Netherlands Meteorological Institute
(KNMI), The Netherlands) and O. Torres (NASA Goddard Space Flight Center/University of Maryland, USA) for fruitful discussions and valuable comments on an earlier version of the manuscript.
References
5
Acarreta, J. R. and de Haan, J. F.: Cloud pressure algorithm based on O2-O2 absorption, OMI Algorithm Theoretical Basis Document: Clouds, Aerosols, and Surface UV Irradiance, vol. 3, version 2, OMI-ATBD-03, edited by: Stammes, P., http://eospso.gsfc.nasa.gov/eos homepage/for scientists/atbd/docs/OMI/ATBD-OMI-03.pdf, 2002.
Acarreta, J. R., De Haan, J. F., and Stammes, P: Cloud pressure retrieval using the O2-O2
10
absorption band at 477 nm, J. Geophys. Res., 109, D05204, doi:10.1029/2003JD003915, 2004.
Bohren, C. F. and Huffman, D. R.: Absorption and scattering of light by small particles, John Wiley, New York, 1983.
Chandrasekhar, S.: Radiative Transfer, 393 pp., Dover, Mineola, N. Y., 1960.
15
Chowdhary, J., Cairns, B., Mishchenko, M., and Travis, L.: Retrieval of aerosol properties over the ocean using multispectral and multiangle photopolarimetric measurements from the research scanning polarimeter, Geophys. Res. Lett., 28(2), 243–246, 2001.
Deirmendjian, D.: Electromagnetic Scattering on Spherical Polydispersions, American Elsevier Publishing Company, Inc., New York, 1969.
20
Deuz ´e, J.-L., Goloub, P., Herman, M., Marchand, A., Perry, G., and Tanr ´e, D.: Estimate of the aerosols properties over the ocean with POLDER, J. Geophys. Res., 105, 15 329–15 346, 2000.
Deuz ´e, J.-L., Br ´eon, F.-M., Devaux, C., Goloub, P., Herman, M., Lafrance, B., Maignan, F., Marchand, A., Nadal, F., Perry, G., and Tanr ´e, D.: Remote sensing of aerosols over land
25
surfaces from POLDER-ADEOS 1 Polarized measurements, J. Geophys. Res., 106, 4913– 4926, 2001.
Diner, D. J., Abdou, W. A., Ackerman, T. P., Crean, K., Gordon, H. R., Kahn, R. A., Martonchik, J. V., McMuldroch, S., Paradise, S. R., Pinty, B., Verstraete, M. M., Wang, M., and West, R.
ACPD
7, 1785–1821, 2007 Aerosol information in OMI spectral reflectance measurements B. Veihelmann et al. Title Page Abstract Introduction Conclusions References Tables Figures ◭ ◮ ◭ ◮ Back Close Full Screen / EscPrinter-friendly Version Interactive Discussion
A.: MISR Level 2 Aerosol Retrieval Algorithm Theoretical Basis, available at: http://eospso. gsfc.nasa.gov/eos homepage/for scientists/atbd/docs/MISR/atbd-misr-09.pdf, 1999. Dubovik, O. and King, M. D.: A flexible inversion algorithm for retrieval of aerosol optical
prop-erties from sun and sky radiance measurements, J. Geophys. Res., 105, 20 673–20 696, 2000.
5
De Haan, J., Bosma, P., and Hovenier, J.: The adding method for multiple scattering computa-tions of polarized light, Astron. Astrophys., 183, 371–391, 1987.
Hansen, J. E. and Travis, L. D.: Light scattering in planetary atmospheres, Space Sci. Rev., 16 527–16 610, 1974.
Hasekamp, O. P. and Landgraf, J.: Retrieval of aerosol properties over the ocean from
10
multispectral single-viewing-angle measurements of intensity and polarization: Retrieval approach, information content, and sensitivity study, J. Geophys. Res., 101, D20207, doi:10.1029/2005JD006212, 2005.
Herman, J. R. and Celarier, E.: Earth surface reflectivity climatology at 340 and 380 nm from TOMS data, J. Geophys. Res., 102, 12 059–12 076, 1997.
15
Hess, M., Koepke, P., and Schult, I.: Optical Properties of Aerosols and Clouds: The Software Package OPAC, Bull. Am. Meteorol. Soc., 79, 5, 831–844, 1998.
Holben, B. N., Eck, T. F., Slutsker, I., Tanr ´e, D., Buis, J. P., Setzer, A., Vermote, E., Reagan, J. A., Kaufman, Y. J., Nakajima, T., Lavenu, F., Jankowiak, I., and Smirnov, A.: AERONET – A federated instrument network and data archive for aerosol characterization, Remote Sens.
20
Environ., 66, 1–16, 1998.
Jolliffe, I. T.: Principal Component Analysis, Springer, New York, 1986.
Kerridge, B. J., Reburn, W. J., Siddans, R., et al.: Definition of mission objectives and obser-vational requirements for an Atmospheric Chemistry Explorer mission, Final Report, ESA Contract 13048/98/NL/GD, ESTEC, Noordwijk, The Netherlands, 2001.
25
Knap, W. H., Labonnote, L. C., Brogniez, G., and Stammes, P.: Modeling total and polarized reflectances of ice clouds: evaluation by means of POLDER and ATSR-2 measurements, Appl. Opt., 44(19), 4060–4073, 2005.
Koelemeijer, R. B. A., de Haan, J. F., and Stammes, P.: A database of spectral surface reflec-tivity in the range 335–772 nm derived from 5.5 years of GOME observations, J. Geophys.
30
Res., 108(D2), 4070, doi:10.1029/2002JD002429, 2003.
Levelt, P. F., Hilsenrath, E., Leppelmeier, G. W., van den Oord, G. H. J., Bhartia, P. K., Tam-minen, J., de Haan, J. F., and Veefkind, J. P.: Science Objectives of the Ozone Monitoring
ACPD
7, 1785–1821, 2007 Aerosol information in OMI spectral reflectance measurements B. Veihelmann et al. Title Page Abstract Introduction Conclusions References Tables Figures ◭ ◮ ◭ ◮ Back Close Full Screen / EscPrinter-friendly Version Interactive Discussion
Instrument, IEEE Trans Geo. Rem. Sens., 44(5), 1199–1208, 2006a.
Levelt, P. F., van den Oord, G. H. J., Dobber, M. R., M ¨alkki, A., Visser, H., de Vries, J., Stammes, P., Lundell, J. O. V., and Saari, H.: The Ozone Monitoring Instrument, IEEE Trans Geo. Rem. Sens., 44(5), 1093–1101, 2006b.
Masuda, K., Mano, Y., Ishimoto, H., Tokuno, M., Yoshizaki, Y., and Okawara, N.: Assessment of
5
the nonsphericity of mineral dust from geostationary satellite measurements, Remote Sens. Environ., 82, 238–247, 2002.
Mishchenko, M. I., Geogdzhayev, I. V., Cairns, B., Rossow, W. B., and Lacis, A. A.: Aerosol retrievals over the ocean by use of channels 1 and 2 AVHRR data: sensitivity analysis and preliminary results, Appl. Opt., 38, 7325–7341, 1999.
10
Mishchenko, M. I., Lacis, A. A., Carlson, B. E., and Travis, L. D.: Nonsphericity of dust-like tro-pospheric aerosol: implications for aerosol remote sensing and climate modelling, Geophys. Res. Lett., 22, 1077–1080, 1995.
Rodgers, C.: Inverse Methods for Atmospheric Sounding: Theory and Practice, World Sci., River Edge, N. J., 2000.
15
Stammes, P., de Haan, J., and Hovenier, J.: The polarized internal radiation field of a planetary atmosphere, Astron. Astrophys., 225, 239–259, 1989.
Stammes, P.: Spectral radiance modelling in the UV-Visible range: IRS 2000: Current problems in Atmospheric Radiation, edited by: Smith, W. L. and Timofeyev, Y. M., A. Deepak Publ., Hampton (VA), 2001.
20
Tanr ´e, D., Herman, M., and Kaufman, Y. J.: Information on aerosol size distribution contained in solar reflected spectral radiances, J. Geophys. Res., 101(D14), 19 043–19 060, 1996. Tanr ´e, D., Kaufman, Y. J., Herman, M., and Matoo, S.: Remote sensing of aerosol
proper-ties over oceans using the MODIS/EOS spectral radiances, J. Geophys. Res., 102, 16 971– 16 988, doi:10.1029/96JD03437, 1997.
25
Torres, O., Bhartia, P. K., Herman, J. R., and Ahmad, Z.: Derivation of aerosol properties from satellite measurements of backscattered ultraviolet radiation. Theoretical Basis, J. Geophys. Res., 103, 17 099–17 110, 1998.
Torres, O., Bhartia, P. K., Herman, J. R., Sinyuk, A., and Holben, B.: A long term record of aerosol optical thickness from TOMS observations and comparison to AERONET
measure-30
ments, J. Atmos. Sci., 59, 398–413, 2002a.
Torres, O., Decae, R., Veefkind, J. P., and de Leeuw, G.: OMI Aerosol Retrieval Algorithm, OMI Algorithm Theoretical Basis Document: Clouds, Aerosols, and Surface UV Irradiance,
ACPD
7, 1785–1821, 2007 Aerosol information in OMI spectral reflectance measurements B. Veihelmann et al. Title Page Abstract Introduction Conclusions References Tables Figures ◭ ◮ ◭ ◮ Back Close Full Screen / EscPrinter-friendly Version Interactive Discussion
vol. 3, version 2, OMI-ATBD-03, edited by: Stammes, P., http://eospso.gsfc.nasa.gov/eos homepage/for scientists/atbd/docs/OMI/ATBD-OMI-03.pdf, 2002b.
Van de Hulst, H. V.: Light scattering by Small Particles, John Wiley, New York, 1957 (reprinted in 1981 by Dover, Mineola, New York).
Veihelmann, B., Volten, H., and van der Zande, W. J.: Light reflected by an
atmo-5
sphere containing irregular mineral dust aerosol, Geophys. Res. Lett., 31, L04113, doi:10.1029/2003GL018229, 2004.
Vermote, E. F. and Vermeulen, A.: Atmospheric correction algorithm: Special reflectances (MOD09), ATBD version 4.0, available at:http://modis-sr.ltdri.org/atbd mod08.pdf, 1999. Volten, H., Mu ˜noz, O., Rol, E., de Haan, J. F., Vassen, W., Hovenier, J. W., Muinonen, K.,
10
and Nousiainen, T.: Scattering matrices of mineral particles at 441.6 nm and 632.8 nm, J. Geophys. Res., 106(D15), 17 375–17 401, 2001.
ACPD
7, 1785–1821, 2007 Aerosol information in OMI spectral reflectance measurements B. Veihelmann et al. Title Page Abstract Introduction Conclusions References Tables Figures ◭ ◮ ◭ ◮ Back Close Full Screen / EscPrinter-friendly Version Interactive Discussion
Table 1. Central wavelengthsλ of the bands used in the multi-wavelength algorithm.
Band Nr. λ (nm) 1 331.7 2 340.0 3 342.5 4 354.0 5 367.0 6 376.5 7 388.0 8 399.5 9 406.0 10 416.0 11 425.5 12 436.5 13 442.0 14 451.5 15 463.0 16 471.0 17 477.0 18 483.5 19 494.5 20 500.0 1811
ACPD
7, 1785–1821, 2007 Aerosol information in OMI spectral reflectance measurements B. Veihelmann et al. Title Page Abstract Introduction Conclusions References Tables Figures ◭ ◮ ◭ ◮ Back Close Full Screen / EscPrinter-friendly Version Interactive Discussion
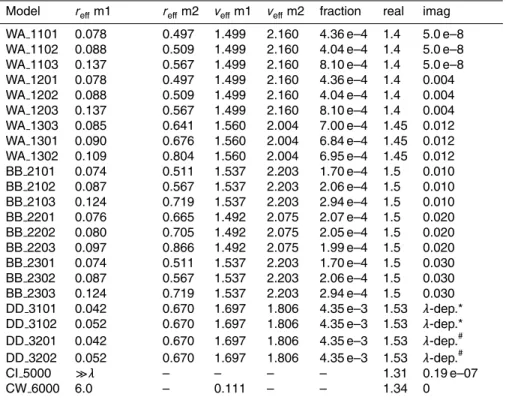
Table 2. Size distribution and refractive index of OMI aerosol models. The major aerosol
types, weakly absorbing aerosol (WA), biomass burning aerosol (BB) and desert dust (DD), are divided into sub-types according to size distribution, refractive index, and vertical distribution. Effective radii and effective variances of the log-normal modes m1 and m2 of the bimodal size distribution are listed together with the particle number fraction of the second mode. The imaginary part of the refractive index of desert dust is wavelength-dependent and takes values up to1.69 E–3 (*) or 0.013 (#) in the UV. Models for water clouds (CW) and for ice clouds (CI) are included. The shape of the ice crystals are modelled using imperfect hexagonal prisms large compared to the wavelength.
Model reffm1 reffm2 veffm1 veffm2 fraction real imag
WA 1101 0.078 0.497 1.499 2.160 4.36 e–4 1.4 5.0 e–8 WA 1102 0.088 0.509 1.499 2.160 4.04 e–4 1.4 5.0 e–8 WA 1103 0.137 0.567 1.499 2.160 8.10 e–4 1.4 5.0 e–8 WA 1201 0.078 0.497 1.499 2.160 4.36 e–4 1.4 0.004 WA 1202 0.088 0.509 1.499 2.160 4.04 e–4 1.4 0.004 WA 1203 0.137 0.567 1.499 2.160 8.10 e–4 1.4 0.004 WA 1303 0.085 0.641 1.560 2.004 7.00 e–4 1.45 0.012 WA 1301 0.090 0.676 1.560 2.004 6.84 e–4 1.45 0.012 WA 1302 0.109 0.804 1.560 2.004 6.95 e–4 1.45 0.012 BB 2101 0.074 0.511 1.537 2.203 1.70 e–4 1.5 0.010 BB 2102 0.087 0.567 1.537 2.203 2.06 e–4 1.5 0.010 BB 2103 0.124 0.719 1.537 2.203 2.94 e–4 1.5 0.010 BB 2201 0.076 0.665 1.492 2.075 2.07 e–4 1.5 0.020 BB 2202 0.080 0.705 1.492 2.075 2.05 e–4 1.5 0.020 BB 2203 0.097 0.866 1.492 2.075 1.99 e–4 1.5 0.020 BB 2301 0.074 0.511 1.537 2.203 1.70 e–4 1.5 0.030 BB 2302 0.087 0.567 1.537 2.203 2.06 e–4 1.5 0.030 BB 2303 0.124 0.719 1.537 2.203 2.94 e–4 1.5 0.030 DD 3101 0.042 0.670 1.697 1.806 4.35 e–3 1.53 λ-dep.* DD 3102 0.052 0.670 1.697 1.806 4.35 e–3 1.53 λ-dep.* DD 3201 0.042 0.670 1.697 1.806 4.35 e–3 1.53 λ-dep.# DD 3202 0.052 0.670 1.697 1.806 4.35 e–3 1.53 λ-dep.# CI 5000 ≫λ – – – – 1.31 0.19 e–07 CW 6000 6.0 – 0.111 – – 1.34 0 1812
ACPD
7, 1785–1821, 2007 Aerosol information in OMI spectral reflectance measurements B. Veihelmann et al. Title Page Abstract Introduction Conclusions References Tables Figures ◭ ◮ ◭ ◮ Back Close Full Screen / EscPrinter-friendly Version Interactive Discussion
Fig. 1. Example for an OMI reflectance measurement and wavelength bands used in the
multi-wavelength aerosol algorithm.
ACPD
7, 1785–1821, 2007 Aerosol information in OMI spectral reflectance measurements B. Veihelmann et al. Title Page Abstract Introduction Conclusions References Tables Figures ◭ ◮ ◭ ◮ Back Close Full Screen / EscPrinter-friendly Version Interactive Discussion
Fig. 2. Surface albedo spectra for soil, vegetation and ocean used in the PCA.
ACPD
7, 1785–1821, 2007 Aerosol information in OMI spectral reflectance measurements B. Veihelmann et al. Title Page Abstract Introduction Conclusions References Tables Figures ◭ ◮ ◭ ◮ Back Close Full Screen / EscPrinter-friendly Version Interactive Discussion
Fig. 3. Principal components for typical albedo spectra of soil (+), vegetation (x) and an ocean
surface (diamonds). The first (solid black), second (dashed black), third (solid grey) and fourth component (dashed grey) are depicted as a function of the wavelength.
ACPD
7, 1785–1821, 2007 Aerosol information in OMI spectral reflectance measurements B. Veihelmann et al. Title Page Abstract Introduction Conclusions References Tables Figures ◭ ◮ ◭ ◮ Back Close Full Screen / EscPrinter-friendly Version Interactive Discussion
Fig. 4. Histogram of the number of DFS of OMI reflectance measurements for 250 aerosol
models for soil (+), vegetation(x) and ocean surface (diamonds) using a noise threshold corre-sponding to a signal to noise ratio of 500 (dashed) and 1000 (solid).
ACPD
7, 1785–1821, 2007 Aerosol information in OMI spectral reflectance measurements B. Veihelmann et al. Title Page Abstract Introduction Conclusions References Tables Figures ◭ ◮ ◭ ◮ Back Close Full Screen / EscPrinter-friendly Version Interactive Discussion
Fig. 5. Histogram of the number of DFS of OMI reflectance measurements for 250 aerosol
models, various viewing zenith anglesθv referred to asµ=cos(θv) in the legend (grey scales), and relative azimuth angles of 0◦
(no marker) and 180◦
(+). The solar zenith angle is 53◦
.
ACPD
7, 1785–1821, 2007 Aerosol information in OMI spectral reflectance measurements B. Veihelmann et al. Title Page Abstract Introduction Conclusions References Tables Figures ◭ ◮ ◭ ◮ Back Close Full Screen / EscPrinter-friendly Version Interactive Discussion
Fig. 6. Histogram of the number of DFS of OMI reflectance measurements for 250 aerosol
models for a case where all wavelength bands are included (solid grey), a case where the 477 nm band is omitted (dashed black), and cases where other wavelength bands are omitted (solid black).
ACPD
7, 1785–1821, 2007 Aerosol information in OMI spectral reflectance measurements B. Veihelmann et al. Title Page Abstract Introduction Conclusions References Tables Figures ◭ ◮ ◭ ◮ Back Close Full Screen / EscPrinter-friendly Version Interactive Discussion
Fig. 7. Weights of the first and second component for models for biomass burning (red, no
markers), desert dust (green, x) and weakly absorbing (blue, +) aerosols. Solid lines connect models with a variable aerosol optical thickness ranging from 0 to 5, while all other parameters are constant. Dashed lines connect models with a variable single scattering albedo.
![[PDF] Démarrer et avancer avec la programmation en VBA Excel cours PDF - Cours Excel](data:image/gif;base64,R0lGODlhAQABAIAAAP///wAAACH5BAEAAAAALAAAAAABAAEAAAICRAEAOw==)