HAL Id: insu-01355127
https://hal-insu.archives-ouvertes.fr/insu-01355127
Submitted on 22 Aug 2016
HAL is a multi-disciplinary open access
archive for the deposit and dissemination of
sci-entific research documents, whether they are
pub-lished or not. The documents may come from
teaching and research institutions in France or
abroad, or from public or private research centers.
L’archive ouverte pluridisciplinaire HAL, est
destinée au dépôt et à la diffusion de documents
scientifiques de niveau recherche, publiés ou non,
émanant des établissements d’enseignement et de
recherche français ou étrangers, des laboratoires
publics ou privés.
Mapping probabilities of extreme continental water
storage changes from space gravimetry
Jürgen Kusche, Annette Eicker, Ehsan Forootan, Anne Springer, Laurent
Longuevergne
To cite this version:
Jürgen Kusche, Annette Eicker, Ehsan Forootan, Anne Springer, Laurent Longuevergne. Mapping
probabilities of extreme continental water storage changes from space gravimetry. Geophysical
Re-search Letters, American Geophysical Union, 2016, 43 (15), pp.8026-8034 �10.1002/2016GL069538�.
�insu-01355127�
Mapping probabilities of extreme continental water
storage changes from space gravimetry
J. Kusche1, A. Eicker1, E. Forootan1,2, A. Springer1, and L. Longuevergne3
1Institute of Geodesy and Geoinformation, University of Bonn, Bonn, Germany,2School of Earth and Ocean Sciences,
Cardiff University, Cardiff, UK,3CNRS, Geosciences Rennes, University or Rennes 1, Rennes, France
Abstract
Using data from the Gravity Recovery And Climate Experiment (GRACE) mission, we derive statistically robust “hot spot” regions of high probability of peak anomalous—i.e., with respect to the seasonal cycle—water storage (of up to 0.7 m one-in-five-year return level) and flux (up to 0.14 m/month). Analysis of, and comparison with, up to 32 years of ERA-Interim reanalysis fields reveals generally good agreement of these hot spot regions to GRACE results and that most exceptions are located in the tropics. However, a simulation experiment reveals that differences observed by GRACE are statistically significant, and further error analysis suggests that by around the year 2020, it will be possible to detect temporal changes in the frequency of extreme total fluxes (i.e., combined effects of mainly precipitation and floods) for at least 10–20% of the continental area, assuming that we have a continuation of GRACE by its follow-up GRACE Follow-On (GRACE-FO) mission.1. Introduction
Due to its memory effect, terrestrial water storage contains information pertaining to antecedent rainfall and runoff conditions that control the future occurrence and severity of drought and flood to a certain extent. However, at the time of writing, the NASA/Deutsches Zentrum für Luft- und Raumfahrt (DLR) Gravity Recovery And Climate Experiment (GRACE) twin-satellite mission is the only platform that observes terrestrial water storage with global coverage. GRACE has currently provided an unprecedented record of more than 14 years of monthly terrestrial water storage anomaly maps. Although the GRACE satellites show signs of aging, their successor GRACE Follow-On (GRACE-FO) mission is set for launch in 2017 [Flechtner et al., 2016], and it thus seems probable that we will soon have an almost uninterrupted observational record of terrestrial water storage over three decades. The primary observable of GRACE, time-variable changes in the Earth’s geopoten-tial measured via precise intersatellite ranging, has provided a new view of the ongoing mass redistribution patterns on the planet’s surface, particularly in relation to the terrestrial and oceanic hydrological cycle. Several researchers have quantified the variability of water storage in the form of groundwater, soil moisture, and surface water [Forootan et al., 2014], snowpack and ice [Velicogna et al., 2014], and mass-driven sea level [Rietbroek et al., 2016] on different timescales (from interannual to days). The observed variability in ground-water storage has been attributed to episodic events like droughts and floods, “natural” variability related to climate system modes [Phillips et al., 2012], and to anthropogenic effects such as depletion [Döll et al., 2014] and land use change.
Ogawa et al. [2011] have shown how GRACE data can be related to total terrestrial water flux, the sum of
precipitation, evapotranspiration, and runoff. In addition, Springer et al. [2014] suggested the use of GRACE data to validate the water cycle in atmospheric reanalyses. In these applications, numerical differentiation schemes have been applied to total water storage time series to derive flux. At longer time scales, anomalies of total flux with respect to a mean state can be linked to the sum of (i) modifications of land boundary conditions and resultant climate forcing, (ii) direct and indirect impact of anthropogenic activities, and (iii) the hydrolog-ical response of the system [Eicker et al., 2016]. At shorter time scales and at grid scale, GRACE data capture lateral water redistribution: water storage increase (flux has a positive sign) corresponds to precipitation and upstream river flow, while storage decrease (flux has a negative sign) corresponds to evapotranspiration and river discharge. However, inferring short-term lateral transports from GRACE is difficult since month-to-month variability in GRACE data is contaminated by stronger noise and limited in spatial resolution.
RESEARCH LETTER
10.1002/2016GL069538Key Points:
• From 12 years of GRACE data, we derive statistically robust “hot spot” regions of high probability of peak anomalous water storage and flux • Comparison to ERA-Interim
reanalysis reveals good agreement of these regions to GRACE, with most exceptions located in the tropics • Provided GRACE will be succeeded
in time by GRACE-FO, by around year 2020 we will be able to detect changes in the frequency of peak flux
Supporting Information: • Supporting Information S1 Correspondence to: J. Kusche, [email protected] Citation:
Kusche, J., A. Eicker, E. Forootan, A. Springer, and L. Longuevergne (2016), Mapping probabilities of extreme continental water storage changes from space gravimetry, Geophys. Res. Lett.,
43, doi:10.1002/2016GL069538.
Received 12 MAY 2016 Accepted 20 JUL 2016
Accepted article online 25 JUL 2016
©2016. American Geophysical Union. All Rights Reserved.
Geophysical Research Letters
10.1002/2016GL069538
Estimating the frequency or probability of future events based on time-limited records is an established concept in hydrology and hydrological engineering [e.g., Beard, 1962; Stedinger et al., 1992]. Drought and flood indicators can be expressed as percentiles with respect to their historical frequency of occurrence. For example, the U.S. Drought Monitor combines several short-term and long-term indices and indicators in this way for each location and time of year. As only a limited amount of information relating to deep soil moisture and groundwater enters common drought indices, GRACE data are being assimilated in the Catchment Land Surface Model, and assimilated fields are converted into soil moisture and groundwater percentiles [Houborg
et al., 2012].
However, only a few studies to date [e.g., Moore and Williams, 2014; Humphrey et al., 2016] have attempted to look directly at the statistical behavior of “anomalous” GRACE signals, i.e., beyond the dominating seasonal cycle and beyond episodic drought and flood events. In addition, the authors are not aware of any study that has quantified the occurrence frequency and expected return levels of such changes in a probabilistic sense. Of particular interest is whether the hypothesized intensification of the water cycle [Huntington, 2006; Durack
et al., 2012] can be observed with space gravimetry. To this end, we investigate whether, and after what
time, changes in the occurrence frequency of extremes in storage and flux, including floods and droughts, will become visible in GRACE and GRACE-FO data. Using a probabilistic viewpoint, changes in the mean and variance of the distribution underlying a climate variable affect the severity and occurrence frequency of extremes [Folland et al., 2001]. Return times of events of a given magnitude, or return levels for a given return time as considered here, are sensitive indicators to increases in magnitude in the tails of the underlying dis-tribution [Allen and Ingram, 2002]. For example, the CMIP5 analysis by Yoon et al. [2015] projects an increase in the sliding-window variance of California top-1 m soil moisture that equates to an increase in intense droughts and excessive floods by at least 50% toward the end of the 21st century. Validating such studies using GRACE/GRACE-FO would be of tremendous significance.
In this study, we analyze peak annual high and low levels of water storage and storage changes (total flux), observed by GRACE, for their recurrence frequencies and levels using a probabilistic framework. Recurrence frequency and return level are equivalent once the underlying distribution is known; therefore, we express all findings as return levels. In addition, hot spot regions where large anomalies are to be expected are outlined. We find that these differ, to some extent, from what is expected based on 32 years of European Center for Medium-Range Weather Forecast (ECMWF) reanalysis (ERA-Interim). Based on a realistic simulation, the probability of detecting temporal changes in the recurrence frequency of total water flux with the future combined GRACE/GRACE-FO data record is then discussed.
2. Data and Methods
Total water storage (TWS) represents aggregated variations in the terrestrial water content with respect to a long-term mean; thus reflecting the combined effect of changes in groundwater volume; soil moisture; root and canopy water content; and lake, river, and reservoir levels. In this study, GRACE data are used to derive TWS as follows. Monthly spherical harmonic coefficients (University of Texas, release 5) for the 2003–2015 timespan, augmented by geocenter, c20, and glacial isostatic adjustment corrections and decorrelated/
smoothed through the DDK3 filtering method as in Eicker et al. [2016], are mapped to 1∘ grids. Finally, with the aim of focusing on departures from large average seasonal water storage modes, a six-parameter model (mean, rate, annual, and semiannual waves) is first removed from the grids, followed by the monthly residual TWS climatology.
According to mass conservation, the instantaneous rate of change of TWS corresponds to the sum of precipitation, evapotranspiration, and runoff, and we call this quantity total water flux (TWF). From the GRACE coefficients, TWF grids are derived following methods outlined in Eicker et al. [2016]. Since TWF exhibits more noise due to temporal differentiation, we chose to apply slightly more aggressive spatial filtering (DDK2) as compared to TWS grids.
It is not clear whether any current hydrological or land surface model captures the full storage capacity of all soil and groundwater layers and whether it can be a reference for GRACE-derived extreme TWS and TWF under either stationarity or nonstationarity assumptions. In this work, both for comparison and multidecadal simulation purposes, TWF grids are derived directly from ERA-Interim reanalysis fields [Dee and 35, 2011] of precipitation, evapotranspiration, and runoff. We realize that limitations of the underlying land surface model
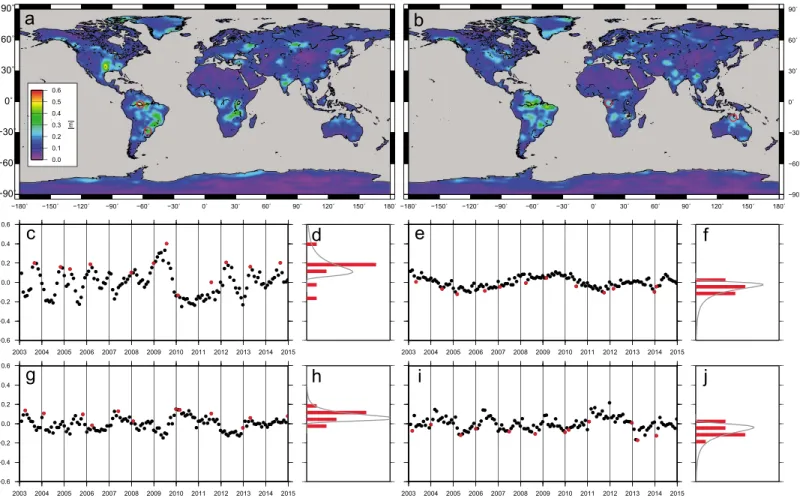
Figure 1. (a) One-in-five-year levels of anomalously high total water storage (TWS) with respect to climatology, as observed by the GRACE satellite mission (2003–2015); (b) one-in-five-year levels of anomalously low TWS from GRACE; (c, e, g and i) TWS time series for locations indicated by red circles; (d and h) corresponding empirical and fitted probability density functions for anomalously high TWS; and (f and j) corresponding empirical and fitted probability density functions for anomalously low TWS. (Figures 1c and 1d) Central Amazon, (Figures 1g and 1h) Parana, (Figures 1e and 1f ) Cuvelai-Etosha, and (Figures 1i and 1j) northern Australia.
(Hydrology-Tiled ECMWF Scheme for Surface Exchange over Land, H-TESSEL) exist, but results of Eicker et al. [2016] suggest that ERA-Interim and GRACE data fit well at shorter timescales. To enforce spectral consistency, these fields are first converted to spherical harmonic representation, filtered using the same procedures as with GRACE, and converted back to grids as in Eicker et al. [2016].
The method used in this paper proceeds as follows (see supporting information). First, all grid time series are decimated to annual maximum and minimum anomalous storage and flux, and the mean, standard deviations, and skewness (up to 2.6–2.9) are computed for these peak series. A generalized extreme value (GEV) distribution is then fitted using a moment method [Martins and Stedinger, 2000], and return levels (i.e., expected maximum or minimum after N years) are computed. This step has the advantage of repre-senting occurrence frequencies through a single, physically interpretable value (the N year return level in meters or m/month) per grid point. However, the GRACE record is rather short compared to precipitation and discharge or sea level data, which is common in GEV analysis; therefore, this study is restricted to using one-in-five-year return levels, and no attempt is made to extrapolate return level curves to more infrequent extremes.
3. Probability of Anomalously High or Low Water Storage
Following this approach, Figure 1 shows the return levels of annual (a) anomalously high and (b) low water storage from GRACE, with respect to the monthly TWS climatology. The expected one-in-five-year peak water levels reach up to 0.70 m, where the dominating regions are the Central Amazon and the Mississippi (related to catastrophic 2011 floods) basins. In addition, a range of regions can be identified at the 0.2–0.4 m level; such as
Geophysical Research Letters
10.1002/2016GL069538
the South America Parana basin, central Africa (including the Zambezi), India, northern Australia, Turkey, and northeast China (it is important to understand that expected N year levels can be larger than those actually observed within any N year period). Measured by the latitude-weighted RMS, land-averaged return levels amount to 0.14 m. As an additional point, it is observed that one-in-ten-year levels are generally found to be about 25% larger than one-in-five year levels.
It is important to understand that hydrometeorological extreme events are difficult to relate to common flood or rainfall peak levels or return intervals at GRACE temporal and spatial resolution. For example, the 2011 Mississippi 500 year flood inundated an area of several thousand km2under several meters of water, as a result
of rainfall rates of 50 cm per week concentrated within a few days. But GRACE results are difficult to scale to observable water levels (“equivalent water height”), because due to its measurement principle the mission observes water mass (or “equivalent volume”). As a result, GRACE-derived extreme events always refer to monthly large-scale averages and may therefore miss, or average out, “real” extreme events that are inherently focused in space and time.
In contrast to annual maxima, one-in-five-year levels of exceptionally low (i.e., below climatology) water storage are found reaching 0.55 m in the Amazon and less than 0.14 m on average over land masses. It is inter-esting to note that extreme levels in TWS are not symmetric; some regions affected by flooding (such as the Mississippi basin and Lake Victoria) feature prominently in Figure 1a while others such as the Amazonas river mouth show up only in Figure 1b, but overall, the maps are quite similar. The 14 year minimum TWS events have been analyzed in Humphrey et al. [2016], and Figure 14 of their study, which shows maximum average storage deficits and years of maximum, resembles our Figure 1b. This confirms that levels of high probability of low water storage shown in our Figure 1b are typically related to the occurrence of two or three strong droughts (some of which may not have been described in literature [Humphrey et al., 2016]).
As expected, these hot spot regions of extreme annual anomalous storage broadly correspond to regions where seasonal water storage amplitudes are large (see Figure S1 in the supporting information), but they also reflect that GRACE picks up anomalous floods and droughts for southern Australia, the Parana basin (where the large groundwater response to climate variability was shown in Chen et al. [2010]) or regions of northeast China where the annual signal is less prominent. In contrast, Figure 1 does not prominently feature part of the Amazon, Alaska coastal glaciers, and the Ganges-Brahmaputra delta, where although surface or snow-equivalent water loads are huge, they mostly follow a seasonal cycle (Figure S1).
Figures 1c, 1d, 1g, and 1h show time series (black dots), annual maximum TWS levels (red dots), observed frequency of maximum TWS (red bars), and the fitted GEV distribution (grey) for the two locations, Central Amazon (c, d) and Parana (g, h), indicated in Figure 1a, while the figures on the right-hand side show the same for minimum TWS levels (Cuvelai-Etosha, e and f, and Northern Australia, i, j). Locations showing different behavior have been selected: the Central Amazon where annual signals are among the largest on Earth, with a wide spread of both annual maxima and minima of anomalous TWS, and the Cuvelai-Etosha basin [Eicker
et al., 2016] where a multiannual oscillation appears to be present. For the Parana basin, again, the seasonal
signal is weak but the extreme levels peak that every 2–3 years are likely to be related to El Niño-Southern Oscillation (ENSO) [Chen et al., 2010; Phillips et al., 2012; Eicker et al., 2016]. It is of note that, with the exception of the Central Amazon location, the GEV distribution appears quite suitable for fitting to observed extreme levels of storage. As will be shown later, the GEV fits in this study are less sensitive with respect to record length compared to, e.g., Gaussian fits.
4. Probabilities of Anomalous Increase or Decrease of Water Storage
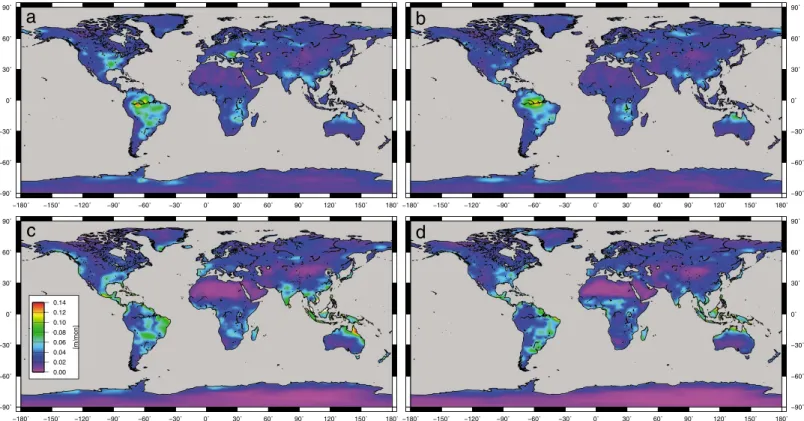
Analysis of the time-differentiated GRACE record reveals a number of regions that have an increased proba-bility of maximum (Figure 2a) and minimum (Figure 2b) water fluxes. Although these broadly correspond to those of anomalous TWS, they generally follow rainfall patterns such as the monsoon. One-in-five-year levels of annual peak flux (Figure 2a) amount up to 0.14 m/month for the Central Amazon region, with an overall land average weighted RMS of 0.033 m/month. We note that annual extremes in TWF relate to the fastest increase (linked to extreme precipitation) or decrease in total water storage per given year and that peak maxima in the figures need to be interpreted as levels of storage increase or decrease that statistically occur once every 5 years. Peak one-in-five year decreases (Figure 2b) reach up to 0.14 m/month, with a land average RMS of 0.031 m/month.
Figure 2. (a) One-in-five-year levels of anomalously high total water flux (TWF) as observed by the GRACE satellite mission (2003–2015), (b) one-in-five-year levels of anomalously low TWF from GRACE, (c) one-in-five-year levels of anomalously high TWF from ERA-Interim reanalysis, and (d) one-in-five-year levels of anomalously low TWF from ERA-Interim reanalysis.
In ERA-Interim (Figure 2c), tropical precipitation extremes dominate total flux and contribute to one-in-five-year maximum levels of up to 0.31 m/month over tropical northern Australia and Southeast Asia, with RMS close to 0.040 m/month. Minimum levels (Figure 2d) are up to 0.27 m/month and land averaged to RMS 0.036 m/month. In fact, ERA-Interim identifies many regions outside the tropics that closely correspond to GRACE-derived extreme levels, with some exceptions (southern Europe, U.S./Canada West Coast, east Europe/Russia). Overall, the average difference between GRACE-derived TWF and ERA-Interim reanalysis fields is found to be only RMS 0.023 m/month (max) and 0.021 m/month (min).
Humphrey et al. [2016] found a significant positive correlation between GRACE high-frequency anomalies and
ERA-Interim precipitation over many regions identified here as having a high probability of maximum water flux: the Amazon and Parana basins, northern Australia, south/central Africa, northern India, southeast Europe, and parts of the U.S. This therefore supports the hypothesis in this study that extreme levels of TWS increase (positive TWF) are likely driven by precipitation.
5. Stationarity With Respect to Climate Modes: ENSO
It is considered possible that the results of this study are influenced by the occurrence of climate modes within the analysis time frame. In fact, Phillips et al. [2012] and Eicker et al. [2016] showed that GRACE-derived water storage is correlated with ENSO, and other authors have identified correlations, e.g., with the Pacific Decadal Oscillation (PDO) [e.g., Seoane et al., 2013]. However, while these studies have generally focused on identifying modes and problems in the estimation of trend and accelerations, this study focuses on the imprint of ENSO in relation to the occurrence probability of extreme storage and flux.
In what follows, we repeat our previous experiments, but we exclude either (1) years 2003, 2009, and 2010 or (2) 2007, 2008, 2010, and 2011 from our analysis. These years were, according to the Ocean Niño Index (ONI, a three-month running mean of sea surface temperature anomalies in the Niño 3.4 region) categorized as (1) moderate or stronger El Niño years (ONI>1) or (2) moderate or stronger La Niña years (ONI<−1).
Geophysical Research Letters
10.1002/2016GL069538
The results shown in Figure S2 can then be compared to those in Figure 1 which shows return levels derived from the full time series including ENSO years. We find that, overall, our results are surprisingly robust. Largest differences can be observed for South America. In the case of (1), excluding El Niño years, the maximum one-in-five-year water levels are reduced from 0.70 m (full 12 year period) to 0.50 m with land RMS 0.013 m; while for (2), excluding La Niña results, results are up to 0.53 m with an RMS of 0.014 m. However, removing El Niño years does not lead to a general smoothing, and for some regions, the one-in-five-year levels are seen to increase slightly. In contrast, minimum 5 year water levels (0.55 m for 12 year period) increase by (1) remov-ing El Niño years to up to 0.65 m with RMS 0.014 m, while for (2) excludremov-ing La Niña years leads to up to 0.63 m with RMS 0.013 m.
There is a similar pattern for the results for total flux (not reported here). In line with expectations, we conclude that ENSO influences extreme high water volumes to some extent and less so extremely low levels (storage deficit events). It is also interesting to note that El Niño and La Niña do not appear to have a symmetric effect on water surplus; although due to the reduced sample size such comparisons are problematic and need to be repeated when have longer data records available.
6. Detecting an Intensification From a Future Combined GRACE and
GRACE-FO Record
With 14 years of GRACE data available at the time of writing, and the GRACE Follow-On mission (GRACE-FO) on track for launch in late 2017, it is reasonable to consider whether, and after what time, a continuous mul-tidecadal data set of TWS and TWF will be available to enable the detection of temporal changes in the frequency of extreme water storage and water flux events. In order to answer this question, we conduct a twin experiment: (1) We derive the occurrence frequency of peak total water flux in ERA-Interim, when ana-lyzed over varying time frames from 32 years to 12 years, all ending January 2015. (2) We create a synthetic, composite 32 years GRACE/GRACE-FO data set that is then analyzed for peak TWF frequency over varying anal-ysis intervals. This data set is derived from the “truth” ERA-Interim data by adding realistic, spatially anisotropic GRACE errors. Using a conservative approach, it is assumed that GRACE-FO will have the same error character-istics as GRACE (both GRACE and GRACE-FO errors are synthesized from fully populated, monthly covariance matrices from real-data GRACE analysis over 2013 and 2014, as in Landerer and Swenson [2012], but in random permutations over all 32 years).
Figure 3 shows the ERA-Interim-derived one-in-five-year peak water flux (left) and (right) the same statis-tics derived from synthetic GRACE/GRACE-FO (i.e., “GRACE-perturbed” ERA-Interim), for 2003–2015 (top), 1991–2015 (center), and 1983–2015 (bottom). All results are summarized in Table 1.
We compare ERA-Interim peak TWF return levels over differing time spans but referring to the same seasonal model. Table 1 shows that there are only small differences when averaged over all land areas, but they can be identified for certain regions (Orinoco basin, northwest India, Siberia). Such differences may be related either to real nonstationarity or to problems in fitting the GEV distribution to small samples. For example, comparing the moment method with maximum likelihood (ML) estimation, or using the information matrix from the ML approach [Hosking, 1985], suggests that 1𝜎 values may be at the 0.01–0.02 m/month level from 12 years. However, in our twin experiment we will assume that they represent the “target signal” to be detected from the gravity mission records. As expected, differences grow with decreasing analysis window. As a reference, for the same 12 year period for which we analyzed real GRACE data, reanalysis-derived return levels differ from those derived from 32 years by about 0.01 m/month RMS and up to 0.09 m/month for the above men-tioned regions. It is of course possible that ERA-Interim fails to capture real nonstationarity; in this case our GRACE/GRACE-FO simulation is biased toward stationarity and therefore conclusions on detectability may be too conservative.
The differences between one-in-five-year levels of peak TWF from simulated GRACE/GRACE-FO data and the corresponding “truth” ERA-Interim-derived levels (right column in Table 1) vary from 0.007 m (32 years) to 0.011 m (8 years); differences are related to the data record length but much less compared to Gaussian statis-tics such as applied in trend estimates. Our twin experiment simulates that for the 12 year period analyzed in this study from real GRACE data, average RMS errors may be slightly above the 0.01 m level. In fact, GRACE-like errors amplify near-zero peak levels over the Sahara desert (Figures 3b, 3d, and 3f ) to about 0.02 m/month which is almost exactly what we observe from the real GRACE data (Figures 2a and 2b). In addition, the visual
Figure 3. (a) One-in-five-year levels of anomalously high TWF from ERA-Interim, 2003–2015; (b) same but from simulated GRACE data (ERA-Interim plus GRACE correlated noise model), 2003–2015; (c) one-in-five- year levels of anomalously high TWF from ERA-Interim, 1991–2015; (d) same but from simulated GRACE data (ERA-Interim plus GRACE correlated noise model), 1991–2015; (e) one-in-five-year levels of anomalously high TWF from ERA-Interim, 1983–2015; and (f ) same but from simulated GRACE data (ERA-Interim plus GRACE correlated noise model), 1983–2015.
Table 1. Differences of One-in-Five Year Levels From ERA-Interim and Simulated GRACE/GRACE-FO Derived TWF With Respect to ERA-Interim, 1983–2015 (Latitude-Weighted Land-Only RMS, m/Month)
ERA-I GRACE/GRACE-FO GRACE/GRACE-FO
Years Versus 1983–2015 Versus ERA-I 1983–2015 Versus ERA-I, Same Time Frame
2007.0−2015.0 8.0 0.012 0.015 0.011
2003.0−2015.0 12.0 0.009 0.012 0.009
1999.0−2015.0 16.0 0.008 0.011 0.009
1991.0−2015.0 24.0 0.004 0.008 0.008
Geophysical Research Letters
10.1002/2016GL069538
correspondence is striking, suggesting that our error model may be quite close to the real noise. With the above, it is possible to conclude that ERA-Interim return levels are above the noise level for nearly 90% of the total land area.
Finally, the RMS fit of GRACE/GRACE-FO peak levels from differing analysis windows to the 32 year ERA-interim five-in-one-year return levels (middle column in Table 1) suggests that temporal variability (or sampling error) in the “true” water flux and the effect of GRACE errors add up virtually independently. This metric tells how well the satellite-derived return levels from limited observational records would reconstruct “true” return levels under the assumption of stationarity.
The main conclusion drawn from the twin experiment conducted here is that GRACE/GRACE-FO errors will allow one to derive return level statistics for water flux extremes at the 0.010–0.012 m/month land aver-age error level within a 12 year temporal window (Table 1). It will allow one to derive the same statistics only slightly less accurate within an 8 year window and more accurate within a 32 year window (down to 0.007 m/month). In light of our 12 year comparison of GRACE and ERA-Interim discussed in the previous section, this means that the differences observed by GRACE (Figure 3a versus Figure 3c and Figure 3b versus Figure 3d) exceed a noise level of 0.01 m/month for about 40% of the land area (and, conservatively, a noise level of 0.03 m/month for still more than 9% of the area).
This suggests that a moving-window approach can be applied to a near-future GRACE/GRACE-FO time series to isolate temporal changes in extreme water flux frequency. The error estimates obtained here can be com-pared against such changes in the ERA-Interim record, to determine for which part of the landmass changes would be detected at a given statistical significance level. Yet identification of such an “intensification” neces-sitates contrasting a certain window against a reference period of at least the same duration. As mentioned before, intensification means changes in the mean, variability, or skewness of extremes and would therefore lead to a change in, e.g., one-in-five-year levels. With this in mind, we deduce that for a 24 year data record with two 12 year windows (i.e., corresponding to 2027, which is likely within the GRACE-FO lifetime), we could have detected about 13–18% of the frequency changes in ERA-Interim (this is the share of land area where changes exceed the noise). Surprisingly, for a 32 year data record, divided into two windows each of about the lifetime of GRACE, only 10–16% would be detected; this is since the longer time frame tends to temporally average out changes in peak frequency despite allowing for better GEV fitting. In contrast, our results suggest that already for a 16 year record (i.e., 2019) for 13–21% of land area those changes in frequency that were captured in the recent 8 year period in ERA-Interim with respect to the previous one would be detectable.
7. Conclusions
Climate variability and a range of direct and indirect anthropogenic modifications of the water cycle cause land-atmosphere water fluxes and surface runoff to depart from the regional climatology over a range of timescales. Such anomalous total water fluxes and total water storage signals can be observed with the GRACE satellite mission, and with its successor GRACE-FO hopefully launched in 2017, we may have soon a multidecade observational record available for use in informing model simulations.
Here we have focused on the occurrence of extreme, annual maximum, or minimum anomalous fluxes and storages in the GRACE record. Using 144 months of GRACE data, we quantify and map return levels (expected anomalous flux or storage once in N years) of these extremes, with good statistical significance. It is found that most of the hot spot regions correspond to regions of known large storage amplitudes due to groundwater variability, seasonal flooding or inundation; however, the situation is complex and not symmetric. Few studies so far have aimed to analyze lateral water redistribution using GRACE due to its comparably low resolution, but this study shows that it is largely possible to achieve this when focusing on extreme events.
The current GRACE data set has previously been used to isolate and study the response of total water storage, groundwater, and river discharge to extreme events such as heat waves and heavy-precipitation years. However, the data set is too short to derive conclusions on changes in the probability of such events. But pro-vided the GRACE mission will be succeeded by GRACE-FO, we conclude that by around the year 2020, it will be possible to detect changes in the frequency of extreme total fluxes for at least 10–20% of the continental area, when assuming that the magnitude of such changes corresponds to what we observed in the ERA-Interim reanalysis over the past decades. We anticipate that such changes may occur along with an intensified water cycle due to global warming and as the combined effects of precipitation and floods. There is no consensus
yet as to what exactly may happen in the future, or where changes will occur, but this study suggests that the combined GRACE/GRACE-FO record may provide a valuable additional observational data set for use in testing hypotheses relating to the changing water cycle.
References
Allen, M., and W. Ingram (2002), Constraints on future changes in climate and the hydrologic cycle, Nature, 419, 224–229. Beard, L. (1962), Statistical Methods in Hydrology, U.S. Army Corps of Eng., Sacramento, Calif.
Chen, J. L., C. Wilson, B. Tapley, L. Longuevergne, Z. Yang, and B. Scanlon (2010), Recent La Plata basin drought conditions observed by satellite gravimetry, J. Geophys. Res., 115, D22108, doi:10.1029/2010JD014689.
Dee, D. P., et al. (2011), The ERA-Interim reanalysis: Configuration and performance of the data assimilation system, Q. J. R. Meteorol. Soc.,
137(656), 553–597.
Döll, P., H. Müller Schmied, C. Schuh, F. T. Portmann, and A. Eicker (2014), Global-scale assessment of groundwater depletion and related groundwater abstractions: Combining hydrological modeling with information from well observations and GRACE satellites,
Water Resour. Res., 50, 5698–5720, doi:10.1002/2014WR015595.
Durack, P., S. Wijffels, and R. Matear (2012), Ocean salinities reveal strong global water cycle intensification during 1950 to 2000, Science,
336(6080), 455–458.
Eicker, A., E. Forootan, A. Springer, L. Longuevergne, and J. Kusche (2016), Does GRACE see the terrestrial water cycle “intensifying”?,
J. Geophys. Res. Atmos., 121, 733–745, doi:10.1002/2015JD023808.
Flechtner, F., K.-H. Neumayer, C. Dahle, H. Dobslaw, E. Fagiolini, J.-C. Raimondo, and A. Güntner (2016), What can be expected from the GRACE-FO laser ranging interferometer for Earth science applications?, Surv. Geophys., 37(2), 453–470.
Folland, C., T. Karl, J. Christy, R. Clarke, G. Gruza, J. Jouzel, M. Mann, J. Oerlemans, M. Salinger, and S.-W. Wang (2001), Observed climate variability and change, in Climate Change 2001: The Scientific Basis. Contribution of Working Group I to the Third Assessment Report of
the Intergovernmental Panel on Climate Change, edited by J. Houghton et al., pp. 99–181, Cambridge Univ. Press, Cambridge, U. K. and
New York.
Forootan, E., R. Rietbroek, J. Kusche, M. Sharifi, J. Awange, M. Schmidt, P. Omondi, and J. Famiglietti (2014), Separation of large-scale water storage patterns over Iran using GRACE, altimetry and hydrological data, Remote Sens. Environ., 140, 580–595.
Houborg, R., M. Rodell, B. Li, R. Reichle, and B. F. Zaitchik (2012), Drought indicators based on model-assimilated Gravity Recovery and Climate Experiment (GRACE) terrestrial water storage observations, Water Resour. Res., 48, W07525, doi:10.1029/2011WR011291. Humphrey, V., L. Gudmundsson, and S. Seneviratne (2016), Assessing global water storage variability from GRACE: Trends, seasonal cycle,
subseasonal anomalies and extremes, Surv. Geophys., 37, 357–395.
Huntington, T. (2006), Evidence for intensification of the global water cycle: Review and synthesis, J. Hydrol., 319, 83–95.
Hosking, J. R. M. (1985), Maximum likelihood estimation of the parameters of the generalized extreme value distribution, Appl. Stat., 34, 301–310.
Landerer, F. W., and S. C. Swenson (2012), Accuracy of scaled GRACE terrestrial water storage estimates, Water Resour. Res., 48, W04531, doi:10.1029/2011WR011453.
Martins, E. S., and J. R. Stedinger (2000), Generalized maximum-likelihood generalized extreme value quantile estimators for hydrologic data, Water Resour. Res., 36(3), 737–744.
Moore, P., and S. D. P. Williams (2014), Integration of altimetric lake levels and GRACE gravimetry over Africa: Inferences for terrestrial water storage change 2003–2011, Water Resour. Res., 50, 9696–9720, doi:10.1002/2014WR015506.
Phillips, T., R. Nerem, B. Fox-Kemper, J. Famiglietti, and B. Rajagopalan (2012), The influence of ENSO on global terrestrial water storage using GRACE, Geophys. Res. Lett., 39, L16705, doi:10.1029/2012GL052495.
Rietbroek, R., S.-E. Brunnabend, J. Kusche, J. Schröter, and C. Dahle (2016), Revisiting the contemporary sea level budget on global and regional scales, Proc. Natl. Acad. Sci. U.S.A., 113(6), 1504–1509.
Seoane, L., G. Ramillien, F. Frappart, and H. Leblanc (2013), Regional GRACE-based estimates of water mass variations over Australia: Validation and interpretation, Hydrol. Earth Syst. Sci., 17, 4925–4939.
Springer, A., J. Kusche, K. Hartung, C. Ohlwein, and L. Longuevergne (2014), New estimates of variations in water flux and storage over Europe based on regional (Re) analyses and multisensor observations, J. Hydrometeorol., 15(6), 2397–2417.
Stedinger, J., R. Vogel, and E. Foufula-Georgiou (1992), Frequency Analysis of Extreme Events, edited by R. Maidment, Handbook of Hydrology McGraw-Hill, New York.
Ogawa, R., B. F. Chao, and K. Heki (2011), Acceleration signal in GRACE time-variable gravity in relation to interannual hydrological changes,
Geophys. J. Int., 184(2), 673–679.
Velicogna, I., T. Sutterley, and M. van den Broeke (2014), Regional acceleration in ice mass loss from Greenland and Antarctica using GRACE time-variable gravity data, Geophys. Res. Lett., 41, 8130–8137, doi:10.1002/2014GL061052.
Yoon, J.-H., S. Wang, R. Gilles, B. Kravitz, L. Hipps, and P. Rasch (2015), Increasing water cycle extremes in California and in relation to ENSO cycle under global warming, Nat. Commun., 6, 8657, doi:10.1038/ncomms9657.
Acknowledgments
We are grateful to Matthieu Talpe for reading an early version of this manuscript, and to the anonymous reviewers for providing helpful remarks. The University of Texas GRACE solutions are available via the GFZ Potsdam Information Systems and Data Center (ISDC, isdc.gfz-potsdam.de) and via the JPL Physical Oceanography Distributed Active Archive Center (PODAAC, www.grace.jpl.nasa.gov). The European Center for Midrange Weather Forecasting provided the ERA-Interim data, which are publicly available.