HAL Id: hal-00303064
https://hal.archives-ouvertes.fr/hal-00303064
Submitted on 20 Aug 2007HAL is a multi-disciplinary open access
archive for the deposit and dissemination of sci-entific research documents, whether they are pub-lished or not. The documents may come from teaching and research institutions in France or abroad, or from public or private research centers.
L’archive ouverte pluridisciplinaire HAL, est destinée au dépôt et à la diffusion de documents scientifiques de niveau recherche, publiés ou non, émanant des établissements d’enseignement et de recherche français ou étrangers, des laboratoires publics ou privés.
An episode of extremely high PM concentrations over
Central Europe caused by dust emitted over the
southern Ukraine
W. Birmili, K. Schepanski, A. Ansmann, G. Spindler, I. Tegen, B. Wehner, A.
Nowak, E. Reimer, I. Mattis, K. Müller, et al.
To cite this version:
W. Birmili, K. Schepanski, A. Ansmann, G. Spindler, I. Tegen, et al.. An episode of extremely high PM concentrations over Central Europe caused by dust emitted over the southern Ukraine. Atmospheric Chemistry and Physics Discussions, European Geosciences Union, 2007, 7 (4), pp.12231-12288. �hal-00303064�
ACPD
7, 12231–12288, 2007 An episode of extremely high PM concentrations over Central Europe W. Birmili et al. Title Page Abstract Introduction Conclusions References Tables Figures ◭ ◮ ◭ ◮ Back Close Full Screen / Esc Printer-friendly VersionInteractive Discussion Atmos. Chem. Phys. Discuss., 7, 12231–12288, 2007
www.atmos-chem-phys-discuss.net/7/12231/2007/ © Author(s) 2007. This work is licensed
under a Creative Commons License.
Atmospheric Chemistry and Physics Discussions
An episode of extremely high PM
concentrations over Central Europe
caused by dust emitted over the southern
Ukraine
W. Birmili1, K. Schepanski1,2, A. Ansmann1, G. Spindler1, I. Tegen1, B. Wehner1, A. Nowak1, E. Reimer3, I. Mattis1, K. M ¨uller1, E. Br ¨uggemann1, T. Gnauk1,
H. Herrmann1, A. Wiedensohler1, D. Althausen1, A. Schladitz1, T. Tuch1,4, and G. L ¨oschau5
1
Leibniz Institute for Tropospheric Research, Leipzig, Germany
2
Leibniz Institute of Marine Sciences, IFM-GEOMAR, Kiel, Germany
3
Institut f ¨ur Meteorologie, Freie Universit ¨at Berlin, Germany
4
Helmholtz Center for Environmental Research, Leipzig, Germany
5
S ¨achsisches Landesamt f ¨ur Umwelt und Geologie, Dresden, Germany
Received: 12 July 2007 – Accepted: 4 August 2007 – Published: 20 August 2007 Correspondence to: W. Birmili (birmili@tropos.de)
ACPD
7, 12231–12288, 2007 An episode of extremely high PM concentrations over Central Europe W. Birmili et al. Title Page Abstract Introduction Conclusions References Tables Figures ◭ ◮ ◭ ◮ Back Close Full Screen / Esc Printer-friendly VersionInteractive Discussion
Abstract
On 24 March 2007, the atmosphere over Central Europe was affected by an episode of exceptionally high mass concentrations of aerosol particles, most likely caused by a dust storm in the Southern Ukraine on the preceding day. At ground-based measure-ment stations in Slovakia, the Czech Republic, Poland and Germany PM10 mass con-5
centrations rose to values between 200 and 1400µg m−3. An evaluation of PM
10
mea-surements from 360 monitoring stations showed that the dust cloud advanced along a narrow corridor at speeds of up to 70 km h−1. According to lidar observations over
Leipzig, Germany, the high aerosol concentrations were confined to a homogeneous boundary layer of 1800 m height. The wavelength dependence of light extinction us-10
ing both lidar and sun photometer measurements suggested the dominance of coarse particles during the main event. At a wavelength of 532 nm, relatively high volume extinction coefficients (300–400 Mm−1) and a particle optical depth of 0.65 was
ob-served. In-situ measurements with an aerodynamic particle sizer at Melpitz, Germany, confirmed the presence of a coarse particle mode with a mode diameter>2 µm, whose
15
maximum concentration coincided with that of PM10. A chemical particle analysis con-firmed the dominance of non-volatile and insoluble matter in the coarse mode as well as high enrichments of Ti and Fe, which are characteristic of soil dust. A combination of back trajectory calculations and satellite images allowed to identify the dust source with confidence: On 23 March 2007, large amounts of dust were emitted from dried-20
out farmlands in the southern Ukraine, facilitated by wind gusts up to 100 km h−1. The
unusual vertical stability and confined height of this dust layer as well as the rapid trans-port under dry conditions led to the conservation of high aerosol mass concentrations along the transect and thus to the extraordinary high aerosol concentrations over Cen-tral Europe. Our observations demonstrate the capacity of a combined apparatus of in 25
situ and remote sensing measurements to characterise such a dust with a variety of aerosol parameters. As a conclusion, the description of dust emission, transport and transformation processes needs to be improved, especially when facing the possible
ACPD
7, 12231–12288, 2007 An episode of extremely high PM concentrations over Central Europe W. Birmili et al. Title Page Abstract Introduction Conclusions References Tables Figures ◭ ◮ ◭ ◮ Back Close Full Screen / Esc Printer-friendly VersionInteractive Discussion effects of further anthropogenic desertification and climate change.
1 Introduction
1.1 Wind-blown dust and climate
Wind-blown dust particles emitted from dry soil surfaces contribute considerably to the global aerosol mass and optical thickness, as well as to particle concentrations near 5
the surface. With the exception of sea salt particles, soil dust contributes globally the highest atmospheric mass load of all aerosol particle types (Textor et al.,2006). Dust particles are part of the coarse mode aerosol typically occurring in the super-µm size
range (Haywood et al., 2001; Reid et al.,2003). Current estimates of annual global emission of dust particles that are available for long-range transport vary between 1000 10
and 2000 Tg (Zender et al.,2004). Frequent transport towards Europe of dust clouds from the Sahara, the largest dust source worldwide, can be observed frequently within the free troposphere (Ansmann et al.,2003;Barkan et al.,2005;Amiridis et al.,2005). Atmospheric dust may therefore affect regional climates directly and indirectly by influ-encing incoming and outgoing solar radiation, modifying cloud properties and precipita-15
tion formation, and by affecting chemical processes in the atmosphere (Solomon et al.,
2007). The magnitudes of these effects depend on mineralogical, chemical and optical particle properties as well as on the vertical extent of the dust clouds in the atmosphere
(Sokolik et al.,2001;Satheesh and Moorthy,2005). A significant uncertainty factor in
quantifying dust fluxes is the lack of knowledge about emission potentials of different 20
source areas (Harrison et al.,2001).
Dust emissions are anticipated to change under changed climate conditions due to alterations in both natural vegetation growth and cultivation patterns, as well as changes in transport pathways (Mahowald and Luo,2003;Tegen et al.,2004;
Wood-ward et al.,2005). Assessments of the role of dust in a different climates require the un-25
derstanding of the controls on dust emission, including the role of changes in land use, 12233
ACPD
7, 12231–12288, 2007 An episode of extremely high PM concentrations over Central Europe W. Birmili et al. Title Page Abstract Introduction Conclusions References Tables Figures ◭ ◮ ◭ ◮ Back Close Full Screen / Esc Printer-friendly VersionInteractive Discussion as human activities can modify dust emissions from soils by changing the availability of
fine particles, e.g., through destruction of soil crusts and removal of vegetation in semi-arid regions. The total amount of soil dust emission from such anthropogenic influence are currently estimated to contribute up to 20% of the total dust emissions (Solomon
et al.,2007). However, such estimates are highly uncertain, as there are currently no 5
appropriate measurements for quantifying large-scale dust emission fluxes. 1.2 Dust activation
Unvegetated areas containing fine and loose sediment can be sources of dust particle emission when strong surface winds occur. The Sahara is the most important source for soil dust worldwide; it is estimated to contribute at least 50% of the global atmo-10
spheric dust load (Goudie and Middleton, 2001). Ground dusts are mainly emitted via the process of saltation (Gillette,1978;Shao et al.,1993;Marticorena and
Berga-metti,1995), where sand particles that are easily lifted from the surface impact on the ground. There, the release of kinetic energy breaks the binding of finer soil particles like clay, which are then available for long-range transport. In some instances direct 15
particle lifting has also been observed (Loosmore and Hunt,2000), but this process is usually only of local importance. Strong winds are required to initiate and sustain dust emission from soils. These are often related to convective systems or the passages of cold fronts (Pye, 1987;Shao, 2000). Dust injected into high atmospheric levels of up to several kilometers can be transported over horizontal distances of thousands of 20
kilometers by strong wind systems (Alpert et al.,2004).
Dust emissions are particularly strong in areas that contain fine and loose sediments. A good agreement has been found between the maximum occurrence of dust over land surfaces observed by satellites and the location of enclosed topographic depressions where fine sediment may have accumulated during the past (Prospero et al., 2002). 25
The emission strength in a potential source region depends on surface properties like the aerodynamic surface roughness length, as structural elements like rocks or vege-tation increase the transport of wind energy to the surface, but also partly absorb this
ACPD
7, 12231–12288, 2007 An episode of extremely high PM concentrations over Central Europe W. Birmili et al. Title Page Abstract Introduction Conclusions References Tables Figures ◭ ◮ ◭ ◮ Back Close Full Screen / Esc Printer-friendly VersionInteractive Discussion energy, increasing the threshold wind friction velocity required for dust emission (
Marti-corena and Bergametti,1995). The presence of crusts can reduce dust emission from a soil surface (Belnap and Gillette,1997). The loss of fine soil material by wind defla-tion can lead to a decrease of dust producdefla-tion from a specific area over time (Gillette
and Chen,2001). Surface disturbances as a consequence of cultivation of soils in dry 5
regions may lead to enhanced dust emissions. In agricultural soils, particle mass fluxes depend on, among other parameters, soil wetness, plant growth, field size, and wind direction at field scales (Donk and Skidmore,2003;Hagen,2004).
1.3 Legal limit values for PM10
Since 2005, legal limit values apply to environmental mass concentrations of PM10 10
within the European Community (Air Quality Framework Directive (96/62/EC) and First Air Quality Daughter Directive (1999/30/EC)). In practice, exceedances of the legal limit values, particularly the daily limit value of 50µg m−3 have occurred at air quality
moni-toring stations in many EU member states frequently, and health scientists have called for a more serious consideration of efficient abatement measures (Annesi-Maesano
15
et al.,2007). The actual reasons for the PM10 exceedances are manifold, and may vary from region to region.
Several works have now examined the causes for the exceedances of the PM10limit value in particular European regions: In the UK, which may be taken as representa-tive for Western Europe, the advection of continental air masses as well as regional 20
secondary aerosol formation seem to be responsible for the majority of exceedances of the daily limit value (Charron et al.,2007). In an arid region like Spain, in contrast, wind-blown dust, partially imported from the Sahara appear to play a major role (
Es-cudero et al., 2007). In the metropolitan area of Berlin, Germany, 50% of the PM10 mass concentration is estimated to originate from regional transport rather than local 25
sources (Lenschow et al.,2001).
For Europe, not only desert dust transported from the Sahara desert may occasion-ally influence the atmospheric particle load but also dust particles blown off agricultural
ACPD
7, 12231–12288, 2007 An episode of extremely high PM concentrations over Central Europe W. Birmili et al. Title Page Abstract Introduction Conclusions References Tables Figures ◭ ◮ ◭ ◮ Back Close Full Screen / Esc Printer-friendly VersionInteractive Discussion soils could contribute to particle concentrations. A synthesis of aerosol measurements
from 24 stations in Europe (Putaud et al.,2004) finds that mineral aerosol is the main component in the PM10−2.5 aerosol fraction, but is only of minor importance for the PM2.5fraction. In urban or rural areas dust from agricultural activities is sometimes as-sumed to be the cause for the PM10mass balance deficit, since a considerable portion 5
of the PM10 content in urban areas may originate from far-range transport. Underesti-mates of PM10concentrations from air quality measurements have been suspected to be attributable to suspended agricultural soil dusts (Vautard et al.,2005).
Given the potential importance of soil dust aerosol for climate and air quality assess-ments and the possibility that dust emissions will change in future climates, improve-10
ments of our knowledge of dust sources and fluxes are essential.
In this paper we describe an exceptional dust event that greatly enhanced particle concentrations across Central Europe. The observations strongly suggest that most of this dust originated from a cultivated region within Europe. The body of obser-vations provides the unique opportunity to characterize a case of anthropogenically 15
induced soil dust emission and transport, which may ultimately help understanding of the changing role of soil dust aerosol under different climate conditions.
2 Measurement data and meteorological calculations
2.1 Satellite images
Due to the influence of dust particles infrared (IR) wavelength, airborne dust can be 20
detected during daytimes and nighttimes by brightness temperature difference (BTD)
(Ackerman,1997;Wald et al.,1998;Sokolik,2002;Brindley and Russell,2006;
Mer-chant et al.,2006). Different absorption and emission properties of dust and the Earth’s surface at different thermal wavelength bands causes the BTD to decrease in the pres-ence of airborne dust. To detect airborne dust by remote sensing, we use a dust index 25
based on brightness temperature (BT) and BTD, converted from thermal IR radiances 12236
ACPD
7, 12231–12288, 2007 An episode of extremely high PM concentrations over Central Europe W. Birmili et al. Title Page Abstract Introduction Conclusions References Tables Figures ◭ ◮ ◭ ◮ Back Close Full Screen / Esc Printer-friendly VersionInteractive Discussion measured by the SEVIRI (Spinning Enhanced Visible and InfraRed Imager) instrument
on board the geostationary Meteosat Second Generation (MSG) satellite (Schmetz
et al.,2002). The satellite is located at 3.5◦W over the equator and has a horizontal
resolution of 3 km at nadir and a time resolution of 15 min. The dust index is com-posed of the BTD at 12.0–10.8µm and at 10.8–8.7 µm, as well as of the BT at 10.8 µm
5
(Schepanski et al., 2007). It is based on the same BTs as EUMETSAT’s dust index product of MSG scenes offered on its website (http://www.eumetsat.int, as of 11 June 2007).
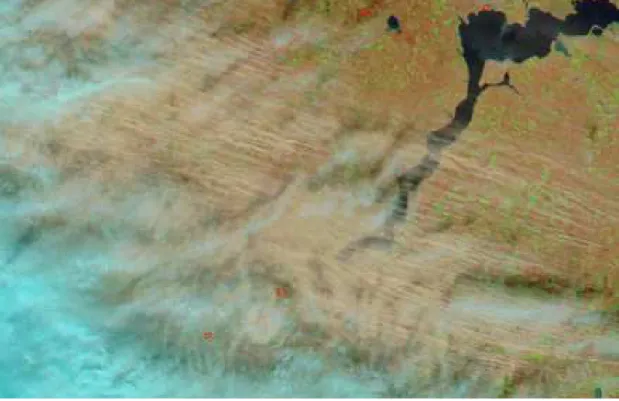
In an alternative approach, mobilised dust can be identified in Moderate-resolution Imaging Spectroradiometer (MODIS) 721-composite pictures, using the near infrared 10
(2155 nm) and two shortwave (876 nm, 670 nm) wavelength bands. The MODIS instru-ment flies on board of two polar-orbiting satellites, Terra and Aqua. True colour and composite pictures are available on the MODIS web site (http://rapidfire.sci.gsfc.nasa.
gov/subsets, as of 11 June 2007) at 1 km, 500 m and 250 m horizontal resolution for predefined subsets. Here we use part of the Europe 2 04 Subset with a horizontal res-15
olution of 250 m, imaged by the Earth Observing System (EOS) Aqua satellite on 23 March at 10:50 UTC. Due to its high reflectivity in the near infrared wavelength band (2155 nm) and its absorbent behaviour in the 670 nm and 876 nm wavelength bands, vegetation appears green in the composite picture. Bare soil causes a high reflectivity in all wavelength bands, especially in the 2155 nm wavelength band, so they can be 20
identified by a brownish colour.
2.2 Lidar and Sun photometer observations
A low-cost, small and compact, semi-automated Raman lidar routinely monitors the troposphere over Leipzig (Althausen et al., 2004). For daytime periods, the vertical profile of the particle extinction coefficient at 532-nm wavelength is determined from 25
the elastically backscattered aerosol signal. The extinction profile can be retrieved in a well-mixed boundary layer if a sun photometer observation of the total particle optical depth is available (Ansmann and M ¨uller,2005), as is the case here. Due to the
ACPD
7, 12231–12288, 2007 An episode of extremely high PM concentrations over Central Europe W. Birmili et al. Title Page Abstract Introduction Conclusions References Tables Figures ◭ ◮ ◭ ◮ Back Close Full Screen / Esc Printer-friendly VersionInteractive Discussion incomplete overlap of the laser beam with the receiver field of view, the retrieval of the
profile is generally restricted to heights above about 400 m.
Leipzig is also an Aerosol Robotic Network (AERONET) site (Holben et al.,1998). The Leipzig sun photometer measures the particle optical depth at the 8 wavelengths, 340, 380, 440, 500, 675, 870, 1020, and 1640 nm continuously. AERONET data can 5
be accessed through its corresponding website (http://aeronet.gsfc.nasa.gov, as of 11 June 2007).
2.3 PM10 network observations
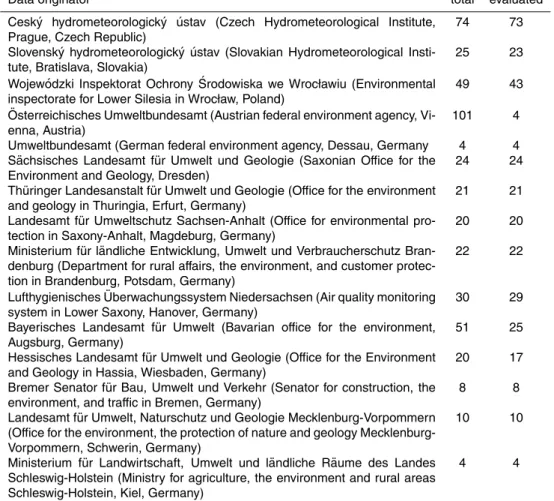
PM10 mass concentrations are measured on a routine basis in every member state of the EU. For this paper we evaluated time series from more than 360 governmental air 10
pollution monitoring stations in Slovakia, the Czech republic, Austria, Poland, and Ger-many. Most data were available at a time resolution of 30 min and generally measured by either the Tempered Oscillating Microbalance (TEOM) (Allen et al.,1997), or beta-gauge attenuation (Macias and Husar,1976). A complete overview of the institutions that have supplied PM10 data and the number of monitoring stations involved is given 15
in Table1in Appendix A.
2.4 In situ measurements in Saxony
In-situ measurements of atmospheric aerosols were conducted during the dust episode at a number of measurement sites in Saxony, Germany. The most comprehensive set of measurements was carried out at the atmospheric research station Melpitz (51.2◦ N,
20
12.9◦ E), operated by the Leibniz Institute for Tropospheric Research near Leipzig.
Atmospheric aerosols arriving in different air mass types at Melpitz have been widely characterised regarding their physical and chemical features (Neus ¨uss et al., 2002;
Spindler et al., 2004; Birmili et al., 2001; Engler et al., 2006), and Melpitz has also
been a focal site for the comparison of aerosol characterisation techniques (M ¨uller
25
et al.,2004).
ACPD
7, 12231–12288, 2007 An episode of extremely high PM concentrations over Central Europe W. Birmili et al. Title Page Abstract Introduction Conclusions References Tables Figures ◭ ◮ ◭ ◮ Back Close Full Screen / Esc Printer-friendly VersionInteractive Discussion During the observation period between 23 and 25 March 2007, particle number size
distributions in a size range between 3 and 800 nm were measured using a twin differ-ential mobility particle sizer (TDMPS). This instrument is based on a parallel combina-tion of two differential mobility analysers and determines electromobility size distribu-tions (Birmili et al.,1999). In addition, coarse particle number size distributions were 5
measured across the aerodynamic particle size range between 0.8 and 10µm using
an aerodynamic particle sizer (model 3321, TSI Inc., St Paul, USA; see Peters and
Leith,2003).
Both TDMPS and APS data were combined to obtain a complete particle number size distribution from 3 nm to 10µm. This requires a transformation of the APS
dis-10
tributions from aerodynamic to electromobility diameter using an effective density of 2.0 g cm−3, which complies with the average properties of mineral dust (e.g., Maring
et al., 2003). Also, TDMPS and APS size distributions were corrected for particle losses in the ambient aerosol inlet. Here, we accounted for transport losses of small particles due to Brownian diffusion in laminar flow, as well as sedimentation losses 15
along horizontal sections of the inlet pipe, which were calculated using analytical for-mulae (Hinds,1999;Brockmann,2001).
Since particles larger than the upper size limit of the TDMPS instrument (800 nm) were not removed physically, the multiple charge inversion of the mobility raw distri-butions requires the knowledge of the concentrations of larger particles. As the size 20
distribution of coarse particles was obtained by APS measurements, their effect could be accounted for prior to the TDMPS charge inversion. The calculation, presented in more details in Appendix B, showed that the contribution of coarse particles to the
sub-µm raw mobility distribution was not negligible during the dust event and about 40% at
maximum. 25
Particle number size distributions were also recorded at two governmental air pollu-tion monitoring sites in Saxony, Niesky (51.3◦N, 14.8◦E) and Schwartenberg (50.7◦N,
13.5◦E). Here, a TDMPS with a particle size range of 3–800 nm, and a scanning
mobil-ity particle sizer (SMPS) with a size range of 10–800 nm were deployed, respectively. 12239
ACPD
7, 12231–12288, 2007 An episode of extremely high PM concentrations over Central Europe W. Birmili et al. Title Page Abstract Introduction Conclusions References Tables Figures ◭ ◮ ◭ ◮ Back Close Full Screen / Esc Printer-friendly VersionInteractive Discussion The SMPS was based on a single differential mobility particle sizer in conjunction with
a condensation particle counter (model 3010, TSI Inc.).
Size fractionated particle mass concentrations of PM10, PM2.5 and PM1were mea-sured at Melpitz using a GRIMM Environmental Dust Monitor (EDM, model 107, Grimm Inc., Ainring, Germany). This instrument uses a semiconductor laser as light source 5
to monitor the light scattering of single particles. Ambient aerosol was sampled at a flow rate of 1.2 l min−1. The device generates a clean and particle-free sheath air
stream which passes through the optical chamber and serves to prevent dust contam-ination in the laser-optic system and as a zero reference air during the auto-calibration procedure. As single particles pass through the laser beam in the optical chamber, 10
light scattering occurs and is culminated by a mirror that is located 90◦ from the laser
source and measured by a recipient diode. The signal of that diode is recorded by a multi-channel size classifier. A pulse height analyzer then classifies the transmitted signal in each channel. Conversions from the measured particle number to volume and from volume to mass distribution are performed using internal protocols developed by 15
Grimm Inc. For Melpitz, we found that the PM mass concentrations measured by EDM have been very similar to those measured by the reference methods (TEOM and filters sampling).
The EDM deployed at Melpitz is additionally equipped with a specially designed heated inlet in order to realize measurements at different inlet temperature. The air 20
temperatures in these two separate inlet lines correspond to ambient temperatures (10◦C at maximum on 24 March 2007), and 50◦C, respectively. The sampling line
lead-ing to the EDM is switched between ambient temperature and 50◦C every half hour
so that both measurements can be compared. A temperature of 50◦C is, in particular,
sufficient to evaporate nitrate compounds prior to analysis (see, e.g.,Hildemann et al., 25
1984). The interested reader may also be referred to the work byGrover et al.(2006), who discuss recent comparison experiments of the EDM with alternative volatility char-acterisation techniques.
ACPD
7, 12231–12288, 2007 An episode of extremely high PM concentrations over Central Europe W. Birmili et al. Title Page Abstract Introduction Conclusions References Tables Figures ◭ ◮ ◭ ◮ Back Close Full Screen / Esc Printer-friendly VersionInteractive Discussion 2.5 Particle sampling and chemical analysis
At the Saxonian observation sites Melpitz, Niesky, Schwartenberg, as well as Dresden-Nord and Dresden-Herzogingarten (both 51.0◦N, 13.7◦E) aerosol particles were
col-lected using PM10 and PM2.5 high volume filter samplers (DHA-80, Digitel Elektronik, Hegnau, Switzerland). The samples were collected over 24 h on 150 mm quartz fibre 5
filters (MK 360, Munktell Filter AG, Falun, Sweden). After equilibration at 50% relative humidity the filters were weighed and divided for the subsequent analyses as described
inPlewka et al.(2004).
The analysis of ionic components followed standard methods of ion chromatogra-phy (Metrohm) and capillary electrophoresis (Spectrophoresis1000). For a detailed 10
description of these methods we refer toBr ¨uggemann and Rolle (1998) andNeus ¨uss
et al. (1999). Organic and elemental carbon (OC/EC) were analysed by a two-step thermographic method using a non-dispersive infrared (NDIR) carbon analyser (C-mat 5500, Str ¨ohlein, D ¨usseldorf, Germany). The method, extensively described inPlewka
et al. (2004) is a variation of the official guideline VDI 2465 (Part 2, 1999). Metal anal-15
yses were carried out by inductively coupled plasma optical emission spectrometry (ICP-OES) according to DIN EN ISO 11885.
2.6 Back trajectory calculations
3d-backward trajectories were calculated to determine transport patterns and source regions for the dust particles observed over Central Europe. For the period between 20
15 March and 1 April 2007 backward trajectories were determined by fine mesh anal-ysis (Reimer and Scherer, 1992). The back trajectories were started at 20 receptor locations in Germany using 10 minute time steps. The trajectory technique utilises an isentropic coordinate system as well as a mixed dynamical/kinematical scheme with a sigma surface at the lower boundary. The column contacts of all trajectories on 24 25
March 2007 were integrated for a 1 km2grid over Europe. For each site three types of trajectories were started: A first one driven by the 3d-wind field only, a second one with
ACPD
7, 12231–12288, 2007 An episode of extremely high PM concentrations over Central Europe W. Birmili et al. Title Page Abstract Introduction Conclusions References Tables Figures ◭ ◮ ◭ ◮ Back Close Full Screen / Esc Printer-friendly VersionInteractive Discussion a relative vertical velocity of 0.5 mm s−1 and third one with a relative vertical velocity
of 1.0 mm s−1. The vertical velocities were introduced to account for the gravitational
settling and correspond to dust particle diameters of 2.8 and 4.0µm, respectively. For
each trajectory the parameters pressure, height and date were collected at the grid cells and the resulting local mean values for each grid were determined by considering 5
the local contact frequency.
3 Meteorological overview
3.1 Synoptic overview
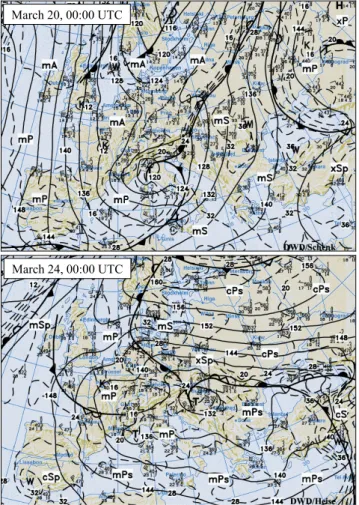
On 20 March 2007, four days prior to the dust observations, the synoptic situation of Europe was governed by a low pressure area over Northern to Southern Europe (see 10
Fig.1, top chart), built-up by eastward travelling depressions located over Scandinavia and the west Mediterranean region. Both depressions correspond to an extensive ver-tical cold-air pool. In front of the Mediterranean low pressure system North African air masses with dust were transported to the North. From 21 to 24 a permanent anti-cyclone was located over East Europe and Fennoscandinavia with dry continental air 15
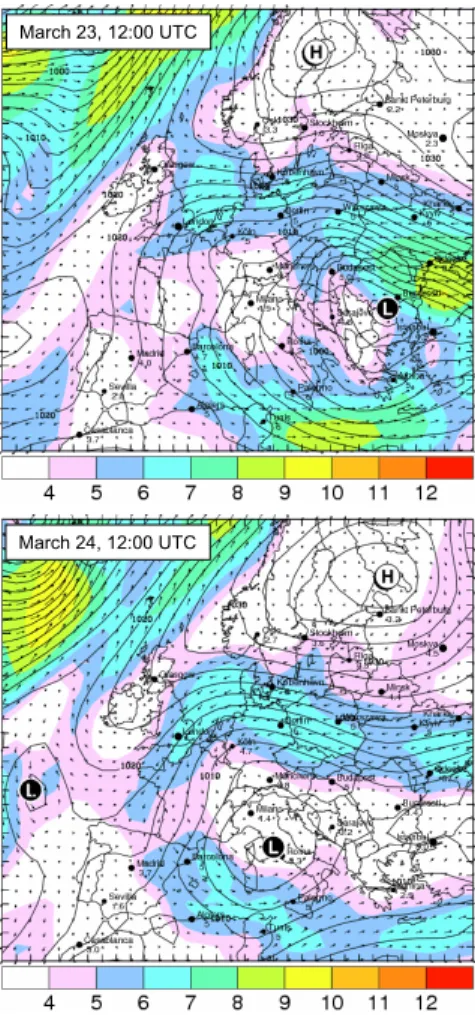
travelling to central Europe, as depicted in the bottom chart of Fig.1. The depression over the West Mediterranean, which had stayed relatively immobile until 24 March, started to move eastwards. The combination of the eastward-moving depression, the anticyclone over South Russian and the cold-air pool to the high pressure region over East and North Europe forced a strong easterly wind over the Black Sea and the south-20
ern Ukraine on 23, 24 March, continuing until 25 March. The high wind speeds over the southern Ukraine and the transport corridor featuring high wind speeds are displayed in Fig.2. Importantly, the distribution of the pressure systems effected a transport of a dry and subsiding air mass form the Black Sea area to Central Europe along a nar-row corridor: Starting in the morning on 23 March over the Southern Ukraine, the air 25
mass was transported across the Ukraine, Slovakia, Poland, the Czech Republic, and 12242
ACPD
7, 12231–12288, 2007 An episode of extremely high PM concentrations over Central Europe W. Birmili et al. Title Page Abstract Introduction Conclusions References Tables Figures ◭ ◮ ◭ ◮ Back Close Full Screen / Esc Printer-friendly VersionInteractive Discussion reached Germany on 24 March. The transect was characterised by high wind speeds
of more than 50 km h−1 and a low humidity north of the frontal line indicated in the
bottom chart of Fig.1. 3.2 Back trajectories
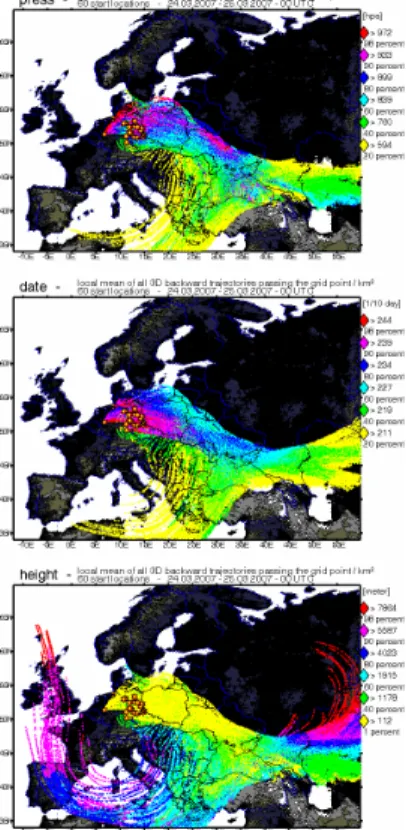
The exact pathway of the air mass arriving in Central Europe was verified through back-5
ward trajectory computations. Bundles of back trajectories arriving at 20 receptor sites in Germany are shown in Fig.3. The calculations were made for particles without grav-itational settling, and for particles with sedimentation velocities of 0.5 and 1.0 mm s−1,
which corresponds to dust particle diameters of 2.8 and 4.0µm, respectively.
In analogy to the wind field shown in Fig.2the trajectory model predicts a strongly 10
channelled flow from the region of the Caspian Sea over Ukraine towards Central Eu-rope (see Fig. 3 (centre graph) with red and magenta areas). Air from the northern shore of the Black Sea is predicted to reach Germany within only 18 to 24 h. The low-level dust cloud is pictured by yellow and green colours in Fig.3 (bottom graph), showing that between the Ukraine and the receptor area, all trajectories moved at 15
heights below 1500–1600 m. The trajectory calculations cover the movement of the dry air mass depicted in Fig.1, and reproduce the spatial distribution of the PM10peak values, which is shown later.
It is noticeable that the back trajectory calculations allow the transport of particles into Central Europe in air from southerly directions, which merge with the easterly flow 20
over the southern Ukraine. Such a transport across the Mediterranean is, however, only possible if gravitational settling of particles is taken into account. All air masses considered subsided on 22 and 23 March over south-eastern Europe and formed the low level jet towards Central Europe
ACPD
7, 12231–12288, 2007 An episode of extremely high PM concentrations over Central Europe W. Birmili et al. Title Page Abstract Introduction Conclusions References Tables Figures ◭ ◮ ◭ ◮ Back Close Full Screen / Esc Printer-friendly VersionInteractive Discussion 3.3 Satellite images
Due to its high spatio-temporal resolution dust source activation and dust transport can be tracked with the SEVIRI instrument at high accuracy (Sect.2.1). Fig.4shows SEVIRI’s MSG dust index image on 23 March, 11:00 UTC, which reveals a strong event of dust emission over the Southern Ukraine, as indicated by magenta colour. Due to 5
continuing high wind speeds, even a second event of dust source activation could be detected on the following day, 24 March. The dust emission shown in Fig.4is located exactly on the pathway that leads the air mass from this region to Central Europe.
A more detailed view of the source region can be seen in Fig. 5, which shows the southern and eastern area of the Kahkova Reservoir. The MODIS Aqua compos-10
ite picture confirms the dust emission, which occurs over an area of approximately 20 000 km2. Brown stripes of dust can be seen over the blue-black colour of the reser-voir, indicating dust mobilised from agricultural soil. In fact, the composite picture is not very sensitive for airborne dust, and the colour of the dust can be seen to agree with the colour of the surface, which consists of agricultural soil. Southern Ukraine is known 15
for its fertile black earth (Chernozem), which has been intensively used for agriculture in the past and can, to date, be classified as erodible soil.
Interestingly, the dust emission and transport can be seen to take place along lengthy filaments, located between 1.5 and 3 km apart (Fig.5). On 23 March, local meteorolog-ical observations over the southern and eastern area around the Kahkova Reservoir 20
report average wind speeds up to 50 km h−1 and wind gusts up to 90 km h−1, and also
confirmed the “observation of atmospheric dust”. Radiosounding observations in Kiev (23 March, 12:00 UTC) show a logarithmic wind speed profile that reached a maxi-mum of 50 Kn at an altitude of 1500 m. It is likely that these unusually high surface wind speeds in combination with a preceding drought period of two weeks as well as 25
the low roughness length due to lack of vegetation in March led to the high dust emis-sion rates.
It is noteworthy that in MSG dust index images (not shown) the dust cloud could be
ACPD
7, 12231–12288, 2007 An episode of extremely high PM concentrations over Central Europe W. Birmili et al. Title Page Abstract Introduction Conclusions References Tables Figures ◭ ◮ ◭ ◮ Back Close Full Screen / Esc Printer-friendly VersionInteractive Discussion detected from about 24 March, 00:00 UTC over Germany again, albeit in a reduced
fashion after 08:00 UTC due to a cover of non-precipitating clouds.
While it may be theoretically possible that the dust cloud arriving at Central Europe contained significant contributions of Saharan dust, two arguments diminish the likeli-hood of this option: First, Saharan dust can only enter into Central Europe in significant 5
amounts via lofted aerosol layers (Ansmann et al.,2003;Barkan et al.,2005;Amiridis
et al.,2005). If being transported through the planetary boundary layer, precipitation on the northern shores of the Mediterranean would usually quickly remove dust aerosol particles. In lofted aerosol layers dust concentrations remain relatively stable, but would need to mix with boundary layer air in order to be detectable on the ground, as was 10
the case on 24 March. Due to the necessary vertical dilution process, a multiple of the near-ground mass concentration would have been needed in such a lofted layer of Saharan dust.
A second argument is that Saharan dust would have been required to pass over Turkey and the Black Sea in order to merge over the southern Ukraine with the easterly 15
flow from from the Caspian Sea (Fig.3). On 23 March, there were numerous cloudless satellite scans over Turkey and the Black Sea, but in fact, no quantities of dust could be detected there in the satellite images. Therefore, we conclude that the dust cloud observed on 24 March in Central Europe originates overwhelmingly from the source identified in the southern Ukraine.
20
4 Aerosol measurements in Central Europe
4.1 Observations within the PM10network 4.1.1 Time series of PM10
Exceptionally high concentrations of airborne particulates were observed on 24 March 2007 at numerous governmental air pollution monitoring stations in Slovakia, the Czech 25
ACPD
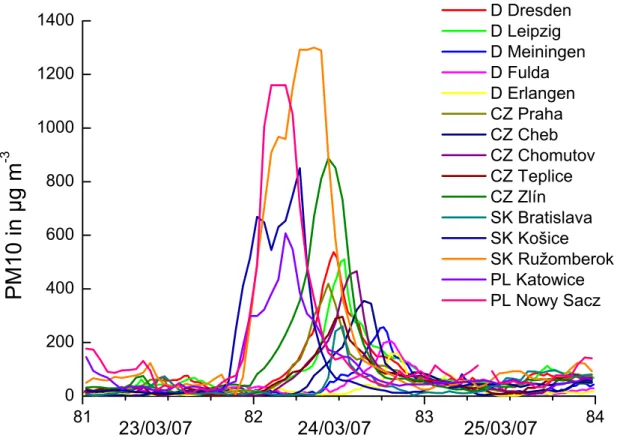
7, 12231–12288, 2007 An episode of extremely high PM concentrations over Central Europe W. Birmili et al. Title Page Abstract Introduction Conclusions References Tables Figures ◭ ◮ ◭ ◮ Back Close Full Screen / Esc Printer-friendly VersionInteractive Discussion republic, Poland, Austria and Germany. Figure6illustrates the time series of PM10 at
a number of selected monitoring stations. As can be seen in the figure, the concentra-tions were below 50µg m−3at most stations – occasionally around 100µg m−3, before
the arrival of the dust layer. The first station to detect the dust event was Koˇsice in East-ern Slovakia (48.7◦N, 21.2◦E) in the late evening of 23 March, when the concentrations
5
augmented dramatically within a matter of two hours (Fig.6).
During the entire day of 24 March, the dust cloud was transported in westerly di-rection, thereby traversing Central Europe in a confined band. PM10 concentrations increased up to 1400µg m−3 in Slovakia in the morning of 24 March, and up to
600µg m−3 in Germany during mid-day. Importantly, the event could be seen as a
10
clear, outstanding peak in the time histories of all monitoring stations crossed by the dust cloud, regardless whether the station was a rural or urban background station, or even a roadside station.
4.1.2 Geographic mapping of the dust event
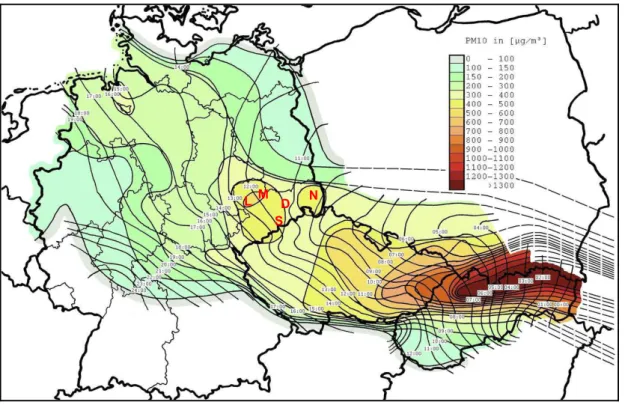
Figure 7 shows the map of peak PM10 mass concentrations during the dust event, 15
generated from observational data at a total number of about 360 monitoring stations (cf. Table1). The PM10time series at all monitoring stations traversed by the dust cloud showed a pronounced maximum, and were similar in shape to those shown in Fig.6. In order to simplify the amount of data, all individual time series were parametrised by Gaussian model curves, thereby yielding two parameters: (a), the peak value of PM10 20
concentration and, (b) the time of occurrence of this maximum.
The advancement of the dust cloud across Central Europe is visualised in Fig. 7. Shown are the frontal lines that indicate the temporal evolution of the dust cloud as well as the peak PM10 concentrations occurring along the pathway. Remarkably, the highest PM10 concentrations occurred in Slovakia and the Małopolskie voivodeship in 25
Poland, which are the areas the closest to the source region in Ukraine. The other most affected areas include the Czech Republic and the State of Saxony in Germany. It can be seen that the dust cloud moved faster across the south of Poland than across
ACPD
7, 12231–12288, 2007 An episode of extremely high PM concentrations over Central Europe W. Birmili et al. Title Page Abstract Introduction Conclusions References Tables Figures ◭ ◮ ◭ ◮ Back Close Full Screen / Esc Printer-friendly VersionInteractive Discussion the Czech Republic. Two reasons are responsible for this, the flatter terrain in Poland
and the decrease of the wind speed towards the south, where the centre of the low pressure system resides.
After passing across Northern Germany, the dust cloud eventually reached the North Sea in the afternoon of 24 March. In fact, the traces of the dust could still be detected 5
over Southern England, as indicated from UK Automatic Particulate Monitoring Net-work data (not shown here). A time lag analysis of the multiple station data across Central Europe suggests that the air mass was moving at relatively constant speeds around 70 km h−1.
It is noteworthy that towards its southern edge, the dust cloud can be delimited with 10
high accuracy because of the relatively dense coverage of Austria and Germany with PM10 network data. Meteorological observations reported a band of rainfall to the southern edge of the dust cloud, which is most likely one of the reasons why the dust particles did not penetrate further south. The eastern and northern edge of the dust cloud could not be defined with the same accuracy because of the unavailability of 15
PM10 observation data, notably for the Ukraine and some voivodeships of Poland. 4.1.3 Estimation of the total amount of dust
The available spatial coverage of PM10 mass concentrations was used to full capacity when estimating the total mass of dust present in the atmosphere as a result of the dust storm. Since such an estimate will be the most accurate when examining the 20
measurements close to source, we analysed the time series of PM10data from stations that lay in the vicinity of the 04:00 CET frontal line that is shown in Fig.7. Within the proximity of this frontal line lie, from north to south, the monitoring stations Tarn ´ow and Nowy Sacz (both Poland), and Preˇsov, Krompachy, Koˇsice, and Velk ´a Ida (Slovakia).
First, the transversal dimension of the dust cloud was derived from Fig.7. To deter-25
mine the longitudinal dimension of the dust cloud, the flow field was split into separate volume elements passing across each of the 6 stations mentioned above from east to west. The speed of the air mass was determined for each volume element by deriving
ACPD
7, 12231–12288, 2007 An episode of extremely high PM concentrations over Central Europe W. Birmili et al. Title Page Abstract Introduction Conclusions References Tables Figures ◭ ◮ ◭ ◮ Back Close Full Screen / Esc Printer-friendly VersionInteractive Discussion the time lag of PM10observations between different stations along the longitudinal axis.
Thus, the time series of PM10as a function of time could be transformed into curves of PM10 as a function of longitudinal dimension.
Finally, the vertical dimension of the of the dust cloud was estimated from verti-cal profiles of the virtual potential temperature recorded by radiosoundings in at Kiev, 5
Poprad-Ganovce, Wrocław and Prague, resulting in an average of 1400 m across the entire area. It was assumed that the particles were evenly distributed within the bound-ary layer on the vertical axis, which is supported by the lidar profile observed further downwind (cf. Sect.4.3). An integration over the entire concentration field then yielded an approximation for the total dust mass in the atmosphere.
10
Our calculation yielded a total dust mass of 60 Gg for the dust cloud at 04:00 CET. As a matter of PM10 sampling, the figure of 60 Gg can only include aerosol particles
<10 µm in aerodynamic diameter. The mass of the total suspended dust may
accord-ingly have been higher.
4.2 In situ measurements in Saxony 15
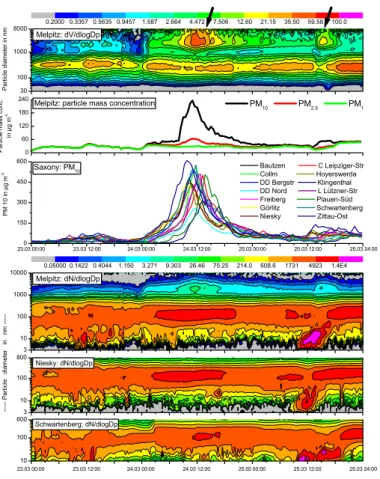
Particle number size distributions across a wide range (3 nm–10µm) were recorded at
the research station Melpitz using a twin differential mobility partcle sizer (TDMPS) and an aerodynamic particle sizer (APS). Figure8shows the particle number and volume size distributions derived from these number distributions as well as integral particle mass concentrations.
20
Figure 8(top graph) reveals the presence of a coarse particle mode resulting from the advection of the air mass from Southern Ukraine on 24 March 2007. Although ex-periencing a concentration rise as early 00:00 CET, the coarse mode attained its maxi-mum concentration in Melpitz at around 11:00 CET, and between 09:30 and 14:00 CET across Saxony. Clearly, this coarse particle mode represents an aerosol population that 25
changes with time independently from the fine particle mode, and is separated from the fine mode by a concentration minimum at 1µm. During its time of maximum
concen-tration the coarse mode was characterised by a count median diameter around 2µm
ACPD
7, 12231–12288, 2007 An episode of extremely high PM concentrations over Central Europe W. Birmili et al. Title Page Abstract Introduction Conclusions References Tables Figures ◭ ◮ ◭ ◮ Back Close Full Screen / Esc Printer-friendly VersionInteractive Discussion and a volume median diameter of about 3µm. In the afternoon, the coarse mode
con-centrations gradually decreased towards their morning level. One day later (25 March, 14:00 CET) a second, albeit less pronounced episode of coarse dust can be seen.
A view at the size-fractionated mass concentrations (Fig. 8, lower top graph) con-firms that the mass concentration of PM10 is almost entirely dominated by the coarser 5
fraction. PM1, which represents the fine mode, remains very constant throughout the entire day of 24 March, and PM2.5 shows a diurnal variation by a factor of two. This implies that during the peak in coarse mode concentration, PM10 is made up to almost 75% by the size fraction PM10−2.5
Simultaneous particle number size distribution measurements at three continental 10
background observation sites across Saxony (Fig. 8, bottom graph) suggested that besides its relative constancy in time, the accumulation particle mode – marked by count mean diameters around 100 nm was rather homogeneously distributed in the horizontal dimension across at a few hundred kilometres. For PM10, the data indicates a similar covariation across 14 measurement sites in Saxony (Fig.8, centre graph). 15
It is of a certain interest that the occurrence of the second dust event on 25 March, 14:00 CET was associated with high concentrations of particles <40 nm as well as
temporarily reduced concentrations of the accumulation mode. A decrease in the ac-cumulation mode in the middle of the day can be indicative of vertical mixing with air from aloft. The observation therefore suggests that the coarse mode particles could be 20
mixed down from a remotely transported layer aloft. The formation of the new particles
<40 nm at all sites could likewise be associated to this mixing process, as this process
tends to bring about favourable conditions for the formation of new particles (Nilsson
et al.,2000,2001).
Meteorological and gas phase chemical observations at the governmental air pollu-25
tion stations (not shown here) yielded a covariations across Saxony regarding temper-ature, relative humidity, ozone and nitrogen dioxide concentrations, which is a further indicator for a spatially homogeneous air mass on 24 March. The relative humidity was very close to 100% during the evening of 23 March, but started to drop at midnight at all
ACPD
7, 12231–12288, 2007 An episode of extremely high PM concentrations over Central Europe W. Birmili et al. Title Page Abstract Introduction Conclusions References Tables Figures ◭ ◮ ◭ ◮ Back Close Full Screen / Esc Printer-friendly VersionInteractive Discussion stations, beginning with the easternmost station Niesky in Saxony. During 24 March,
the relative humidities decreased to values between 40 and 50% at the monitoring stations lower than 150 m above sea level, which confirms satellite observations (not shown) that the air advected from Southern Ukraine was very dry in relation both, to the preceding air mass as well as to the air mass in the centre of the low pressure system. 5
The low relative humidities between 40 and 50% during 24 March also rule out any sig-nificant enhancement of aerosol optical depth by hygroscopic growth. Consequently, the optical observations described in the next section refer to an overwhelmingly dry aerosol.
The ground level wind speeds ranged between 2 and 12 m s−1 in Saxony, which is
10
considerably lower than the 70 m s−1resulting from the multiple site analysis.
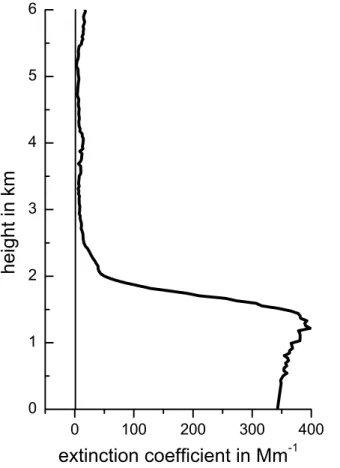
4.3 Lidar and sun photometer observations
Figure9shows lidar observations that were recorded during the time of maximum dust concentration at Leipzig (“L” in Fig. 7). The vertical profile of the volume extinction coefficient suggests that the aerosol plume arriving on 24 March in Central Europe 15
was confined to the lowest two kilometers of the troposphere. On 24 March, no lofted aerosol layers could be detected in the free troposphere, neither in the morning nor the early afternoon. Apparently, the aerosol layer originating from the northern shore of the Black Sea became well mixed during the long-range transport with strong winds. The lidar observations revealed a high particle optical depth of 0.65 and high extinction 20
coefficients of 300 to 400 M m−1at 532 nm throughout the dust layer in the early
after-noon of 24 March 2007. The typical values of the particle optical depth at Leipzig are much lower, around 0.1 and 80–90 M m−1, respectively (Mattis et al.,2004).
The fact that the dust plume could not penetrate into the free troposphere is consid-ered to be the main reason for the high aerosol concentrations measured at ground. 25
In fact, no lofting or mixing with clean free tropospheric air was possible during the transport. The height of the aerosol layer is highly consistent with radiosounding ob-servations further upwind in Wrocław (Poland; 24 March, 00:00 UTC) and Lindenberg
ACPD
7, 12231–12288, 2007 An episode of extremely high PM concentrations over Central Europe W. Birmili et al. Title Page Abstract Introduction Conclusions References Tables Figures ◭ ◮ ◭ ◮ Back Close Full Screen / Esc Printer-friendly VersionInteractive Discussion (Germany; 24 March, 00:00, 06:00, and 12:00 UTC), which suggested mixed layer
heights of 1700 m and 1500 m, respectively. A certain variation in the heights of the aerosol layer as well as the mixed layer as observed during the transect of the dust cloud is anticipated due to inhomogeneities in terrain as well as the synoptic evolu-tion of the air mass. The radiosounding observaevolu-tions suggest a spatial variaevolu-tion in the 5
mixed layer height of a few 100 m.
The AERONET sun photometer measured a particle optical depth of 0.64 at 500 nm at 13:02 UTC at the station IFT-Leipzig (see Fig. 10). The ˚Angstr ¨om exponent of 0.55 derived for the wavelength interval 440–870 nm indicates the presence of a considerable fraction of coarse mode particles with diameters >1.2 µm. Meanwhile,
10
the extinction-to-backscatter ratio (lidar ratio) of 60 sr retrieved from the combined AERONET (optical depth) and lidar observations (column-integrated backscatter co-efficient) show a clear signature of non-spherical soil or dust particles. In the case of a large fraction of large particles as measured at ground, the lidar ratio would be 20– 25 sr according to Mie scattering theory, which assumes spherical particles. As shown 15
during our previous long-term measurements, the lidar ratio for obviously non-spherical particles can be larger by a factor of 2–3 compared to spherical particles (Mattis et al.,
2002).
The sun photometer measurements from 24 March 2007 in Fig. 10 are comple-mented by two cases featuring Sahara dust aerosol, one directly measured close to 20
the Sahara, at Ouarzazate, Southern Marocco, on 15 May 2006, and another after a major transport event of Saharan dust to Leipzig on 14 October 2001 (M ¨uller et al.,
2003;Ansmann et al.,2003). The comparison of the Saharan dust and the Ukrainian
soil dust spectra reveal that the aerosol on 24 March was composed of fine mode parti-cles (continental haze), indicated by a strong spectral dependence of the optical depth 25
from 340–600 nm, and coarse mode particles which cause a similarly flat spectral slope of the optical depth in the range from 800–1700 nm as the Saharan dust particles. The contribution of anthropogenic fine mode particles to the total particle-related optical depth is estimated to be about 0.1. Thus 80% of the optical depth results from light
ACPD
7, 12231–12288, 2007 An episode of extremely high PM concentrations over Central Europe W. Birmili et al. Title Page Abstract Introduction Conclusions References Tables Figures ◭ ◮ ◭ ◮ Back Close Full Screen / Esc Printer-friendly VersionInteractive Discussion extinction by the soil dust.
4.4 Physico-chemical and chemical properties 4.4.1 Volatility of bulk PM at 50◦C
Figure 11 shows the half-hourly time series of PM concentrations measured by the Grimm Environmental Dust Monitor (EDM), which switches in an alternating fash-5
ion between two inlets tempered at ambient temperatures and 50◦C, respectively
(cf. Sect.2.4). During the passage through the heated inlet air stream volatile com-pounds, such as nitrate (Hildemann et al., 1984) are evaporated and deposited onto the walls of the system.
PM1at Melpitz consists of relevant fractions of both, volatile and non-volatile material 10
(Fig.11). The average fraction of material volatile at 50◦C in PM
1 ranged between 11
and 67% on the three days shown and was on average 33%. In contrast, the coarse particle fractions, PM2.5−1 and PM10−2.5contained much less material volatile at 50◦C,
only 14% and 3%, respectively.
Remarkably, the dust-associated mass concentration peak on March 24 (10:00– 15
14:00 CET) was related overwhelmingly to PM2.5−1 and PM10−2.5 and within these, only 6% and 1% of the material could be accounted for by the volatile fraction. This result adds up to the impression that the dust-related mass concentration peak is de-lineated from the fine particle mode (PM1), and made up mostly from crustal material.
For the data shown in Fig. 11 the mean mass concentrations for PM10 and PM2.5 20
were 50.7 and 32.0µg m−3, respectively. It is noteworthy that these results are
in fair agreement with the corresponding bulk DIGITEL measurements of 49.1 and 32.8µg m−3. These results suggest that the Grimm EDM provides correct mass
con-centrations for the aerosol occurring at Melpitz.
ACPD
7, 12231–12288, 2007 An episode of extremely high PM concentrations over Central Europe W. Birmili et al. Title Page Abstract Introduction Conclusions References Tables Figures ◭ ◮ ◭ ◮ Back Close Full Screen / Esc Printer-friendly VersionInteractive Discussion 4.4.2 Main components of bulk PM
Figure 12 gives an overview of the mass concentrations of selected compounds for daily samples of PM10 and PM2.5 at Melpitz on 23, 24 and 25 March. Concentrations for PM10−2.5 were calculated by subtracting the value of PM2.5 from that of PM10. On 23 March, PM10 and PM10−2.5 were significantly increased by the impact of the dust 5
cloud. PM10 reached a daily average value of 84µg m−3 on 24 March, the day of the
dust cloud. The major mass gain from 23 to March 24 March is caused by the coarse fraction PM10−2.5, which increased by a factor of 10.
The chemical speciation identified major amounts of soluble ions (ca. 30%) in PM2.5 on March 23 and a total carbon (TC) fraction of about 8%. PM10−2.5, in contrast, fea-10
tures only negligible amounts of soluble ions, but about 30% carbonaceous material, and an overwhelming fraction (∼70%) of unidentified material. The unidentified mate-rial contains those compounds that are neither soluble, ionic, nor carbonaceous. The major class representing this unidentified fraction in atmospheric aerosols is crustal material, which typically includes silicates and insoluble carbonates (e.g.,
Fernandez-15
Espinosa et al.,2002).
The air mass change from 23 March to 24 March featured, above all, an increase in the unidentified chemical fraction. This change is most notably in PM10−2.5, where the unidentified fraction attains a share of ∼85%. This measurement is a further indicator for the presence of crustal material in the dust aerosol advected into Central Europe. 20
On 25 March, the bulk PM composition changes again, now with a reduced share of unidentified material but an increased fraction of carbonaceous material, notably elemental carbon (Fig.12). This can be taken as indicative of combustion processes taking place upwind the observation sites, and is not surprising based on this air mass’ residence time of more than 6 days over land, as suggested by trajectory calculations. 25
ACPD
7, 12231–12288, 2007 An episode of extremely high PM concentrations over Central Europe W. Birmili et al. Title Page Abstract Introduction Conclusions References Tables Figures ◭ ◮ ◭ ◮ Back Close Full Screen / Esc Printer-friendly VersionInteractive Discussion 4.4.3 Spatial variation of chemical composition
Since chemical analyses of bulk PM samples could be performed for various mea-surement sites in Saxony, we were able to examine the spatial homogeneity of the dust-influenced aerosol within a scale of a few 100 km. Figure 13 illustrates the bulk chemical composition of PM10 at the five sampling stations Dresden-Nord (roadside), 5
Dresden-Herzogingarten (urban background), Schwartenberg (rural), Niesky (rural) and Melpitz (rural). Besides for 24 March, data are shown for 28 March, compari-son day featuring continental air originating in Eastern Europe as well. It is apparent from Fig.13that the spatial variation of chemical composition between the sites tends to be much smaller than, for instance, the day-to-day variations between the different 10
air masses sampled (see Figs.12and 13). In fact, no systematic deviation in chemi-cal can be discerned at the urban background and roadside station for the dominating effect of dust material on PM10.
4.4.4 Ti and Fe in in bulk PM10
The time series of Fe and Ti concentration in daily samples is shown in Fig.14. PM10 15
sampling was conducted on every fourth day within the framework of an aerosol char-acterisation experiment under the auspices of the Saxonian regional office for the en-vironment and geology. Therefore, this data is not available for each day. Fortunately, one of the sampling days (24 March 2007) coincided with the day when the dust cloud could be detected over Central Europe.
20
Figure14reveals that like PM10 mass concentrations, the concentrations of Fe and Ti show a pronounced peak on the day of the dust event. The highest concentrations of Fe and Ti were observed at the station Schwartenberg, 4.4µg m−3and 0.36µg m−3,
respectively. Schwartenberg is a mid-level mountain station 752 m a.s.l. close to the Czech-German border (cf. Fig.7), and it is probably a consequence of this location that 25
the concentrations of these geogenic tracers is the highest here.
To assess the geogenic contributions to a particular particle sample, it can be useful 12254
ACPD
7, 12231–12288, 2007 An episode of extremely high PM concentrations over Central Europe W. Birmili et al. Title Page Abstract Introduction Conclusions References Tables Figures ◭ ◮ ◭ ◮ Back Close Full Screen / Esc Printer-friendly VersionInteractive Discussion to compare the relative mass fraction of a substance in a PM sample to its relative
abun-dance in the upper continental crust. Based on the data shown in Fig.14, the mass fractions of Fe and Ti in PM10 were, as an average at the rural stations Schwarten-berg, Niesky, and Melpitz, 3.2% and 0.24% respectively on 24 March. During the subsequent sampling event on 28 March the values were merely 1.1% (Fe) and 0.08% 5
(Ti). These values give evidence that the high Fe and Ti concentrations on 24 March (Fig.14) are not a result of the variation of total mass, but of the change in chemical composition along with the dust event.
Taylor and McLennan (1985) report crustal abundances of 3.50% (Fe) and 0.30%
(Ti), which are of rather similar value as the 3.2% and 0.24% observed on 24 March 10
2007. It is known that Ti is an element that originates mainly from geogenic sources. A simple mass balance model assuming geogenic dust to be the only source of Ti leads to the result that 80% of the PM10mass concentration observed on March 24 would be geogenic dust.
It is very interesting that the unidentified chemical species presented in Sect.4.4.2
15
make up a mass fraction of 80% as well. An alternative figure is the non-volatile mass in the coarse particle size range 1–10µm. This fraction, which can also be associated
with crustal dust particles made up 68% on 24 March. The divergence from 80% can eventually be explained by the presence of some dust material in PM1.
Unlike for Ti, a mass-balance assessment could not be carried out for Fe because 20
there are significant anthropogenic sources, such as metal abrasion or tyre wear that contribute to ambient Fe concentrations. For urban aerosols in Birmingham, UK,Birmili
et al. (2006) showed that the enrichment of Fe in environmental coarse PM (>1 µm)
was one order of magnitude higher than in fine PM (<1 µm). Consequently, the coarse
mode contributions are expected to control total Fe concentrations in urban PM. The 25
observations of Fig. 14 agree with this effect as far as the Fe concentrations at the urban stations Dresden-Nord and Dresden-Herzogingarten were higher compared to the rural levels between 4 and 24 March. Here, the excess Fe can be attributed to the various urban sources in Dresden. On 24 March, the urban sources do not play
ACPD
7, 12231–12288, 2007 An episode of extremely high PM concentrations over Central Europe W. Birmili et al. Title Page Abstract Introduction Conclusions References Tables Figures ◭ ◮ ◭ ◮ Back Close Full Screen / Esc Printer-friendly VersionInteractive Discussion a crucial role due to the ruling effect of the remotely transported dust particles from
southern Ukraine. Fe concentrations at Dresden-Nord and Dresden-Herzogingarten are between the values for the background stations Niesky and Schwartenberg.
In conclusion, several independent approaches come to the result that the mass fraction of dust in the daily average PM10 sample on 24 March was about 80%.
5
5 Discussion
5.1 Conditions for dust emission and transport
The reasons for the extreme values of PM10 in Central Europe were severalfold. On top of an aged continental air mass moving constantly from South-Easterly direction, coarse dust was activated in Southern Ukraine at extremely high wind speeds. This 10
dust was transported within 24 h into Central Europe along a narrow pathway on the northern edge of a low pressure system. The unusual stability and limited height of this dust layer as well as the rapid transport under dry conditions (day-time relative humidity between 40 and 50%) was responsible for the unusually high mass concentrations of PM in Central Europe. Although an impact of Saharan dust cannot be ruled out 15
based on the backtrajectory analysis (Sect.3.2), the body of satellite and ground-based remote sensing observations make a significant contribution of Saharan dust unlikely. 5.2 Dust mass observed on 24 March 2007
On the basis of PM10 in Central Europe, an attempt was made to estimate the total mass of the dust cloud observed on 24 March 2007. The calculation was made for 20
the frontal line of the dust cloud on 24 March, 04:00 CET, when large concentrations occurred over the Eastern parts of Slovakia and Poland (cf. Fig.7). The calculation made use of the time series of PM10 at six measurement stations in Slovakia and Poland. The estimate of the total dust mass that passed the 04:00 UTC frontal line
ACPD
7, 12231–12288, 2007 An episode of extremely high PM concentrations over Central Europe W. Birmili et al. Title Page Abstract Introduction Conclusions References Tables Figures ◭ ◮ ◭ ◮ Back Close Full Screen / Esc Printer-friendly VersionInteractive Discussion during 8 hours was 60 Gg. This estimate is based on the upper cut-off of the PM10
sampling systems, and hence excludes particles larger than 10µm.
5.3 How frequent does such dust transport occur?
The meteorological analysis in Sect. 3.2 as well as the profile measurements in Sect. 4.3 reveal the major reasons for the observation of the Ukrainian dust cloud 5
in Central Europe: Extraordinary wind speeds in the source region after a two-week drought period, and very rapid transport of the activated dust to the receptor region within an unusually stable and confined boundary layer. The combination of these factors also raises the question how frequent such events may be expected over clima-tologically relevant durations.
10
To address this question, the existing long-term time series of daily PM10 mass con-centrations and chemical composition between 1993 and 2007 at Melpitz was screened for similar dust events. As indicators for signficant dust events we employed (a) high PM10mass concentrations>100 µg m−3, (b) a high mass fraction of chemically
uniden-tified material (cf.4.4.2, and (c) a corresponding low mass fraction of ionic compounds 15
such as nitrate and sulphate.
It can be stated that over the years 1993–2007, no single day could be identified that had chemical composition features similar to the dust cloud observed on 24 March 2007. Therefore, the observed low-level dust cloud over Central Europe is assumed to occur only rarely, probably not more often than once in 10 years. Only two days 20
were found whose parameters came close to its characteristics, December 28, 1996 (PM10 116µg m−3, mass fraction of ionic compounds 27%) and December 11, 2002
(PM10104µg m−3, mass fraction of ionic compounds 27%). A back trajectory analysis
showed that both air masses originated in Central Russia, but were not particularly related to high wind speeds, so that their unidentified chemical fraction cannot be at-25
tributed to a specific area such as on 24 March 2007.
ACPD
7, 12231–12288, 2007 An episode of extremely high PM concentrations over Central Europe W. Birmili et al. Title Page Abstract Introduction Conclusions References Tables Figures ◭ ◮ ◭ ◮ Back Close Full Screen / Esc Printer-friendly VersionInteractive Discussion 5.4 Source region Southern Ukraine
Although some influence by Saharan dust cannot be ruled out entirely, the satellite observations clearly demonstrate the large scale activation of dust over the southern Ukraine (Sect. 3.3). The total area of the Ukraine is 603, 700 km2, 70% of which are used as farm lands. The southern Ukraine has been characterised as a forest-5
steppe zone, in its less droughty part, or as a steppe zone in its more droughty part.
The precipitation is modest (350–400 mm p.a.) with average temperatures of 20◦C in
July. In both zones, human impact has almost completely removed the former native forests and steppe lands, and created large-scale agricultural units. The soil of the area is characterised by wide loess plains that have formed in the ice age under peri-10
glacial conditions. From loess, the very fertile black earth (Chernozem) has formed, which belongs to the most fertile soil types worldwide. Due to the intensive agricultural development, the soil has become prone to wind erosion and in fact, wind has been found to have eroded Ukrainian soils over an area of 220 000 km2(Dolgilevich,1997)
Dolgilevich(1997) also presented an analysis of the frequency and effects of dusts
15
storms in the Ukraine. Meteorological statistics over the past 40 years indicated that dust storms erode soils in all natural zones of the Ukraine. The frequency of dust storms was found to be 3–5 per year in the steppe zone, with an average duration of 8–17 h. Dust storms in the Ukraine are typically associated with wind speeds of 75 km h−1and more. Chernozemic soils have been found to be the most susceptible to
20
wind erosion. During dust storms, these soils can lose 70 t of soil per ha and hour. 5.5 Deforestation and desertification trends
Wind erosion of soils in the area of the former USSR have been recognised in the scientific literature as early as the 1920s and in fact, a considerable body of scien-tific studies (exclusively in Russian language) have been dedicated to the reasons of 25
wind erosion and their environmental and economic consequences (a survey is given
in Dolgilevich, 1997; Larionov et al., 1997). A prime reason for wind erosion is that