Driving a Lean Transformation Using a Six Sigma Improvement Process
By
Satish Krishnan
Bachelor of Science in Mechanical Engineering, University of Pennsylvania (1996) Bachelor of Science in Economics, University of Pennsylvania (1996)
the Department of Mechanical Engineering and the Sloan School of Management in Partial Fulfillment of the Requirements for the Degrees of
Master of Science in Mechanical Engineering Master of Business Administration
In Conjunction with the Leaders for Manufacturing Program at the Massachusetts Institute of Technology
June 2004
C2004 Massachusetts Institute of Technology. All rights reserved.
Signature of
Author-Department of Mechanical Engineering Sloan School of Management May 7, 2004 Certified by
( gborah Nightingale, Thesis Supervisor Professor of the Practice, Department of Aeronautics and Astr'nautics and Engineering Systems Division
Certified by _ ___
CRoy Welsch, Thesis Supervisor P fessor of Statis ?s and Management Science, Sloan School of Management
--I- - A 4 A l I II'
-I
Warren Seering, Thesis ReaderProfessor of Mechanical Engineering
Accepted by
Margaret Andrews, Executive Director of Masters Program Sloan School of Management
Ain Sonin, Department Committee on Graduate Students Department of Mechanical Engineering Accepted by Submitted to MASSACHUSETfTS NsTr TVE OF TECHNOLOGY
JUL
01,
2004
LIBRARIES
Certified by ,xz.
Driving a Lean Transformation Using a Six Sigma Improvement Process
By
Satish Krishnan
Submitted to the Department of Mechanical Engineering and the Sloan School of Management on May 7, 2004 in partial fulfillment of the Requirements for the Degrees of Master of Science in Mechanical Engineering and Master of Business Administration
Abstract
Successive transformations within manufacturing have brought great efficiencies to producers and lower costs to consumers. With the advents of interchangeable parts between 1800 and 1850 in small arms manufacturing (Hounshell, 1984, pp. 3-4), mass production in the early 1900s in automobile manufacturing (Hounshell, 1984, pp. 9-10), and lean production in the early 1950s in automobile manufacturing (Womack, Jones, & Roos, 1990, p. 52), the state of manufacturing has continued to evolve. Each time, the visionaries that catalyzed the transformations were forced to overcome the inertia of the status quo. After convincing stakeholders of the need for change, these change agents:
1. Established a vision for the future
2. Committed resources to attain that vision 3. Studied the root causes for current methods 4. Proposed a new solution
5. Implemented the new solution
6. Quantified the results and sought future improvements
This basic process to implementing change is remarkably simple yet incredibly powerful. By explicitly emphasizing the need for root cause analysis, the process recognizes that imorovements will be transient if the root causes of prior problems are not fully understood and resolved.
When deploying a lean production system, an understanding of lean principles and tools is necessary but therefore not sufficient. Rather, implementing a lean production system should follow:
I. An analysis mapping the root causes of current production methods back to technical issues and the organization's strategic design, culture, and political landscape. Only by fixing the problems that led to the current production system can a lean transformation be sustained.
2. A detailed plan which achieves a transformation in both the organization and the production system.
Thesis Supervisor: Deborah Nightingale
Title: Professor of the Practice, Department of Aeronautics and Astronautics and Engineering Systems Division
Thesis Supervisor: Roy Welsch
Acknowledgements
I would like to thank the Raytheon Company for its interest in the Leaders for Manufacturing
Program at MIT. By crafting a challenging internship and then providing me with the resources to succeed, Raytheon has contributed greatly to my educational experience. A long list of individuals deserve my thanks. A few on this list include: Richard Johnston, Lee Sode, Dennis Coyner, Robert Chatterson, Arlene Simsarian, Steve Dowzicky, Rodney White, and Neil Sweeney. The Production Supervisor and Operators within the circulator area were also instrumental in the project's success, for they are the ones who actually performed the work! Thank you John Kim, Terry Coleman, Pam Graves, and Kathy Arceo for trying something new. Lastly, I owe a great thanks to the engineering staff. By asking challenging questions, they forced me to improve my understanding of the material.
I am also grateful to the directors, staff, faculty, and students of the Leaders for Manufacturing
Program at MIT. I cannot imagine a better place to learn. I can only hope that one day I will give back as much as I have already received.
Lastly, I thank my family for their love and patience. How truly lucky I am for all the opportunities I have been given. I do not thank you often enough.
Table of Contents
1. Introduction... 11
Thesis structure ... 11
2. Product description ... 12
D escription of product flow ... 13
2.1.1 Substrates ... 13
2.1.2 Circulators... 14
2.1.3 Stick A ssem blies... 14
2.1.4 Antenna Arrays ... 14
2.1.5 Antenna System s... 14
3. Problem statement (Burning Platform)... 14
3.1 Technical challenges... 15
3.1.1 M RP ... 15
3.1.2 Effect of reentrant processes, setups, and differing process flows ... 16
3.1.3 H igh m ix, low volum e production ... 17
3.1.4 Grow ing dem and... 17
3.1.5 N ew product developm ent ... 17
3.1.6 Lack of standard w ork ... 18
3.2 Organizational challenges... 18
3.3 H ypothesis... 18
4. Raytheon Six SigmaTm... 19
5. Step I -Visualize...21
Establishing a vision ... 21
6. Step I -Com mit ... 23
7. Step mI - Prioritize ... 24
8. Step IV - Characterize current production m ethods... 25
Analysis of current production m ethods ... 25
8.1 Consistently high quality products are produced... 25
8.2 Engineering staff continuously innovates new and high tech circulators... 26
8.3 Operators enjoy job satisfaction... 26
8.4 Operators seek certifications to operate additional equipment ... 27
8.5 Operators require continuous retraining on equipment ... 27
8.6 Lead tim es are long and not predictable ... 27
8.7 Queue times before test & test analysis dominate lead time ... 29
8.8 H igh W IP levels often exist ... 30
8.9 Production area is often disorganized... 32
8.10 Engineering jobs frequently receive more priority than production jobs ... 32
8.11 The link betw een W IP and lead tim e... 32
9. Step IV - Characterize organization using the Three Lens Model ... 34
9.1 Strategic design lens ... 34
9. 1.1 G rouping and linking ... 34
9.1.2 M etrics and Incentives ... 35
9.2 Cultural lens... 37
9.3 Political lens... 40
Pow er in the Circulator Organization ... 41
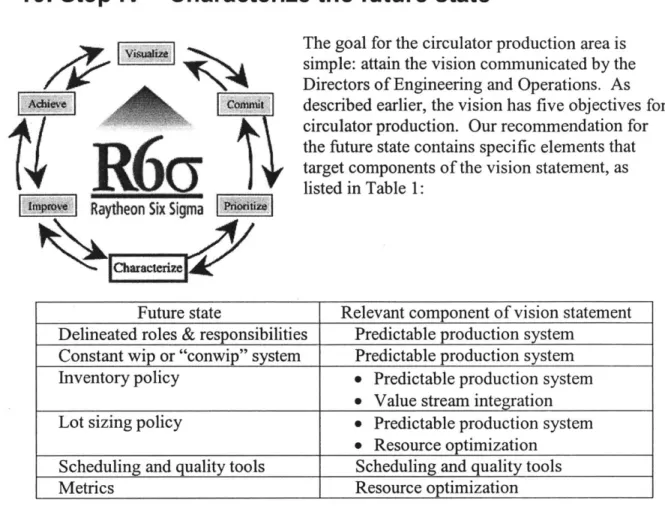
10. Step IV - Characterize the future state ... 42
10.1 Delineated roles & responsibilities ... 42
10.2 Conw ip System ... 43
10.2.1 W IP levels... 43
10.2.2 Conw ip illustration... 44
10.2.3 Cycle tim e consistency ... 45
10.3 Inventory policy ... 47
10.3.1 Continuous Review M odel ... 47
10.3.2 Silver-M eal H euristic... 48
10.4 Lot sizing ... 49
10.4.1 Lot size calculation w ith EOQ ... 50
10.4.2 Lim itation of standard EOQ approach... 51
10.4.3 Lot size calculation w ith Lagrange m ultipliers... 51
10.4.4 Lot size sum m ary... 52
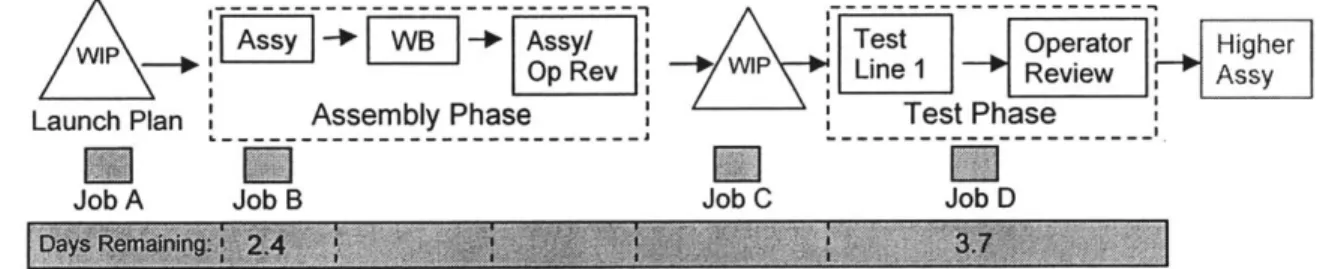
10.5 Launch plan... 52
10.6 M etrics ... 53
11. Step V - Improve... ... ... 56
11.1 Build aw areness of the future state ... 56
11.2 Em pow er individuals ... 56
11.3 Squeeze m ore from existing resources ... 57
11.4 Fix problem s quickly ... 57
11.5 Im plem ent visual tools... 58
11.6 Sustain the gain... 60
12. Step VI- Achieve ... ... 61
12.1 Lead tim e reduction ... 61
12.2 Productivity im provem ents... 61
12.3 Challenges ahead ... 63
12.4 Hypothesis validation... 63
12.5 Recognition of key stakeholders... 64
13. Getting to lean enterprise... 64
13.1 3-D concurrent engineering ... 64
13.2 Enterprise-level m etrics ... 65
13.3 Hum an Resources ... 65
14. Conclusion and next steps... 67
Appendix 1: Derivation of Economic Order Quantity... 68
Appendix 2: Capacity m odel ... 68
Appendix 3: Lot size calculation using Lagrange multipliers ... 71
Acronyms...--...72
Table of Figures
Figure 1: Substrate to Antenna System Product Flow ... 13
Figure 2: Circulator Assembly Steps ... 17
Figure 3: Raytheon Six SigmaTm process ... 20
Figure 4: Circulator WIP ... 28
Figure 5: Queue Times Before Test Dominate Overall Lead Times ... 30
Figure 6: Magnet Inventory ... 31
Figure 7: W affle Pack Storage Area ... 32
Figure 8: WIP and lead time causal loop diagram... 33
Figure 9: Circulator Conwip System ... 44
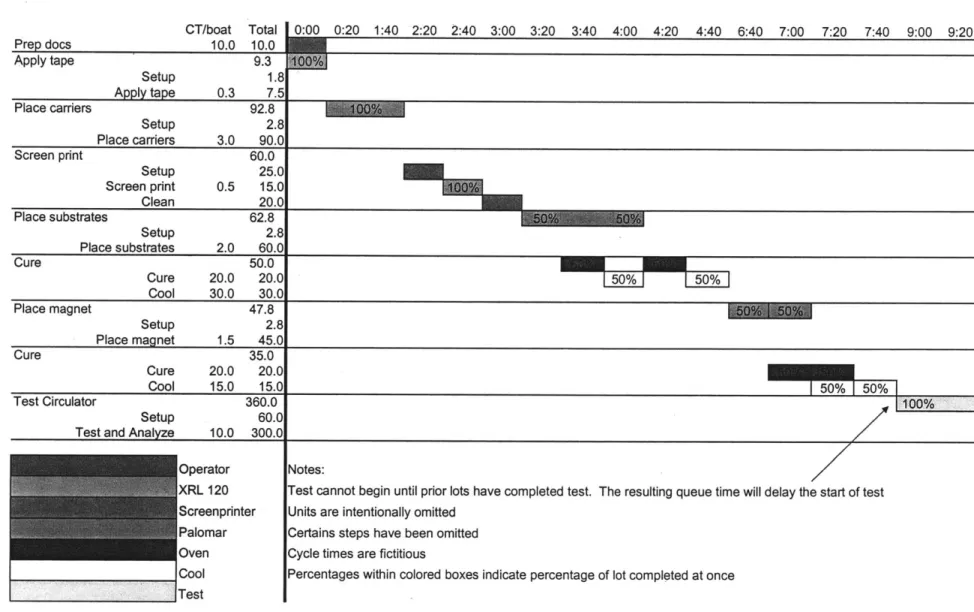
Figure 10: Hypothetical Structured Flow ... 46
Figure 11: Hypothetical Schedule... 53
Figure 12: Oscillations in System State ... 57
Figure 13: Delays cause oscillations... 58
Figure 14: Circulator visual tools ... 59
Figure 15: Expected durations ... 60
Figure 16: Next steps for lean implementation... 67
1. Introduction
Barriers to the flow of information and materials will continue to fall as technology continues to feed the forces of globalization. Organizations that are nimble and efficient will replace those that are plagued with inefficient processes. To remain competitive in the years ahead, organizations must remove the waste that has accumulated in their processes.
Many companies have acknowledged that the principles behind lean manufacturing may hold the key to their survival. In its Production Operations Transition-To-Lean Roadmap, MIT's Lean Aerospace Initiative reduces the process of implementing a lean production system into simple tactical steps grouped into the following eight phases (Crabill, et al., 2000, p. 38).
Phase 0: "Adopt Lean Paradigm" focuses on establishing the needl and commitment for change and communicating a vision
Phase 1: Prepare for the lean transformation. Identify an implementation team, strategy, cultural impediments to lean and metrics to gauge progress
Phase 2: Define the customer and the customer's needs. Establish targets for quality, schedule, and cost
Phase 3: Create a map of the current value stream
Phase 4: Synthesize a production system consistent with the future state. Calculate takt time, create a more suitable physical layout of the facility, implement visual controls, and incorporate preventative maintenance
Phase 5: Implement material flow Phase 6: Implement pull
Phase 7: Continuously improve phases 2 through 6
This thesis contends that transforming an existing production system into a lean
production system requires a commensurate transformation in the organization. Merely acknowledging the need for organizational change is insufficient. Instead, we must map the root causes of the waste within current production methods back to both technical and
organizational issues. By fixing these root causes, the organization can sustain the gains it will achieve through eliminating the waste within its production methods.
Thesis structure
A brief description of this document's chapters may help clarify its layout.
While this lean initiative was focused on radio-frequency (RF) circuits called circulators, Chapter 2 briefly describes both upstream components and downstream assemblies. This product description may help the reader visualize the products.
Chapter 3 starts with a description of the problem. It continues with sections that
describe the technical and organizational challenges that preclude a cookbook application of lean principles. Chapter 3 concludes with the hypothesis statement.
Chapter 4 describes the Raytheon Six Sigmam process. This versatile process is often used to plan and implement change, because it is methodical in its approach to problem solving. It therefore serves as a convenient structure for the development of this thesis. In short, chapters 5 through 12 show the relevance and application of the six sigma approach to lean implementation.
Chapters 5 through 7 describe the first three steps of the Raytheon Six Sigmam process. Even though these chapters are brief, the importance of these steps cannot be
underestimated. Chapter 5 details the first step: "visualize." Chapter 6 describes the second step: "commit." Chapter 7 illustrates the third step: "prioritize."
Chapters 8 through 10 describe the fourth step of Raytheon Six Sigmam: "characterize." Since this step contains the root cause analysis of the status quo and the articulation of a future state, this step has been divided into three chapters. Chapter 8 characterizes production methods through a root cause analysis. Chapter 9 characterizes the
organization using the Three Lens Model. Finally, Chapter 10 characterizes the future state.
Chapter 11 focuses on the fifth step: "improve." This chapter describes the steps required to implement the lean initiative.
Chapter 12 contains the sixth and final step: "achieve." This chapter reviews the project's results, assesses the validity of the hypothesis statement, and emphasizes the importance of recognizing contributors.
Chapter 13 opens the possibility of extending lean principles to the enterprise level. The chapter provides an overview of the benefits and requirements of attaining a lean
enterprise. The chapter also emphasizes that many of the lean tools used on the factory floor are directly applicable to the enterprise level.
Chapter 14 concludes this thesis document with a discussion of next steps.
2. Product description
The Space and Airborne Systems (SAS) business unit of the Raytheon Company designs and produces a variety of products including active array radars for military aircraft. An array is the mechanism through which an antenna system forms transmit and receive beams. With an active array, the radar can electronically steer individual portions of the
array to simultaneously navigate the airplane and track objects.' In some modes, this steering is accomplished automatically. With the previous technology, the radar steered the entire array via a mechanical gimbal. Therefore, pilots could not simultaneously track and navigate with the previous technology.
Since active arrays provide pilots with a new and powerful capability, the military has decided to equip several kinds of aircraft with this new technology. To efficiently meet the growing demand for these arrays, SAS has committed to transforming its production
methods from traditional batch-and-queue to lean.
Production of an antenna system is inherently a complex task involving thousands of parts. Removing waste from all levels of assembly is critical to ensuring that Raytheon can continue to offer technologically superior systems at competitive costs and lead times. Therefore, the company has started with removing waste from several levels of assembly that drive the overall system's cost and schedule. The focus of this lean project is to remove the waste within the production of RF circuits called circulators.
Description of product flow
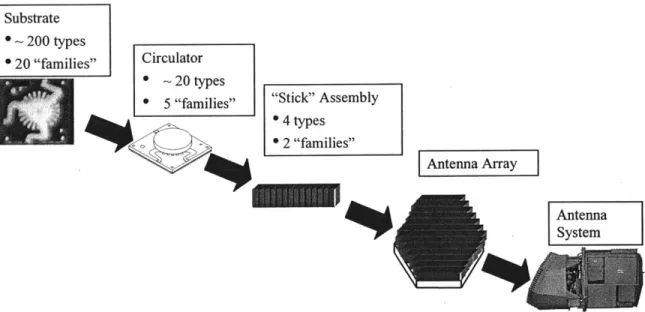
Figure 1 below depicts the product flow, from lower level subassemblies to higher level assemblies. The following sections provide a high level description of these assemblies.
Substrate * 200 types
* 20 "families" Circulator * ~ 20 types
* 5 "families" "Stick" Assembly 4 types
* 2 "families"
Antenna System
Figure 1: Substrate to Antenna System product flow
2.1.1 Substrates
Substrates provide the basic mechanical structure and interconnects for different kinds of RF circuits. Two hundred types of substrates have been produced, and they can be grouped into twenty families based on similarities within production methods. The majority of substrates are produced for microwave integrated circuits (MICs) and other RF assemblies. Only a small fraction of the substrates produced are integrated into circulators and related RF devices like loads, flints, and isolators. Each type of circulator, load, flint, and isolator uses a unique substrate.
2.1.2 Circulators
A circulator allows a single array element to both receive and transmit. When the
antenna system is transmitting, circulators route RF energy from their transmit port to their antenna port. When the antenna system is receiving, circulators route RF energy
from their antenna port to their receive port. By preventing high power RF energy from flowing from their transmit port to their receive port, circulators protect sensitive electronics that are designed for low power signal reception. Twenty different types of circulators have been produced, and they can be grouped into eight families based on
similarities within production methods. Circulators destined for antenna systems are typically higher in performance than those used in other applications. These higher performance circulators are not made for their own profitability but rather for their
importance in the functionality of more profitable antenna systems. Nonetheless, circulators are not commodity components.
2.1.3 Stick Assemblies
Stick assemblies are notionally shown in Figure 1. These assemblies are comprised of structural housings, circulators, other RF elements, and RF interconnects. Antenna arrays differ in size and shape, causing "stick" lengths to vary as well. As a result, the type and number of RF devices within each "stick" vary. This variability presents a challenge for
manufacturing this assembly. Four types of "stick" assemblies exist and can be grouped in two families based on similarities within production methods.
2.1.4 Antenna Arrays
Antenna arrays are the conduit through which the antenna system transmits and receives RF signals. The four types of arrays can be loosely grouped into two families based on similarities within production methods. Each type of antenna array has been designed specifically for its higher level antenna system.
2.1.5 Antenna Systems
An antenna system using active array technology allows a pilot to simultaneously navigate the aircraft and track objects in the air and on the ground. Raytheon
manufactures antenna systems using this technology for four types of military aircraft. These systems operate at different frequencies and differ in form factor. However, at a high level, all have functionally similar components and follow similar assembly and test processes.
3. Problem statement (Burning Platform)
The urgent need for change is often called a "burning platform" at Raytheon. The "burning platform" in circulator production stems from two challenges:
" Demand growth in antenna systems will approximately double the demand for
circulators in one year, with continued growth expected thereafter. Keen on ensuring that resources are efficiently used, senior management will deny requests to double resources to meet a doubling in demand. Thus, production staff must eliminate waste and ensure that existing resources are efficiently used before requesting additional operators and machinery.
" Senior management has mandated a 50% cost reduction for certain programs in
order to meet business objectives. These same business objectives motivate management to seek savings, including in circulator production.
With current production methods, circulator production staff cannot meet the demand growth and cost reduction challenges. Most stakeholders therefore accept the need for change. However, isolating the problems and implementing the appropriate solutions are not trivial. Solving the problem will require overcoming both technical and
organizational challenges.
3.1 Technical challenges
In its future state, the circulator production system must contend with the following technical challenges:
* Use of Material Resource Planning (MRP) software which pushes work-in-progress (WIP) into production
" Production complexities which are created by reentrant processes, setups, and
differing process flows
" High mix, low volume production which complicates scheduling and setups " Growing demand which can shift bottlenecks
" New product development which reduces capacity for production " Lack of standard work which introduces variability
3.1.1 MRP
One technical challenge is reconciling the broader organization's drive to use MRP with the desire to control WIP. MRP authorizes the release of kits into production based on a schedule and not based on the amount of WIP already in the system. WIP levels
3.1.2 Effect of reentrant processes, setups, and differing process
flows
Standard lean theory is remarkably simple. It uses simple U-shaped production cells that build products at the pull of the customer. Production is based around takt time. We divide processes into smaller steps such that the cycle time for each step is less than the takt time. If demand changes, we update the required cycle times to meet the new takt time.
Unfortunately, three factors specific to the circulator manufacturing process preclude the direct application of this simple yet powerful theory: reentrant processes, setups, and variable process flows.
The circulator assembly process currently requires expensive capital equipment to place components and apply epoxy. Since it is not economically viable to purchase a machine for each step, circulators return to the same machine at several points along the assembly process. The result is a reentrant process flow that is also commonplace in
semiconductor manufacturing.
Significant setup- times and setup variability cause lot sizes to be greater than the ideal lot size of one circulator. Clearly, efforts to reduce setup times and reduce the effect of setup variability on circulator performance will enable the use of smaller lot sizes in the future. Each family of circulators has a unique sequence of process steps. Therefore sequential jobs may compete for the same resource because they use resources in different orders. Figure 2 below illustrates:
a. The difference in process flows for two of the eight circulator families
b. The reentrant nature of the circulator assembly process (i.e. a few
machines perform the vast majority of assembly steps). The number within each box indicates the number of times that resource is used when "Family 1" is produced. As we can see, some capital resources are used on four discrete steps. Labor is used in all fifteen steps.
ALL PROGRAMS FAMILY 1 carriers (4) Plces(4 spacers (4) Plaace magnet/spacer---I ALL PROGRAMS Delamninate fixture (1) E dge Seal Review (15) shipment (15)
Figure 2: Circulator assembly steps
3.1.3 High mix, low volume production
Circulator production must also contend with the classical high mix, low volume problem. Presently, lot sizes vary by circulator family from a few hundred to a few thousand
circulators. Demand for a given circulator type may be consistent (e.g. several lots every month), inconsistent (e.g. several lots every few months), or just sporadic. At present, between five and ten lots of circulators are produced monthly, and this volume will more than double in approximately one year.
3.1.4 Growing demand
Because of quickly growing demand, the number of resources required will vary by year. The standard work content and amount of WIP allowable on the floor will vary as
demand varies.
3.1.5 New product development
To develop new circulators and new production processes, design and process engineers require production equipment and operators' time. Scheduling development time in advance is difficult because:
" Software programs can only approximate circulators' performance. Thus, circulators sometimes require iterative design, build, assemble, and test cycles. " It is difficult to estimate the amount of time required to develop a new process to
0 The lead time for circulator components and tooling is sometimes long and
variable.
3.1.6 Lack of standard work
Standard work only exists for some processes. For other processes, cycle times and quality standards can vary significantly. For example, differing definitions of "clean" currently result in a 300% variation in cycle time for a certain manually intensive cleaning operation.
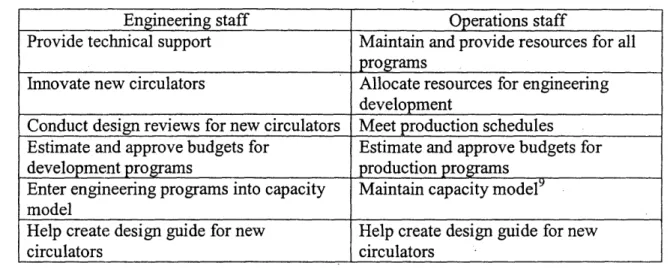
3.2 Organizational challenges
Prior to the lean engagement, a highly technical engineering staff orchestrated the production of circulators and also developed new types of circulators. The engineering staff remains integral to the design of circulators and development of production
processes. This staff also manages the customer relationships. Naturally, they feel great ownership over all aspects of circulator design and production.
The engineering staff also adopted batch and queue production because of its intuitive appeal. Large lot sizes appear to solve the perceived needs to:
* Amortize setups across a larger quantity of circulators
" Reduce the variability in component and epoxy placements
* Increase the up-time of all resources (not just bottleneck resources) The engineering staff is vocally skeptical of lean manufacturing because lean
manufacturing explicitly calls for lot size and WIP reduction. Allowing certain resources
to remain idle is a foreign concept and was not immediately embraced. Since the
engineering staff had met all customer cost and schedule requirements in the past, they remain unconvinced that a sudden emphasis on time-based production is critical.
3.3 Hypothesis
Understanding and addressing these technical and organizational challenges is essential to deploying a lean production system for circulators. While the eight phases of the LAI Production Operations Lean Roadmap contain all of the required lean principles and tools, the roadmap itself does not place sufficient emphasis on the prerequisite organizational change.
A previous student of lean asserted, "the transformation of an enterprise based on
traditional mass production to lean principles and practices requires a major
comprehensive change in behavior throughout the organization" (Tonaszuck, 2000, p. 15). The Lean Aerospace Initiative agrees: "Lean is not merely a set of practices usually found on the factory floor, but rather a fundamental change in how the people within an organization think and what they value, thus transforming how they behave" (Bozdogan et al., 2000, p. 7).
In essence, this thesis combines two existing building blocks:
" The importance of performing a root cause analysis
* The recognition that a lean implementation requires organizational change. In short, an understanding of lean principles and tools is necessary but not sufficient to deploying a lean production system. Rather, implementing a lean production system should follow:
1. An analysis mapping the root causes of current production methods back to
technical issues and the organization's strategic design, culture, and political landscape. Only by fixing the problems that led to the current production system can a lean transformation be sustained.
2. A detailed plan which achieves a transformation in both the organization and the production system.
4. Raytheon Six SigmaTM
We cannot solve our problems with the same thinking we used when we created them.
-Albert Einstein2
The Raytheon Six Sigmam change process serves as a useful tool in structuring the analysis, transforming the organization, and implementing the new production system.
By using this structured process, change agents can be more confident that they will not
omit critical steps.
While originally used as a statistical approach to quality control, the six sigma approach gained momentum when it was applied to general process improvement. The Raytheon Six SigmaTm process was developed from a variety existing corporate programs: the Texas Instruments Continuous Flow Manufacturing program, the Hughes Aircraft Agile program, the Motorola Six Sigma( program, and the General Electric Six Sigma
program. Defined internally as a "knowledge-based process for transforming our culture to maximize customer value and grow our business," (Brassard & Ritter, 2000, p. e) the Raytheon's Six Sigmam process shares many principles with lean manufacturing. For example, its principles are (Brassard & Ritter, 2000, p. e):
* "Specify value in the eyes of the customer"
* "Identify value stream; eliminate waste and variation" * "Make value flow at pull of the customer"
* "Involve, align and empower employees"
* "Continuously improve knowledge in pursuit of perfection"
At least one chapter in this thesis is dedicated to each of the six steps used in the process. These chapters explore the application of six sigma to the circulator lean transformation.
A brief description of each of the steps follows:
Step 1: Visualize the future state and establish a need, or burning platform, for change Step 2: Commit key stakeholders who can enable success
Step 3: Prioritize tasks to ensure the efficient use of resources
Step 4: Characterize the initial state, perform a root cause analysis of desirable and
undesirable effects, and then articulate a future state that incorporates solutions to underlying problems.
Step 5: Improve the system through implementing the proposed solution Step 6: Achieve success and document the benefits realized and lessons learned
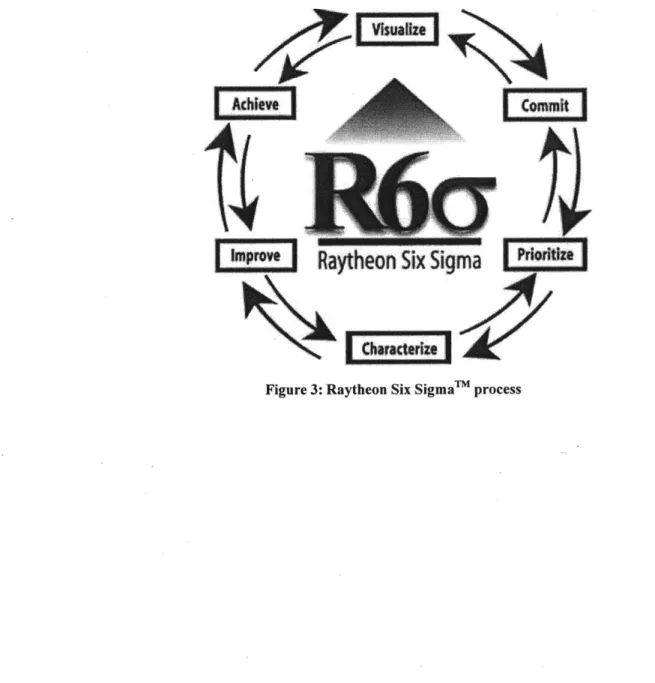
The graphic shown in Figure 3 illustrates the steps and the emphasis on continuous improvement.
Rayhen
x
igma
Figure 3: Raytheon Six Sigma m process
[coma*
5. Step I - Visualize
A rock pile ceases to be a rock pile the moment a single man contemplates it, bearing within him the image of a cathedral.
- Antoine de Saint-Exupery3
x Raytheon Six Sigma
Prior to the lean engagement, SAS evaluated the state of circulator production. Assessors praised the emphasis on quality and the novel use of
existing equipment to meet production demands. However, few lean tools were in place: visual
controls were not posted, value stream mapping was not evident, standard work was not defined, etc. The assessors believed that a concerted lean engagement could help the facility reduce lead times, reduce WIP, and improve productivity. Galvanized by their findings, our team established an initial vision: create a production system that reduces queue times by emphasizing material flow. We created a pilot program for one
circulator program, in which operators focused on only one job. These operators successfully reduced the lead time from 16 manufacturing days to approximately 4 manufacturing days. However, since subsequent builds were not closely monitored, production discipline inexorably eroded. Long and variable lead times returned. High WIP levels returned as well. Some operators and support staff were unsure why change was even necessary. One operator asked, "If it's not broke, why fix it???"
A purely tactical solution may generate short term tangible improvements. However,
these improvements will be temporary, if root causes of problems are not identified and resolved. However, by demonstrating that gains are possible, change agents build
credibility. This credibility becomes important in designing and implementing the longer term solution.
Establishing a vision
"The notion that you can drive change to lean from the bottom is 'pure bunk'," declares one expert who has studied several lean transformations (Liker, 1998). Since a lean deployment requires getting "experts at doing things the old way to do things in a new way, 4" senior leadership must not only display unwavering commitment but also be
willing to consider changes in the organization. Responding to the need for a vision for future circulator production, the Directors of the Engineering and Operations
organization co-authored a vision statement, articulated specific responsibilities for each 3 Source: http://www.brainyguote.com/guotes/uotes/a/antoinedes106018.html accessed on March 14, 2004.
4
Howardell, Doug, Seven Skills People Need to Create a Lean Enterprise, p. 3 available at http://www.edi.gatech.edu/Lean/Lean Articles/leanarticles-sevenskills.cfin
organization, and defined metrics and incentives consistent with long term goals. Their vision statement was crafted to include both strategic elements to provide context and tactical elements to provide direction (Chatterson & Wallace, 2003, p. 3):
"The Circulator Manufacturing Lab will:
" Use a predictable production system based on lean principles
* Use scheduling and quality tools to load and monitor the production system
* Integrate the value stream through synchronizing upstream and downstream production schedules
* Provide capacity for engineering development work during regular business hours
* Optimize resources (e.g. capital, people, floor space, etc.)"
In consultation with key stakeholders, the directors redefined roles and responsibilities for all the people critical to the production area's success. Since people naturally resist change that threatens their power and influence, these new roles were carefully crafted to emphasize the possibility for career growth. The document and related discussion focused on the need for continued collaboration between the Engineering and Operations organizations and stressed that written descriptions were neither limiting nor static. In communicating a vision and altering the organization's structure, the two directors fulfill both halves of Nanus' Leadership Formula (Nanus, 1992, p. 156):
Vision + Communication = Shared Purpose
Equation 1: Nanus' model for shared purpose
Shared Purpose + Empowered People + Appropriate Organizational Changes + Strategic Thinking
= Successful Visionary Leadership Equation 2: Nanus' model for visionary leadership
A vision alone cannot accomplish a goal; instead, the organization must identify and
commit people and resources. The next chapter explores this second step in the six sigma process.
6. Step
11
- Commit
Unless commitment is made; there are only promises and hopes... but no plans.
- Peter F. Drucker5
S Raytheon SiSgma m
am4'Cwueaty I
By committing the existing team of Operations and
Engineering staff to attaining their joint vision, and then equipping that team with the necessary
financial resources, the two Directors maximize the probability of a successful lean deployment. The two Directors themselves demonstrated their willingness to provide guidance and resolve
conflicts by attending critical meetings and offering to help remove obstacles to the lean deployment. The Directors also made funds available to solve problems that might obstruct the lean
implementation. In one instance, the team secured a statistician to study the effects of epoxy variability on circulator performance.
One survey of organizations that successfully implemented lean reveals that "strong leadership and commitment by top management" was "the reason for success" (Tonaszuck, 2000, p. 80). Leadership's active commitment to change is critical to overcoming the inertia associated with the status quo. Without this vocal and continued commitment, key personnel may (Senge et al., 1990, pp. 26-27):
" Perceive that other time commitments will prevent them from implementing the
change. Meeting existing obligations consumes most people's time and prevents them from accepting new work.
* Not ask for help or else be unaware that they need help. One key stakeholder remarked that pushing kits onto the production floor would be a suitable
compromise between lean theory and the real-world necessity to produce finished goods. This person did not realize that he did not understand lean principles! * Not think the change will improve the situation. Several key staff members
believe that reducing lead time and WIP levels will not improve productivity. By contrast, they claim that high WIP levels improve productivity by ensuring that operators always have work to perform.
* Feel that senior management's actions are inconsistent with the proposed changes
By devoting time to the change effort and seeking the advice of experts, management sets
an example for members of the team. Management must also encourage the team to develop a prioritized plan.
7. Step III
-
Prioritize
Not everything that can be counted counts, and not everything that counts can be counted.
- Albert Einstein6
Prioritizin asks is the third step in the Raytheon Six Sigma process, because it helps ensure that committed resources are efficiently used. The
Lce
prioritized tasks of this lean engagement are:[
Documenting needs and perceptions through interviewing stakeholders ranging from Directors to design engineers to hourly[
sI Raytheon Sbx Sigma Priauthe operators. The data from the interviews
become some of the clues necessary to decipher the origins of the current production system.
Understanding the current production system through measuring actual process times and creating value stream maps.
" Building awareness of lean principles and clarifying misconceptions through
conversations, simple visual tools, and practice.
* Establishing institutional support for the change by enlisting the active support of the leaders of the Engineering and Operations organizations.
* Creating a circulator production system based on the value stream maps and the vision established by leadership.
* Creating visual controls and a tool for scheduling jobs to aid in the implementation of the circulator production system.
Armed with this basic plan, the team can now begin its analysis.
8. Step IV - Characterize current production methods
Inside every small problem is a large problem struggling to get out.
- The Second Law of Blissful Ignorance7
Rayteon Six Sigma |n"
Chmcteriwe
Understanding the status quo, analyzing the problem, and articulating a solution is the fourth
step in the Raytheon Six Sigma"m process.
Observations of the production area and interviews with stakeholders not only provide an accurate description of current production methods but also provide clues that help uncover root causes for current production methods. Clearly, the future state should retain the positive parts while fixing the negative parts of the current state. Therefore, understanding both the technical and the
organizational root causes of the current state is essential to proposing a viable future state.
This chapter contains the analysis of current production methods. Chapter 9 extends the root cause analysis to the broader organization. Finally, chapter 10 illustrates the proposal for the future state.
Analysis of current production methods
The Toyota Production System holds root cause analysis as a central tenet. Through the "five why" process, employees identify underlying problems and therefore prevent similar problems for recurring (Womack & Jones, 2003, p. 348). This thesis adopts that basic philosophy to uncover root causes for both positive and negative elements of current production methods.
Each of the following subsections isolates a characteristic of the status quo and attempts to uncover its root cause(s). After each root cause, we prescribe an action item, if
required. The description of the future state in Chapter 10 incorporates all of these action items into one coherent system.
8.1 Consistently high quality products are produced
Root cause 1: Initial production methods focus mainly on quality and eliminating variability. Frequent operator reviews in the assembly process, a heavy reliance on automation, component screening on certain programs, and large lot sizes combine to minimize variability in the location of components as well as the thickness and location of epoxy. (Large lot 7 Source: http://www.basicguotations.com/index.php?cid=221 accessed on March 14, 2004
Action item:
Root cause 2: Action item:
sizes minimize the number of setups and therefore minimize setup-induced variability.) As a result, an average of 95.4% of all circulators started on one high volume program pass final inspection. Customers rarely complain about quality problems.
The production system should continue its focus on quality and use automation where required. Through a carefully designed and statistically based "design of experiment" or DOE, the team should study how variability in epoxy locations and thickness affect circulator performance. Where variability induced by setups is found to degrade performance, the team should study methods to further standardize setups. The final goal is a production process that is insensitive to setups and therefore amenable to economic order quantity-based lot sizes. Subsequent DOEs which study the effect of variability in circulator components on the performance of antenna arrays may be useful in eliminating the costly practice of component screening.
Engineering and operator pride drives the desire to ensure that customers remain satisfied.
Retain pride in shipping quality products. Pride remains a core component of the future state.
8.2
Engineering staff continuously
innovates new and high tech
circulators
Root cause:
Action item:
Because circulators manufactured at Raytheon have developed a reputation for being high performance, design engineers continue to receive requests for new types of circulators to meet challenging requirements. Design engineers have the desire and mandate to fulfill these requests. By controlling the circulator production schedule, design engineers can use the necessary resources (equipment and operators) to complete development work.
The production schedule should allot a specific amount of time each period to accommodate engineering development work
8.3 Operators enjoy job satisfaction
Root cause 1:Action item:
Root cause 2: Action item:
Operators enjoy the flexibility of working in pairs or else alone Operators should retain some flexibility but should be responsible for completing jobs within a specified time
Operators enjoy process steps that involve machines more than they enjoy manual steps like cleaning and inspection
By becoming responsible for starting and completing a job, all operators
8.4 Operators seek certifications to operate additional
equipment
Root cause 1: Action item: Root cause 2: Action item:Operators typically enjoy operating machines
Operators should be trained on all the operations required to start and finish a job.
Operators' promotions are partly based on the number of certifications they receive
Operators should continue gaining certifications for machines they need to assemble and test circulators. By making operators responsible for completing jobs, operators will actually use their training.
8.5 Operators require continuous retraining on equipment
Root cause:Action item:
Operators spend most of their time performing only a few tasks and therefore forget how to use other equipment
By accepting responsibility for starting and completing jobs, operators
should perform a variety of tasks and therefore frequently use all necessary equipment
8.6 Lead times are long and not predictable
Root cause 1:Action item:
Root cause 2: Action item:
Root cause 3:
Long queue times extend overall lead times. For example, for one high quantity program, queue times represent 80% of lead times and lead times vary as much as 600%.
By enforcing a first-in-first-out (FIFO) discipline and limiting WIP, the
future system should limit queue times. While FIFO may appear to reduce flexibility, it actually helps make lead times more predictable. Jobs that require high priority can be prioritized in the launch plan.
Short lead times will ensure that these "rush" jobs are started and completed quickly. Thus, FIFO can actually facilitate overall system flexibility.
Jobs with "high priority" supercede jobs with lower priority.
The future system should incorporate a FIFO discipline to ensure that jobs are completed in the order they are started. Jobs with "high priority" should be placed in the same schedule as other jobs.
Because of high circulator WIP levels, different jobs vie for the same resources. The result is long queue times (and therefore long lead times). Figure 4 below shows a typical amount of WIP during a busy period.
Action item: Root cause 4: Action item: Root cause 5: Action item: Root cause 6: Action item:
By controlling the amount of authorized WIP, the future system should
limit queue times and therefore lead times.
Because of high WIP levels, operators can switch between jobs when problems occur. The resulting lack of urgency to prevent problems (e.g. material shortages and machine failures) allows problems to recur. Unfortunately, bottleneck resources can sit idle for days because operators can perform other tasks. In short, by keeping everyone busy, the current production system creates the semblance of progress.
With limits on the amount of authorized WIP, production problems that stop work should become more visible. By attracting prompt attention to problems, the future system should ensure that problems are resolved and not deferred.
The engineering culture at Raytheon emphasizes performance and not the value of time.
The importance of time should be stressed to all stakeholders.
Operations personnel should perform all critical functions (like test) for all production-ready programs. Operations staff should therefore have control over maintaining this time-based production system
Since the expected duration of each process is not understood, operators cannot evaluate their performance against a standard.
Value stream maps for each circulator family should contain cycle times for each process. Each job should carry a placard clearly delineating these expected cycle times. After these expected cycle times are
established, the Operations Manager should check whether operators can consistently meet these expected cycle times. If they cannot, then the process itself may not be robust. Alternatively, the operators may require further training.
Root cause 7: Support staff is overworked, preventing them from promptly resolving production problems.
Action item: Management should prioritize the responsibilities of key staff members to ensure they have sufficient time to promptly resolve production problems.
The circulator manufacturing area is not the only manufacturer that suffers from long queue times! One study defines flow efficiency as the ratio of fabrication time to total
lead time (Shields, 1996, p. 2). The report states that the flow efficiency for airframe manufacturers ranges from 0.02% -0.8%, the flow efficiency for electronics
manufacturers ranges from 0.02% - 18.7%, and the flow efficiency for engine
manufacturers ranges from 0.7% - 13% (Shields, 1996, p. 64). The flow efficiency for
one circulator program before the lean engagement was approximately 6%.
8.7 Queue times before test & test analysis dominate lead time
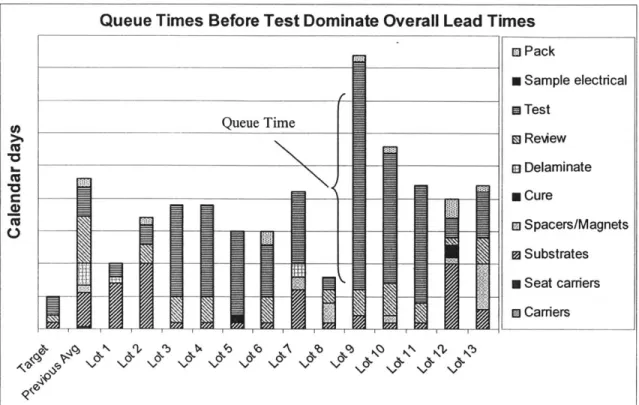
Figure 5 below shows the duration of each major step in the circulator assembly and test process for one type of circulator. The bar entitled 'target' shows the theoretical lead time for one lot, assuming that operators and equipment are available when needed. The bar entitled 'previous average' shows the average lead time over 16 lots prior to June2003. Each major process step is delineated by a color. The height of each colored
segment within each bar equals the average queue time plus the average cycle time for that process. When multiple processes are started and completed on a given day, only the
last process appears on the chart.
'Lot 1,' marks the initiation of a pilot program to promote material flow by reducing queue times. Operators were shown how to process certain steps in parallel in order to reduce queue times. (For instance, while the first half of a lot was in one process, the second half of a lot was in the subsequent process) The results were dramatic for Lot
1-13, because operators completed more work each day than previously, as evidenced by
the reduction in the number of colored segments within each bar. However, the pilot failed to reduce both the magnitude of and variability in the queue times before test.
7
7
Figure 5: Queue times before test dominate overall lead times
Root cause 1: Action item:
Root cause 2: Action item:
By controlling the test function, engineers retain control over which
products ship to customers. Thus, they control the production system. Test personnel from the Operations organization should be trained to perform the test function for all "production-ready" jobs, shifting control over test (and thus over system throughput) to the Operations
organization.
No accountability exists to complete jobs within a specified lead time Each job should carry a placard clearly explaining the expected cycle time of each task.
8.8 High WIP levels often exist
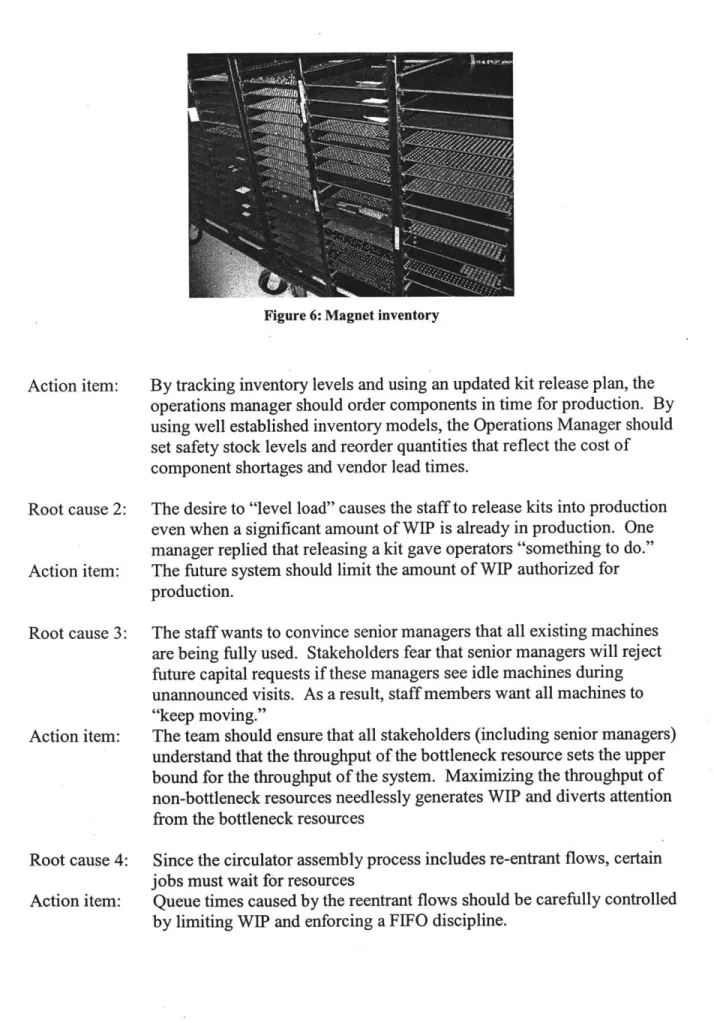
Root cause 1: The presence of circulator WIP and component WIP is deemed acceptable. As a result of variability in lead times and fixed ordering costs, one stakeholder declared that "a stockpile of parts" is necessary. This general acceptance of WIP has caused the production area to house thousands of circulator components. For example, approximately
$70,000 of magnets awaits use, as shown in Figure 6 below.
Queue Times Before Test Dominate Overall Lead Times o Pack * Sample electrical a Test Queue Time EsReview g Delaminate U Cure a Spacers/Magnets m Substrates n Seat carriers a Carriers
4:
o(
5
Figure 6: Magnet inventory Action item: Root cause 2: Action item: Root cause 3: Action item: Root cause 4: Action item:
By tracking inventory levels and using an updated kit release plan, the
operations manager should order components in time for production. By using well established inventory models, the Operations Manager should set safety stock levels and reorder quantities that reflect the cost of component shortages and vendor lead times.
The desire to "level load" causes the staff to release kits into production even when a significant amount of WIP is already in production. One manager replied that releasing a kit gave operators "something to do."
The future system should limit the amount of WIP authorized for production.
The staff wants to convince senior managers that all existing machines are being fully used. Stakeholders fear that senior managers will reject future capital requests if these managers see idle machines during unannounced visits. As a result, staff members want all machines to "keep moving."
The team should ensure that all stakeholders (including senior managers) understand that the throughput of the bottleneck resource sets the upper bound for the throughput of the system. Maximizing the throughput of non-bottleneck resources needlessly generates WIP and diverts attention from the bottleneck resources
Since the circulator assembly process includes re-entrant flows, certain jobs must wait for resources
Queue times caused by the reentrant flows should be carefully controlled
8.9 Production area is often disorganized
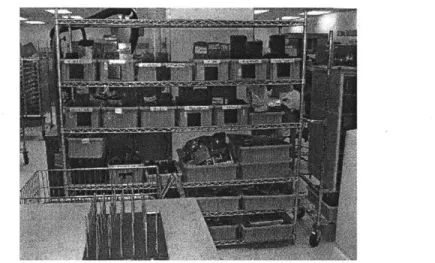
While operators make earnest attempts to reduce the clutter within the production area, the lack of inventory control makes their jobs difficult. Figure 7 below shows the area used to store the shipping containers for circulators, known as waffle packs.
Figure 7: Waffle pack storage area
Root cause 1:
Action item:
Root cause 2: Action item:
Production area is treated as an "engineering lab" therefore eliminating the perceived need to adopt production disciplines
The Operations manager should possess the authority to impose the discipline required in a production setting
Because of high WIP levels, operators are sometimes unsure which jobs require their immediate intention
The production system, loaded by a published kit release plan and operating under a FIFO philosophy, should ensure that operators understand which jobs require their attention.
8.10 Engineering jobs frequently receive more priority than
production
jobs
Root cause:
Action item:
Engineering stakeholders seem to prefer spending time on engineering jobs. One possible explanation is that validating designs is more
intellectually stimulating process than processing routine jobs.
All jobs should be processed on a first-in-first-out basis
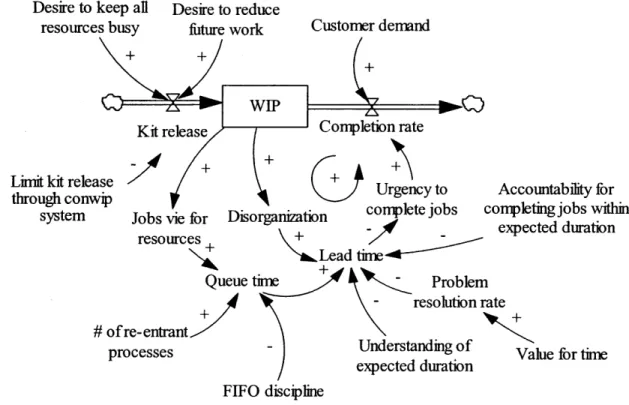
8.11 The link between WIP and lead time
Long lead times and high WIP levels are related. When a production system has constrained capacity, an increase in WIP levels increases queue times. Increased queue
times in turn increases lead times. When people begin to mentally accept long lead times, they lose the feeling of urgency to complete jobs. Job completion rates therefore fall, leading to even higher WIP levels. The causal-loop diagram shown in Figure 8 shows this vicious cycle denoted by the "+" sign in the counterclockwise loop. WIP will continue to grow until people's value for time increases, people understand expected durations, and FIFO discipline is enforced. The diagram also explores the effects of other variables like re-entrant processes, accountability, and disorganization on WIP and lead time. Arrows with positive signs indicate that an increase in the preceding variable causes an increase in the subsequent variable, and vice versa.
Desire to keep all resources busy
Desire to reduce
fiture work Customer demand
WIP
Kit release Comipletion rate
oase Urgency to
Jobs vie for Disorganization complete jobs
resources +
Lead time
Queue time Problem
- resolutionr
# of re-entrant
proeses nt - Understanding of
processes expected duration
FIFO discipline
Accountability for completing jobs within
expected duration
ate
Value for time
Figure 8: WIP and lead time causal loop diagram
By providing insights into how people's behaviors affect lead time and WIP, Figure 8
reveals the changes necessary for the new system to successfully lower both WIP levels and lead times. For example, by increasing the FIFO discipline, we reduce queue times.
A reduction in queue times reduces expected lead times. When jobs are quoted to
customers with shorter lead times, production staff naturally feels greater urgency to complete jobs. Job completion rates will increase as a result, leading to a reduction in
WIP.
While the majority of the root causes discussed have technical solutions, some reveal deeper organizational implications. For example, engineering pride in the product's technical excellence is evidence that the broader organization values performance; solutions which are perceived to jeopardize performance will be universally rejected. The tendency for operators to answer the phone using the words "engineering lab," is an indication of the ingrained culture. Therefore, understanding the organization is critical to implementing change. It is not novel to claim that the root causes for successes and
Limit kit rele through co
failures lay within the organization. In fact, the report published by the space shuttle Columbia's accident investigation board concludes:
When causal chains are limited to technical flaws and individual failures, the ensuing responses aimed at preventing a similar event in the future are equally limited... Such corrections lead to a misguided and potentially disastrous belief that the underlying problem has been solved" (Gehman et al, 2003, p.177).
9. Step IV - Characterize organization using the Three
Lens Model
Acb.~veConmi
LL"iPiI
Raytheon Six Sigma i J9aateide
9.1 Strategic design lens
The Three Lens Model is useful in understanding the current organization's behavior and in creating
an effective strategy for change management (Ancona et al, 1999). The model's creators submit that different forces drive people's behavior. These
forces are most clearly seen using the strategic design lens, cultural lens, and political lens. The model's basic premise is that "...an analysis that considers and combines all three lenses is more likely to reveal the complex interdependencies of the organization, the difficulties of implementing change, and the heterogeneity among individuals and groups" (Carroll, 2001, p. 10)
The strategic design lens uses a logical approach to understanding organizations. It assumes that individuals are rational and that organizations can be structured to achieve a goal. Using this lens, we study how people are grouped together to accomplish related tasks, how these groups are linked through both formal mechanisms (e.g. liaison and cross-functional teams) and informal mechanisms (e.g. networks of personal
relationships), and finally how people's efforts are aligned with the goals of an organization through performance-based rewards and peer recognition.
9.1.1 Grouping and linking
The Engineering and Operations organizations report to separate vice presidents within Space and Airborne Systems. The Engineering organization has been designed with the explicit intent of inventing new products to meet current and future needs. In this matrix organization, highly talented engineers are grouped by specialty and then assigned by their line managers to specific programs. Some senior engineers who are also program-oriented lead research activities consistent with the strategic business needs identified in Raytheon's technology roadmaps.
Meanwhile, the charter of the Operations organization is providing customers with products that fulfill the technical, cost, quality, and schedule requirements. The vice president of Operations for Space and Airborne Systems stated, "We win business through technological excellence.. .we keep business through operational excellence." (on 12/9/03) Clearly, Raytheon seeks to develop its Operations organization into another source of competitive advantage.
The third major functional group within SAS is program management. Often staffed by the Engineering Organization, program management serves as the customer interface. Program managers are therefore often technical people with interests in management. Solid State Microwave (SSM) is the specific organization within SAS that produces substrates, circulators, and microwave integrated circuits (MICs). At present, SSM is grouped by function as well as by product and process. Two examples of functional groups are the process engineering group and operator staff. On a given program, process engineers will make designs more producible, program equipment, train operators, aid the transition to manufacturing, and support continuous improvement. Meanwhile, operators will perform the actual value-added assembly functions for products. Thus different functional groups are linked together to form a broad team for each program.
Since the majority of operators within SSM build MICs, MICs gain much of SSM management's attention. Thus, a supervisor exists for each group of 10-15 MIC operators who perform similar functions. However, since the circulator organization is small, no formal reporting structure within the circulator organization exists. Thus, operators report administratively to a MIC supervisors even though MIC supervisors have little expertise in circulators. The circulators receive daily work instructions from the engineering and process engineering staff. While this dual structure is a natural result of the circulator organization's small size, it unfortunately does not always ensure that operators' concerns are adequately resolved. For example, one operator voiced her frustration that she could not rely upon management to aid in her professional development. She felt that no one had her interests at heart.
9.1.2 Metrics and Incentives
Raytheon recognizes that metrics and incentives align people's interests to overall business goals. An internal Raytheon website states, "The Performance Development process guides the alignment of goals throughout the organization, and facilitates the achievement of meaningful objectives...." Business leaders "ensure they are setting program, department, team, and individual objectives that align with and contribute towards the achievement of corporate and business goals.8" Once department goals are
established, line managers and their employees together identify goals (or metrics) against which employees are measured. Managers and employees then meet periodically
to assess personal contributions and identify areas for improvement. Employees are typically rewarded for their performance by:
* Merit raises
* Monetary achievement awards for major accomplishments * Profit sharing if the business meets its goals
* Spot awards for meeting customer commitments or increasing customer satisfaction.
Senior employees are also eligible for the "Results Based Initiative," in which they are monetarily rewarded for documented personal contributions that helped the business meet its goals.
Within the Solid State Microwave organization specifically, some groups enjoy the benefits of strong links between goals, metrics, and incentives, while other groups must improve these links. Process engineers, for instance, enjoy a strong link between goals and metrics. Improving process robustness is a high level department goal, and process engineers are measured by their ability to improve yields and reduce lead times. While financial incentives exist to reward contributions, non-financial incentives exist as well. For example, peer pressure to publish noteworthy accomplishments in a monthly newsletter encourages process engineers to remain productive.
Managers of operators review the performance of individual operators against department goals. Since management's focus traditionally centers on MICs, established metrics for RF performance and quality standards exist for MICs. Through consistently producing quality work and participating in dedicated training, operators can also gain the title of Certified Operator. Certified Operators can inspect their own work. Managers also use -additional incentives like merit awards, individual and team "spot light on performance" awards, and commendations during all-hands meetings to reward exceptional
contributions. Many operators actively pursue training on different machines because certifications on multiple processes are needed for promotions. In short, the link between performance and rewards is fairly transparent for MIC operators.
By contrast, the link between performance and rewards is more subjective for circulator
operators. Without quantifiable metrics (like lead time or first pass quality) to
continuously gauge their performance, circulator operators do not benefit from immediate feedback. While managers can reward operators with merit awards, their inability to tie an award to a visible metric diminishes the award's long term value. Without data, managers are also forced to base promotions on seniority, certifications on machines, reputation, and qualitative assessments.
When designing incentives to link groups, managers face a difficult problem. While managers can quantify some of the factors that will improve the business' performance, managers must be cautious in creating incentives. For example, cross-trained employees generally increase the flexibility of a workforce, allowing managers to deploy operators in response to shifts in the bottleneck. By alleviating bottlenecks, managers can increase throughput and therefore revenue. In an attempt to encourage cross training,