Direct and adaptive quantification schemes for extreme event
statistics in complex dynamical systems
by
Mustafa A. Mohamad
B.S., University of Illinois at Urbana-Champaign (2012) S.M., Massachusetts Institute of Technology (2015) Submitted to the Department of Mechanical Engineering in partial fulfillment of the requirements for the degree of Doctor of Philosophy in Mechanical Engineering and Computation
at the
MASSACHUSETTS INSTITUTE OF TECHNOLOGY September 2017
Massachusetts Institute of Technology 2017. All rights reserved.
Signature redacted
A uthor ... ...
Department of Mechanical Engineering August 15, 2017 Certified by ... Accepted by ... Accepted by ... M
0U
MASSACHU~t~f IlTTE OF TECHNOLOGYS[P 22RE
-Signature
redacted
/l/
o----M--eistoklis P. Sapsis Associate Professor of Mechanical and Ocean Engineering Thesis SupervisorSignature redacted
s a iconstantinou Professor o Mechanical Engineering Co-Director, Computational cience and Engineering
Signature redacted
Rohan Abeyaratne Professor of Mechanics Chairman, Department Committee on Graduate ThesesDirect and adaptive quantification schemes for extreme event statistics in complex dynamical systems
by
Mustafa A. Mohamad
Submitted to the Department of Mechanical Engineering on August 15, 2017, in partial fulfillment of the
requirements for the degree of
Doctor of Philosophy in Mechanical Engineering and Computation
Abstract
Quantifying extreme events is a central issue for many technological processes and natural phe-nomena. As extreme events, we consider transient responses that push the system away from its statistical steady state and that correspond to large excursions. Complex systems exhibiting extreme events include dynamical systems found in nature, such as the occurrence of anomalous weather and climate events, turbulence, formation of freak waves in the ocean and optics, and dynamical systems in engineering applications, including mechanical components under environ-mental loads, ship rolling and capsizing, critical events in power grids, as well as chemical reactions and conformational changes in molecules. It has been recognized that extreme events occur more frequently than Gaussian statistics suggest and thus occur often enough that they have practical consequences, and sometimes catastrophic outcomes, that are important to understand and pre-dict. A hallmark characteristic of extreme events in complex dynamical systems is non-Gaussian statistics (e.g. heavy-tails) in the probability density function (pdf) describing the response of their observables. For engineers and applied mathematicians, a central issue is how to efficiently and accurately describe this non-Gaussian behavior. For random dynamical systems with inherently nonlinear dynamics, expressed through intermittent events, nonlinear energy transfers, broad en-ergy spectra, and large intrinsic dimensionality, it is largely the case that we are limited to (direct) Monte-Carlo sampling, which is too expensive to apply in real-world applications.
To address these challenges, we present both direct and adaptive (sampling based) strategies designed to quantify the probabilistic aspects of extreme events in complex dynamical systems, effectively and efficiently. Specifically, we first develop a direct quantification framework that in-volves a probabilistic decomposition that separately considers intermittent, extreme events from the background stochastic attractor of the dynamical system. This decomposition requires knowledge of the dynamical mechanisms that are responsible for extreme events and partitions the phase space accordingly. We then apply different uncertainty quantification schemes to the two decomposed dynamical regimes: the background attractor and the intermittent, extreme-event component. The background component, describing the 'core' of the pdf, although potentially very high-dimensional, can be efficiently described by uncertainty quantification schemes that resolve low-order statistics. On the other hand, the intermittent component, related to the tails, can be described in terms of a low-dimensional representation by a small number of modes through a reduced order model of the extreme events. The probabilistic information from these two regimes is then synthesized accord-ing to a total probability law argument, to effectively approximate the heavy-tailed, non-Gaussian probability distribution function for quantities of interest. The method is demonstrated through numerous applications and examples, including the analytical and semi-analytical quantification of the heavy-tailed statistics in mechanical systems under random impulsive excitations (modeling slamming events in high speed craft motion), oscillators undergoing transient parametric
reso-nances and instabilities (modeling ship rolling in irregular seas and beam bending), and extreme events in nonlinear Schr6dinger based equations (modeling rogue waves in the deep ocean). The proposed algorithm is shown to accurately describe tail statistics in all of these examples and is
demonstrated to be many orders of magnitude faster than direct Monte-Carlo simulations. The second part of this thesis involves the development of adaptive, sampling based strategies that aim to accurately estimate the probability distribution and extreme response statistics of a scalar observable, or quantity of interest, through a minimum number of experiments (numerical simulations). These schemes do not require specialized knowledge of the dynamics, nor understand-ing of the mechanism that cause or trigger extreme responses. For numerous complex systems it may not be possible or very challenging to analyze and quantify conditions that lead to extreme responses or even to obtain an accurate description of the dynamics of all the processes that are significant. To address this important class of problems, we develop a sequential algorithm that provides the next-best design point (set of experimental parameters) that leads to the largest re-duction in the error of the probability density function estimate for the scalar quantity of interest when the adaptively predicted design point is evaluated. The proposed algorithm utilizes Gaussian process regression to infer dynamical properties of the quantity of interest, which is then used to estimate the desired pdf along with uncertainty bounds. We iteratively determine new design points through an optimization procedure that finds the optimal point in parameter space that maximally reduces uncertainty between the estimated bounds of the posterior pdf estimate of the observable. We provide theorems that guarantee convergence of the algorithm and analyze its asymptotic behavior.
The adaptive sampling method is illustrated to an example in ocean engineering. We apply the algorithm to estimate the non-Gaussian statistics describing the loads on an offshore platform in irregular seas. The response of the platform is quantified through three-dimensional smoothed particle hydrodynamics simulations. Because of the extreme computational cost of these numerical models, quantification of the extreme event statistics for such systems has been a formidable chal-lenge. We demonstrate that the adaptive algorithm accurately quantifies the extreme event statistics of the loads on the structure through a small number of numerical experiments, showcasing that the proposed algorithm can realistically account for extreme events in the design and optimization processes for large-scale engineering systems.
Thesis Supervisor: Themistoklis P. Sapsis
Acknowledgments
I greatly thank my advisor, Prof. Themistoklis Sapsis, for his guidance, encouragement, and men-torship. I could not have asked for a better role model for these last four years. I have learned a tremendous amount from his supervision and this thesis would not have happened without his support. I also deeply thank my committee members, Prof. Anthony Patera and Prof. Youssef Marzouk, for providing invaluable feedback throughout these years and taking time to participate in my research. I am very fortunate to have them serve on my committee.
In addition, I thank the graduate officer, Prof. Rohan Abeyaratne, for promptly and efficiently assisting me with various aspects of the graduate process. A special thanks to Barbara Smith for her gracious help in taking care of all my administrative related tasks (from travel expenses,to ordering lab equipment and supplies, and booking rooms for meetings) and to Leslie Regan, Joan Kravit, and Una Sheehan, also for their prompt administrative assistance.
I would like to thank my fellow lab members, Han Kyul Joo, Saviz Mowlavi, Zhong Yi Wan, Jocyln Kluger, Will Cousins, Hessam Babaee, and Mohammad Farazmand. I was fortunate enough
to collaborate with Will Cousins and Han Kyul Joo. The experience was especially enjoyable, fun, and rewarding. Han Kyul and I spent many hours discussing miscellaneous problems in probability and stochastics. Will Cousins mentored me on various aspects of water waves. I thank Alex Crespo for helpful comments related to the smoothed particle hydrodynamic numerical simulations. I also thank all my friends that I have made at MIT and Cambridge, you know who are you: you have made these last four years a very enjoyable and memorable time in my life. A special and warm thanks to my parents and sisters for their unconditional support and encouragement throughout the years; I owe them an immense debt of gratitude for more things than I can mention.
Lastly, this thesis would not have happened were it not for the various funding agencies that have supported this work. I would like to acknowledge and greatly thank the Naval Engineering Education Center (NEEC), the Office of Naval Research (ONR), the Air Force Office of Scientific Research (AFOSR), and the Army Research Office (ARO) for supporting this research through
various grants. I thank the American Bureau of Shipping (ABS) for gracious support through a fellowship and also support from the Pappalardo fellowship through MIT. Also, I thank the Martin A. Abkowitz fund for a travel award and the Society of Naval Architects and Marine Engineers (SNAME) travel award from the department mechanical engineering at MIT. I have very much appreciated the opportunity to attend conferences and meetings made possible by these awards, which have been an important part of my graduate career.
Contents
1
Introduction1.1 Contributions . . . . 1.1.1 Direct extreme event quantification . . 1.1.2 Adaptive extreme event quantification 1.2 Organization . . . .
2 Background
2.1 Overview . . . . 2.2 Review of select quantification strategies . . 2.2.1 Extreme value theory . . . . 2.2.2 Large deviations theory . . . . 2.2.3 The Fokker-Planck equation . . . .
3 Direct quantification method for extreme events
3.1 Problem formulation . . . . 3.2 Probabilistic decomposition-synthesis framework . . . .
3.2.1 Regime decomposition and method assumptions ... 3.2.2 Analysis of the various regimes . . . . 3.2.3 Probabilistic synthesis . . . . 3.3 Description of the analysis steps . . . . 3.3.1 Order reduction of the rare event dynamics . . . . 3.3.2 Quantification of the instability region . . . . 3.3.3 Description of the background dynamics . . . . 3.3.4 Probability of rare events . . . . 3.4 Extreme events in intermittently forced vibrational systems 3.5 Overview of the direct extreme event quantification method
3 6 6 7 8 11 11 15 15 17 19 23 . . . . 23 . . . . 24 . . . . 24 . . . . 26 . . . . 27 . . . . 28 . . . . 29 . . . . 31 . . . . 32 . . . . 34 . . . . 34 38
3.6 Limitations and applicability of the quantification framework . . . .3
4 Quantification of extreme events in mechanical systems 4.1 Vibrational systems under intermittent forcing . . . . 4.1.1 Problem formulation for linear SDOF systems . . . . 4.1.2 Analytical pdf for SDOF systems for special cases . . . . 4.1.3 Semi-analytical response pdf for SDOF systems . . . . . 4.1.4 Semi-analytical response pdf for MDOF systems . . . . . 4.1.5 Semi-analytical pdf of the local extrema . . . . 4.1.6 Extensions to nonlinear vibrational systems . . . . 4.2 Mathieu's equation under stochastic parametric excitation . . 4.2.1 Ship roll motion in irregular seas . . . . 4.2.2 Formulation of the roll response dynamics . . . . 4.2.3 Derivation of the slow dynamics . . . . 4.2.4 The probability distribution for the response . . . . 4.2.5 Comparisons with Monte-Carlo simulations . . . . 4.3 Nonlinear system of coupled oscillators . . . . 4.3.1 Decomposition and the instability region . . . . 4.3.2 Conditional statistics of rare events . . . . 4.3.3 Conditional statistics of background dynamics . . . . 4.3.4 Probability for rare events . . . . 4.3.5 Synthesis and comparison to Monte-Carlo simulations 5 Quantification of extreme events in nonlinear water waves 5.1 Unidirectional nonlinear water waves . . . . 5.1.1 'Ihe modified nonlinear Schr6dinger equation . . . . 5.2 Statistical distribution of the local maxima . . . . 5.3 Extreme event subspace and the instability regime . . . . 5.4 Conditional statistics of extreme events . . . . 5.5 Conditional statistics of the background dynamics . . . . 5.6 Probability of extreme wave events . . . . 5.7 Synthesis and comparison to Monte-Carlo simulations . . . . 5.8 Response of prototype ocean structures to nonlinear waves . . 43 . . . . 44 . . . . 44 . . . . 46 . . . . 54 . . . . 57 . . . . 59 . . . . 61 . . . . 66 . . . . 67 . . . . 69 . . . . 71 . . . . 73 . . . . 78 . . . . 80 . . . . 82 . . . . 83 . . . . 84 . . . . 85 . . . . 87 91 91 93 95 96 99 100 102 102 103 39
6 Adaptive quantification method for extreme events
6.1 Problem overview . . . . 6.2 Method formulation . . . . 6.3 Basic properties of Gaussian process regression . . . . 6.4 Algorithm description . . . . 6.5 Convergence and asymptotic behavior . . . . 6.5.1 Asymptotic behavior of the optimization criterion . . . . 6.6 Example to a nonlinear oscillator under stochastic excitation . 6.6.1 Results and comparisons . . . .
7 Extreme event statistics in wave-body interactions problems 7.1 Problem overview . . . . 7.2 Description of the numerical experiments . . . . 7.3 Parameterization of random wave processes . . . . 7.4 Results and comparisons . . . .
8 Conclusions
8.1 Future directions . . . .
Appendices
A Gaussian process simulation . . . . B Impulse response of single-degree-of-freedom systems . . . . B.1 Probability distribution for an exponentially decaying function . C Background response for the two-degree-of-freedom system . . . . D Gaussian process regression . . . . D.1 Noisy experiments . . . . D.2 Latin hypercube sampling . . . . E Iterative updates to a Gaussian process emulator . . . . F The Karhunen-Loeve expansion . . . . G Smoothed particle hydrodynamics . . . . G.1 Wave tank numerical simulations . . . .
References 109 110 111 113 114 117 119 124 126 131 131 132 133 134 141 144 147 . . . . 147 . . . . 149 . . . . 150 . . . . 153 . . . . 155 . . . . 157 . . . . 158 . . . . 161 . . . . 163 . . . . 165 . . . . 168 171
Figures
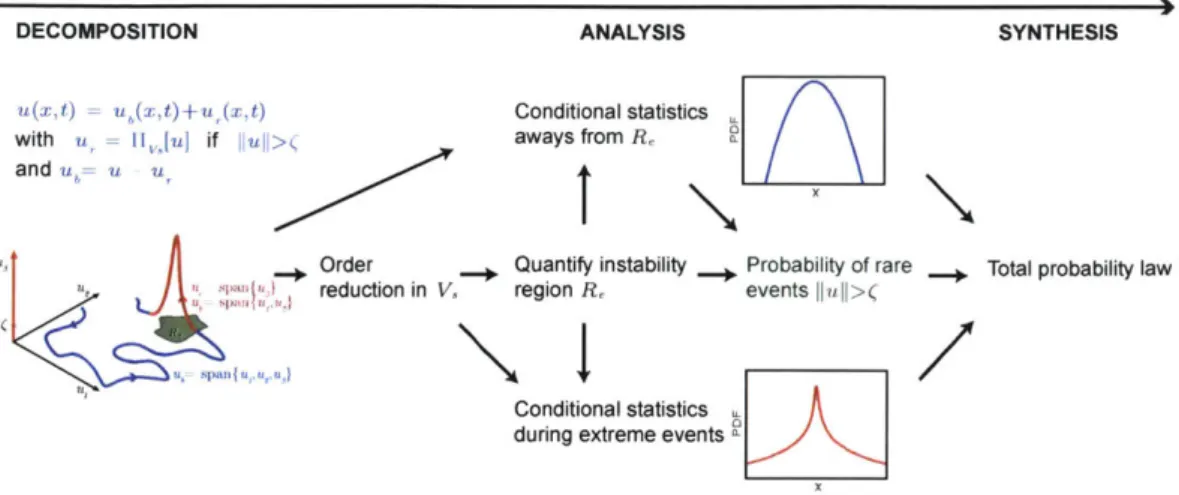
3.1 The conditional decomposition in equation (3.3) partitions the system response only when a rare event occurs due to an instability. This happens when the state of the system enters the instability region Re. In this example the subspace associated with rare events due to instabilities is Vs = span{u3}. For clarity we only illustrate one
intermittent instability in the figure, but rare responses will occur multiple times in this picture as the system evolves (since the region Re is associated with nonzero probability). 25
3.2 Outline of the steps of the decomposition-synthesis method. . . . . 28 3.3 (top) Background stochastic excitation containing impulsive extreme events (red
up-ward arrows) and the resulting system response displacement (bottom). . . . . 35 3.4 Schematic representation of the probabilistic-decomposition method for an
intermit-tently forced system. Illustrating the decomposition of the system response with re-spect to the excitation. . . . . 37 3.5 Probability distribution function with the decomposition-synthesis method and
Monte-Carlo simulations in an extremely intermittent regime, where instabilities are not sta-tistically independent so that assumption A2 is not valid (rare transition probability arbitrarily chosen at
P,
= 0.6). Parameters are: cx =1,
cy = 0.5, kx = 0.25, ky =1,
of = 0.75, of = 2.5. . . . . 41
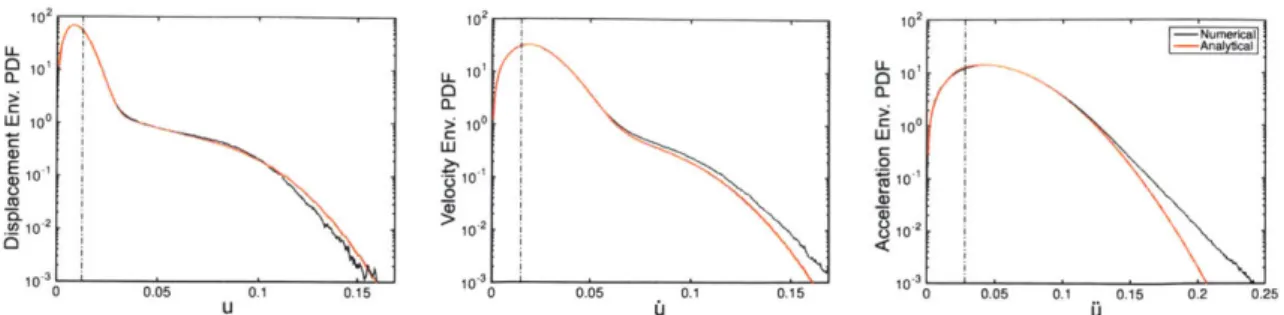
4.1 (underdamped case) Comparison between direct Monte-Carlo simulations and the an-alytical approximation pdf in the underdamped limit for the SDOF system 1 (system parameters are given in table 4.1).'Ihe pdf for the envelope for the displacement (left), velocity (middle), and acceleration (right) are shown. Dashed lines indicate one stan-dard deviation. . . . . 52
4.2 (overdamped case) Comparison between direct Monte-Carlo simulations and the an-alytical pdf for SDOF system 2 (system parameters are given in table 4.2). The pdf for the displacement (left), velocity (middle), and acceleration (right) are shown. Dashed lines indicate one standard deviation. . . . . 54
4.3 (critical damping) Comparison between direct Monte-Carlo simulations and the semi-analytical pdf scheme for SDOF system 3 (system parameters are given in table 4.3). The pdf for the displacement (left), velocity (middle), and acceleration (right) are shown. Dashed lines indicate one standard deviation. . . . . 57 4.4 Two-degree-of-freedom system, where the forcing excitation is applied to the first
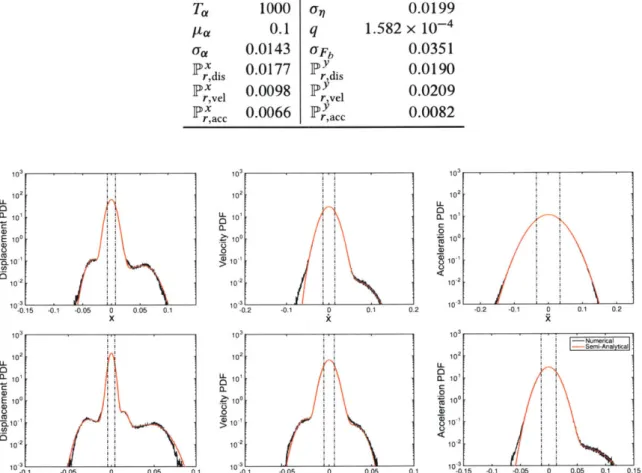
mass m that is attached to another oscillator of mass ma. . . . . 58 4.5 (TDOF system) Comparison between direct Monte-Carlo simulations and the
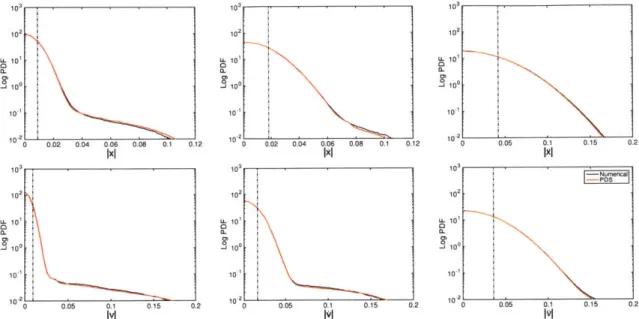
semi-analytical PDS approximation method for both degrees of freedom (displacement vari-able, left, velocity varivari-able, middle, and acceleration, right), for given system parame-ters in table 4.4. The top row is for the x variable and the bottom row for the y variable and ashed line indicates one standard deviation. . . . . 59 4.6 (local extrema for TDOF system) Comparison between direct Monte-Carlo simulation
and the semi-analytical PDS approximation method for both degrees of freedom of the local maxima (displacement variable, left, velocity variable, middle, and acceleration, right), for given system parameters in table 4.4. The top row is for the x variable and the bottom row for the y variable and dashed lines indicates one standard deviation. 62 4.7 Mechanical model for a suspended seat problem with a small nonlinear attachment
(vibration absorber). . . . . 63 4.8 (suspended seat with a nonlinear attachment) Comparison between the PDS method
and Monte-Carlo simulations, with parameters given in table 4.5, where the seat re-sponse is shown in the top row and attachment rere-sponse in the bottom row. The pdf for the displacement (left), velocity (middle), and acceleration (right) are shown. Dashed vertical line denotes one standard deviation. . . . . 65
4.9 Ince-Strutt diagram showing the classical resonance tongues (shaded) for particular
combinations of E and wc/Q2, for Mathieu's equation (4.61). Transition frequencies at
(021/22 = (n/2)2. Stability boundaries are computed using Hill's infinite determinant
approach [94]. . . . . 67
4.10 The stability of a ship when a wave crest is amid-ship (left) is reduced since the bow
and stern are likely to have emerged and this reduces contact with the water leading
to lower roll-restoring abilities. Compare this to the case when the wave trough is
amid-ship (right), where the hull has increased contact with the water and thus greater
roll-restoring m om ents. . . . . 68
4.11 Sample realization of the stochastic Mathieu's equation (middle, equation (4.68)) under
the parametric excitation term (bottom) and the corresponding averaged variables
x
iand X2 (top, equations (4.72) and (4.73)). The random amplitude forcing term a(t)
trig-gers intermittent resonance when it crosses above or below the instability thresholds
(dashed lines). . . . . 70
4.12 (left) Stability diagram for constant (in time) a and for finite damping
<
= 0.1 (redshaded region); (middle) pdf of the excitation a (t) for two different values of ca; (right)
The corresponding analytical pdf of the stochastic Mathieu's equation according to the
decomposition-synthesis method (4.97), where we have highlighted the conditionally
rare event component (dashed red) in the full pdf (solid blue), showing that the tails
are completely described by rare events, whereas the background dynamics fully
de-termine the core (the response pdf is shown assuming f, = 10.0, other parameters
are described in section 4.2.5). . . . . 79
4.13 Comparisons between Monte-Carlo simulations (blue curve) of the stochastic
Math-ieu's equation (4.98) and the 'true' density, the averaged system equations (4.72) and (4.73)
(green curve), and our analytical approximation in equation (4.97) (red curve), along
with a Gaussian approximation (dashed purple curve). The left column corresponds
to a parametric excitation process with correlation time-scale of fa = 2.5, the middle
column f, = 5.0, and the right column fa = 10.0; note that the time scale of damping
is tdamp -I = 10.0. In the top row the excitation standard deviation is a = 0.148,
middle row or = 0.229, and the bottom row a, = 0.267. Fixed system parameters
4.14 Realization of the intermittent variable x (t) (top, left) with large amplitude bursts and a fat-tailed equilibrium pdf (top, right), alongside the exciting signal y (t) (bottom, left) with a Gaussian response pdf (bottom, right). . . . . 82 4.15 Joint density p, (a, ) (left), alongside the marginalized densities for amplitude a (top
right) and length scale (bottom right) for cy = 0.5, ky = 1, af, = 2.5 . . . . 84
4.16 Comparisons between Monte-Carlo simulations (blue curve) for the nonlinear system of coupled oscillators in equation (4.99) and the approximation by the decomposition-synthesis method (red curve), for increasing values of the cubic nonlinear term s. Vertical dashed lines denotes 4 standard deviations of x(t). Parameters are: c, = 1,
c = 0.5, kx = 4, k = 1, af, = 0.75, af, = 2.5. . . . . 88
4.17 Comparisons between Monte-Carlo simulations (blue curve) for the nonlinear system of coupled oscillators in equation (4.99) and the approximation by the decomposition-synthesis method (red curve), for increasing values of the cubic nonlinear term s. Vertical dashed lines denotes 4 standard deviations. System parameters are: cx = 1,
c = 0.5, kx = 4, k = 1, = 0.Of 75, f, = 2.5. . . . . 89
5.1 Example large amplitude freak wave formed due to dispersion and nonlinear interac-tions. Dashes horizontal lines indicate 4 ... . . . . 92 5.2 Illustration that the initially Gaussian wave field for the surface elevation converges
to heavy-tailed equilibrium pdf . . . . 96 5.3 Simulation of an extreme wave group for A = 0.11, L = 11, comparing the exact
MNLS (left) and the reduced order model (right) using a 14 mode projection. . . . . . 97 5.4 (left) The wave group amplification factor
Iumr(A,
L) computed using the reducedorder dynamical system for rare events u,(x, t). (right) Partition of (A, L) plane into focusing and defocusing regions according to the reduced order model. . . . . 98 5.5 Procedure for computing the conditional statistics for rare events. First we determine
the probability of wave groups PAL (A, L) in Re for a given spectrum. Then we com-pute the pdf for the quantity of interest for each focusing group, using the reduced order model. This is performed for all wave groups that have a nonzero probability of occurrence in Re: PAL
(A,
L) > 0. . . . . 995.6 Group density PAL (A, L) for Gaussian spectra: E = 0.025 (top row), E = 0.050 (bot-tom row), a = 0.1 (left column) and a = 0.2 (right column). The red curve denotes the Re boundary . . . . 101
5.7 Probability distribution function approximation by the decomposition-synthesis method for the MNLS equation (5.15). In each case, the blue curve denotes Monte-Carlo simula-tion of the MNLS and the red line represents the approximasimula-tion by the decomposisimula-tion- decomposition-synthesis procedure. The vertical dashed line denotes 4E (i.e. 4 standard deviations of the spectrum) and the x-axis plotted to 8E. We also display the Rayleigh distribution of
ju
l
(green dashed line). Ordered in increasing BFI regimes: top left BFI = 0.35, top right BFI = 0.71, middle left BFI = 0.71, middle right BFI = 1.00, bottom left BFI = 1.00, bottom right BFI = 1.41. . . . . 1045.8 Prototype problem of a buoy under excitation due to changes in the surface elevation
q (x,t). ... ... 105
5.9 Probability distribution function approximation by the decomposition-synthesis method for the response of the prototype structure in equation (5.31) under excitation by the MNLS equation (5.15). In each case, the blue curve denotes Monte-Carlo simulation of the structure y and the red line represents the approximation by the decomposition-synthesis procedure. The vertical dashed line denotes 4E (i.e. 4 standard deviations of the spectrum) and the x-axis plotted to 8c. We also display the Gaussian distribution of y (green dashed line) assuming linear waves. Ordered in increasing BFI regimes: top left BFI = 0.35, top right BFI = 0.71, middle left BFI = 0.71, middle right BFI = 1.00, bottom left BFI = 1.00, bottom right BFI = 1.41. . . . . 107
6.1 Areas with large probability in 0 are not necessarily associated to regions with large
T. The proposed algorithm focuses on sampling regions where the probability of oc-currence is important and also takes into account the expected magnitude of IT
.
. . . 1126.2 The signed difference A+(s)\A(s) between the sets A+(s) = {0 e U: T(0)+r(0) < s} (dashed) and A(s) = {0 E U: T(O) < s} (solid) . . . . 120
6.3 (left) Integration of
on
(0) over contours of log pe (0) implies sampling of o (0)ev-erywhere, even in low probability regions of 0. (right) On the other hand, low-order moments of
o
(0) rely only on values of a, (0) close to high probability regions of 0,and thus does not sample rare event regions sufficiently frequently. . . . . 123 6.4 Nonlinear oscillator's restoring force F(x) in equation (6.48). . . . . 124
6.5 Exact pdf of the observable (left) computed from densely sampling the observation map (right) using the corresponding probability of 0 observations (middle) for n = 2. 125 6.6 Exact pdf of the observable (left) computed from densely sampling the observation map
(right) using the corresponding probability of 0 observations (middle, where contours of the or, 2a, and 4c probability level ellipses are plotted) n = 3. . . . . 125 6.7 Progression of the pdf estimation as we iteratively sample more points for n = 2. The
region between the pdfs of the map bounds T
o7
are shown for illustration in red. Dashed lines denote one standard deviation. . . . . 127 6.8 Progression of the pdf estimation as we iteratively sample more points for n = 3. Theregion between the pdfs of the map bounds T
a
are shown for illustration in red. Dashed lines denote one standard deviation. . . . . 127 6.9 (left) A scatter plot of the algorithm's sampling after 200 iterations (green points denotethe initial random LH samples). (right) the corresponding L I error of the log of the pdf between the exact and GPR mean as a function of the iteration. . . . . 128 6.10 Comparison of the error fIlog p, - log piI between LH sampling and the proposed
sequential algorithm under different parameters measured against the exact pdf for the case where n = 2 in equation (6.50). The parameter ncore is the number of 'core' iterations performed according to a L2 metric and nstart is initial dataset size (where
the points are sampled from an LH design). In the left plot we illustrate the case where the hyperparameters are fixed throughout and in the right pane when the hyperpa-rameters are retrained after each iteration. . . . . 129
7.1 The numerical domain (left) and a close up view of the offshore platform (right). . . . 133
7.3 Rendered snapshot of the SPH simulation at t = 103.5 s with 01 = 4.63 and 02 = 0.662 in non-dimensional units. . . . . 135
7.4 The parameter to observation map T(0) for the force F, (left) and moment My (right).
Recall that 01 is the lengthscale L of a wave group and 02 is the amplitude or height
A of the group... ... 137
7.5 The exact pdf of the force and momentum variables for JONSWAP spectrum 1 (top half)
and JONSWAP spectrum 2 (bottom half). Dashed vertical line denotes one standard
deviation. . . . . 137
7.6 Algorithm progression for the force variable (top half) and progression for the
mo-mentum variable (bottom half) for JONSWAP spectrum 1. . . . . 138
7.7 Algorithm progression for the force variable (top half) and progression for the
mo-mentum variable (bottom half) for JONSWAP spectrum 2. . . . . 139
7.8 Error as a function of the iteration count between the 'exact' pdf and the prediction from the sequential algorithm scheme for JONSWAP spectrum 1 (top half) and
Tables
4.1 System parameters and statistical quantities for SDOF system 1. . . . . 51
4.2 System parameters and statistical quantities for SDOF system 2. . . . . 54
4.3 System parameters and statistical quantities for SDOF system 3. . . . . 57
4.4 System parameters and statistical quantities for the TDOF problem. . . . . 59
Bibliographic notes
'This thesis is based on a number of publications, which are listed below.
[1] H. K. Joo, M. A. Mohamad, and T. P. Sapsis. "Extreme events and their optimal mitigation in nonlinear structural systems excited by stochastic loads: Application to ocean engineering systems". Ocean Engineering 142 (2017), pp. 145-160. DOI: 10. 101 6/j .oceaneng. 201 7. 06. 066.
[2] H. K. Joo, M. A. Mohamad, and T. P. Sapsis. "Heavy-tailed response of structural systems subjected to extreme forcing events" (2017). Submitted.
[3] M. A. Mohamad, W. Cousins, and T. P. Sapsis. "A probabilistic decomposition-synthesis method for the quantification of rare events due to internal instabilities". Journal of
Com-putational Physics 322 (Oct. 2016), pp. 288-308. DOI: 10. 101 6/j .jcp. 2016.06.047.
[4] M. A. Mohamad and T. P. Sapsis. "A sequential sampling strategy for extreme event statistics in nonlinear dynamical systems" (2017). Submitted.
[5] M. A. Mohamad and T. P. Sapsis. "Probabilistic description of extreme events in intermit-tently unstable dynamical systems excited by correlated stochastic processes". SIAM/ASA
Journal on Uncertainty Quantification 3.1 (Jan. 2015), pp. 709-736. DOI: 10. 11 37/1 40978235.
[6] M. A. Mohamad and T. P. Sapsis. "Probabilistic response and rare events in Mathieu's equation under correlated parametric excitation". Ocean Engineering 120 (July 2016), pp. 289-297.DOI:10.1016/j.oceaneng.2016.03.008.
CHAPTER 1
Introduction
Extreme events are a topic of important relevance and interest in numerous technological processes and natural phenomena. They are associated with the 'tails' of a probability distribution function and are considered 'rare' but influential, in other words these events occur frequently enough that we cannot neglect their existence despite their low probability of occurrence. Indeed, quantifying and predicting extreme events is a central issue in science and engineering and their importance is highlighted by real-world cases that have illustrated their potential to cause significant economic losses, physical damages, and even human causalities. Complex dynamical systems in science and engineering that contain extreme events posses nonlinear terms and stochastic factors (through additive or parametric stochastic terms, initial conditions, or a combination thereof). The stochastic factors are understood as either the result of some external physical processes (inherently random processes that are undesirable or not possible to explicitly incorporate, e.g. environmental loads) or as the result of elimination of internal degrees of freedom (through, for example, averaging methods). A principal focus in this work are transient responses that push the system away from its statistical steady state and that correspond to large amplitude excursions. In this picture, extreme events emerge from a background 'heat' bath and are initiated through either nonlinear or stochastic terms. It is important to understand and quantify the triggering of extreme responses and their evolution, which will depend on the structure of both the noise and nonlinear terms, in order to efficiently characterize the statistical properties of these events.
Numerous complex systems exhibiting extreme events can be found in nature and engineering. Climate and weather related extremes include intense precipitation, excessive wet or drought peri-ods, heat and cold waves, tropical storms, and temperature fluctuations [47, 35, 56]. In turbulent systems and fluids flows, extremes are commonplace and include intermittent instabilities in the
ad-vection of natural and anthropogenic tracers in the ocean and atmosphere [79, 77, 95, 81, 109]. In the ocean, extreme surface waves, known as rogue waves, freak waves, killer waves, or monster waves, have been observed to occur in both deep and shallow water conditions [64, 34]. These large waves emerge suddenly and have caused large damages to ocean liners, offshore platforms, and the sinking of ships (see [75] for a compilation of encounters). Rogue waves have been studied through the use of weakly nonlinear models, such as the nonlinear Schr6dinger equation, the Davey-Stewartson system, the Korteweg-de Vries equation, and the Kadomtsev-Petviashvili equation [104]. Extreme waves have also been observed in optics [31, 129] and superfluid helium [36], and rogue waves in these domains have been likewise modeled using weakly nonlinear Schr6dinger equations. In fi-nancial models of options pricing that aim to overcome the flaws of the simple geometric Brownian
motion picture (that leads to the linear Black-Scholes-Merton equation), include Schr6dinger based systems that attempt to reflect the complexity and behavior of real markets through nonlinear terms [59]. The corresponding option-price wave function of these pricing models have been noted to similarly undergo financial 'rogue' waves that may better explain shocks in financial market
scenarios [164].1
Extremes are also observed in engineering applications involving mechanical components under stochastic (environmental) loads [93, chap. 7, 130, chap. 4]. This includes dynamic stability problems in random vibration problems, for example beams under axial and transverse loadings, which can lead to buckling [74, pp. 170-171, chap. 6]. A notable example of extreme events in ocean engineering is large amplitude ship roll motions, which can occur even under mild sea conditions [67, 102, 73, 43], and also in other ship motions, such as during surf-riding, which can lead to sharp turns (known as broaching) and capsizing [133, 6, 54]. Additional examples include critical events in power systems, which have the potential to cause total grid failure and blackouts [106, 142, 151]. In chemistry, extreme and rare events are also observed in chemical reactions, quantum tunneling, and conformational changes in molecules and proteins, which involve overcoming energetic or entropic barriers and transitions between metastable states [156, 159, 154, 11, 98].
For many systems of practical interest, such as those mentioned above, it has been established that rare and extreme transitions occur often enough that they are of critical importance to un-derstand and predict. Importantly, these events occur more frequently than Gaussian statistics suggest (which is the case for systems under linear dynamics and stochastic factors with simple
'This is perhaps not too surprising given the resulting nonlinear Schr6dinger model, but interesting for their predictive potential.
forms, such as white noise or stationary Gaussian noise). The increase in frequency over Gaussian statistics, which predicts insignificant probabilities for large sigma events,2 relates to the important implications and even catastrophic outcomes of extreme events. Indeed, a hallmark characteristic of extreme events in complex dynamical systems is non-Gaussianity (e.g. heavy-tails) in the proba-bility density function (pdf) describing the response of their observables, which practically means we should expect to observe extreme responses in greater frequency. An important problem is the efficient and accurate description of this non-Gaussian behavior. For random dynamical systems with inherently nonlinear dynamics, expressed through intermittent events, nonlinear energy trans-fers, broad energy spectra, and large intrinsic dimensionality, this is a nontrivial task. For this class of problems it is largely the case that we are limited to direct Monte-Carlo sampling (simulations of numerous trajectories) due to the inherent complexity of the system, which limits applicable theoretical methods. However, this approach while feasible in a limited number of problems, is too computationally demanding for real-world applications of systems with large degrees of freedom, on the order millions ((106), considering the number of ensembles required to accurately resolve
low probability tail events (the probability pr requires ((1/pr) samples).
Efficient description of extreme event statistics in complex systems is a long sought objective. Quantifying the statistical structures associated with extreme events is a nontrivial problem, yet practical engineering and societal requirements necessitate skillful and simple predictors. For example, the geometric Brownian motion model in finance is known to significantly underpredict large return values, yet a large body of work has developed around this description, primarily driven by its simplicity and analytical predictions that are approximately true (but clearly miss critical extreme events) [51, pp. 9-11]; this holds, despite the fact that statistical analysis of market records demonstrate heavy tailed characteristics. 'Ihe landscape is similar in engineering. The prediction of large amplitude ship roll motion is a relevant problem in ocean engineering. In this case, there is also the need for simple predictors that can account for the increased probabilities of large amplitude roll motions due the stochastic nature of sea conditions and system nonlinearity [135, 55], which current design guidelines do not sufficiently account for, being primarily based on deterministic models or Gaussian probabilities. Consequently, these predictions do not adequately account for the observed frequency of large amplitude rolling and capsize events in real world scenarios, as
2 By sigma event we mean an event that is one standard deviation away from the mean value, or less formally a measure of
the disparity of a value with respect to its expected value. In a Gaussian context we would expect to observe a five-sigma event no more than once in 3.5 million observations, or, more precisely, with probability 1 - 0(5) = 2.87 x 10-, where 0(.) is the normal cumulative-distribution function (CDF).
demonstrated by incidents such as the post-Panamax class cargo ship accident on October 20, 1998 (see details in [44]). As such, the problem on how to effectively characterize extreme ship motions has been an important topic in the current debate on the second generation intact stability criteria for ship design by the International Maritime Organization (IMO) (see e.g. [45]).
1.1 Contributions
To address these challenges, we present both direct and adaptive strategies designed to effectively and efficiently quantify the probabilistic aspects of extreme events in complex dynamical systems. The emphasis is on approximate but accurate probability distribution estimation strategies that are
fast to evaluate.
Throughout this work we emphasize a blended perspective towards the quantification of ex-tremes, that considers both statistical information and dynamical properties of the system. This approach is adopted due to the inherent stochastic and transient character of extreme responses that challenges traditional uncertainty quantification methods and purely statistical techniques. The utilization of dynamic-stochastic models for the prediction of extreme events have also been advocated and employed in climate science and meteorology by others [46, 77, 17, 52]. Such a combined perspective has been shown fruitful in recent works and has led to the formulation of efficient predictors for extreme events [24, 40], efficient quantification schemes for heavy tailed distributions in dynamical systems [85, 86, 87], prediction uncertainty and experimental impact metrics [72] that maximally capture uncertainty of measurement data of a dynamical model, and blended information theoretic and reduced order model approaches for the prediction of fat-tailed distributions in turbulent systems [109, 108].
1.1.1 Direct extreme event quantification
We first formulate a direct quantification framework that characterize extreme responses through targeted simulations. More specifically, this method involves a probabilistic decomposition that separately considers intermittent, extreme events from the background stochastic attractor of the system. In order to apply this decomposition, we require knowledge of the dynamical mechanisms that are responsible for extreme events (e.g. conditions that lead to the triggering of intermittent instabilities) and utilizing this knowledge we partition the phase space accordingly. Crucially, this separation allows us to apply different uncertainty quantification schemes in the two regimes, i.e.
the background and the intermittent component. The background component, although potentially very high-dimensional, can be efficiently described by uncertainty quantification schemes that resolve low-order statistics, which is not challenging for most systems since there is a variety of preexisting methods designed for this task (e.g. Gaussian closure methods). On the other hand, the intermittent component, can be described in terms of a low-dimensional representation by a small number of modes through a reduced order model. We can therefore efficiently capture the statistical behavior in the extreme event regime through targeted simulations using the reduced order model. In the final step, the probabilistic information from these two regimes is synthesized according to a total probability law argument. This strategy, involving a decomposition and a subsequent synthesis, allows us to effectively and efficiently approximate the non-Gaussian probability distributions in complex dynamical systems for quantities of interest; this is because we no longer have to 'wait' for extreme events to emerge from the background attractor, but can instead directly simulate the responses after understanding their initiation mechanisms.
We demonstrate the direct quantification method to various examples, from problems in mechan-ics to nonlinear water waves. Both the analytical and semi-analytical application of the proposed extreme event quantification framework are illustrated. The examples include mechanical systems under random impulsive excitation (modeling slamming loads on high speed craft motion in ir-regular seas), oscillators undergoing transient parametric resonances (modeling large amplitude ship roll motions in irregular seas), and coupled nonlinear oscillator systems undergoing transient instabilities (modeling beam deflections under axial and transverse loads and turbulent modes). We also illustrate the proposed method to problems in nonlinear water waves (that model rogue waves in deep water conditions). Using a high-order, modified nonlinear Schr6dinger equation setup, that accurately models water wave envelope dynamics, we demonstrate fast quantification of the surface elevation local-maxima statistics and also the response of an offshore structure that is under excitation by the surface elevation (modeling, for example, the heave motion of a buoy).
1.1.2 Adaptive extreme event quantification
The second part of this work involves the formulation of an adaptive sampling strategy that rapidly estimates the probability distribution function and extreme response statistics of a scalar observ-able or quantity of interest through a minimum number of experiments (numerical simulations). A limitation of the direct quantification method proposed is its reliance on knowledge of the sys-tem dynamics and mechanisms that initiate extreme responses. The proposed adaptive sampling
strategy overcomes this limitation through identification of important samples or experimental parameters (through a measure of the prediction uncertainty on the pdf estimate) and does not require specialized understanding of the dynamics, nor understanding of the mechanism that lead to extreme responses. For numerous complex systems it may not be possible or very challenging to analyze and quantify conditions that lead to extreme responses or even to obtain an accurate description of all the dynamical processes that are important. To address this class of problems, the proposed algorithm sequentially provides the next-best design point (set of experimental parame-ters) that would lead to the largest reduction in error of the probability density function estimate for the quantity of interest when this new sample point is evaluated; this strategy only depends upon being able to sample the input random space, and is therefore also suitable to physical experiments. Ihe algorithm utilizes Gaussian process regression to learn a parameter-to-observation map that describes the system's dynamical response to random parameters, which is then used to estimate the desired pdf of the observable along with uncertainty bounds. We iteratively determine new design points through an optimization procedure that selects the optimal point in parameter space that maximally reduces uncertainty between the estimated bounds of the probability distribution of the observable. We provide theorems that guarantee convergence of the algorithm and characterize the asymptotic behavior of the selected optimization criterion.
We first illustrate the adaptive sampling method to a prototype nonlinear oscillator example to demonstrate the algorithm's performance characteristics. To provide a real world example to a relevant large-scale engineering problem, we also illustrate the adaptive quantification algorithm to compute the non-Gaussian probability distribution describing the loads (forces and moments) on an offshore platform in irregular seas. The response of the platform is quantified through three-dimensional smoothed particle hydrodynamics simulations. Due to the extreme computational cost of these numerical models, quantification of the extreme response statistics for such systems has been a formidable task. We demonstrate that the adaptive algorithm accurately quantifies the extreme event statistics of the forces and moments on the offshore structure through a limited number of numerical experiments: illustrating that the proposed algorithm can realistically account for extreme events in the design and optimization processes for large-scale engineering systems.
1.2 Organization
A brief preview of the organization of the chapters in this thesis follows. In chapter 2, we discuss and provide an overview of existing methods for the probabilistic quantification of extreme events
and describe their limitations. Then in chapter 3 we formulate and describe the theory behind the direct extreme event quantification method. After this discussion, we provide concrete examples of the direct method to numerous problems in mechanics in chapter 4 and then to problems in nonlinear water waves in chapter 5. In chapter 6, we describe the theory and algorithm behind the adaptive quantification method for extreme events. We first provide a simple example illustrating the method in chapter 6, before applying the method to realistic wave-body interaction problems in chapter 7. Concluding remarks are provided in chapter 8.
CHAPTER 2
Background
In this chapter we provide an overview of existing methods for the probabilistic quantification of extreme events. There exist a large literature on the various methods that are mentioned here and only a brief review is provided for completeness. We highlight that the class of systems we consider in this thesis cannot be suitably quantified by existing methods from an efficiency per-spective. That is to say, while some of the methods will theoretically provide us with the desired probabilistic proprieties of complex dynamical systems, the methods may not be very practical from a computational or simulation perspective. This is crucial for engineering applications where fast quantification is required for design optimization and for reliability and safety assessment.
2.1 Overview
For many systems of practical interest, it has now been well established that rare transitions occur frequently enough that they are of critical importance. These intermittent events are randomly triggered as the system evolves on the (stochastic) background attractor, and they are subsequently governed, primarily, by the spatiotemporally local and strongly nonlinear dynamics associated with finite-time instabilities. Systems with these properties pose a significant challenge for uncertainty quantification schemes [78] and there has been a wide research effort in various fields towards the quantification and short-term prediction of extreme events in complex dynamical systems. In general, extreme events can be studied from a statistical context, by analyzing their frequency of occurrence as a function of some level or magnitude. Alternatively, another approach is to analyze extremes by studying the dynamical mechanism underlying their physics, which is more commonly considered in atmosphere science and oceanography [46, 109, 17], since there are large benefits to
the combined statistical and dynamical approach [52]. We now proceed to review existing methods for the probabilistic quantification of extreme events.
The quantification of rare events is one of the most fundamental problems in chemistry. Chem-ical reactions, conformational changes in molecules and proteins, and quantum tunneling are examples of rare events [159, 107, 11, 156]. These events are rare because the system has to overcome certain barriers of energetic or entropic nature in order to transition between metastable states. The usual setup for modeling such systems is their formulation in terms of a Langevin equation, i.e. a dynamical system with some non-quadratic potential that has multiple equilibria and is excited by additive white noise (see for example [156]). The goal then is to study barrier-crossing events by computing transition rates as well as shortest paths between states. For such systems the classical transition state-theory (TST) [39, 159] has been successful in providing the foundation for the development of computational tools that determine transition trajectories between different states. However, important limitations for transition state theory may occur when the system potential is not smooth. In this case it is essential to seek for transition tubes (i.e. ensembles of transition trajectories). The statistical framework to analyze such transition-path ensemble is known as the transition-path theory (TPT) [155, 83, 84] and has been applied successfully to interesting and challenging problems in a variety of areas, for example, in chemistry, biology, and material science.
Although successful in quantifying transitions between different states, path theory can have limitations when considering dynamical systems that exhibit rare responses due to the occurrence of intermittent instabilities (as opposed to multiple equilibria) that lead to strong energy transfers between modes, as in turbulence and nonlinear waves. In such cases, the rare event is not the result of a transition that takes the system from one metastable state to another, rather, it is the result of intermittent instabilities that 'push' the system away from its statistical steady state to a dynamical regime with a strongly transient character. The period that the system spends away from its statistical steady state attractor, as well as the distance from the attractor, take on a continuous range of values, which depends on the intensity and duration of the instability. This situation is completely different from the setup involving transitions between discrete states, for which TST and TPT theories have been developed.
Large deviations theory [150, 149, 29, 140, 22, 28, 13] is a powerful method for the probabilistic quantification of extreme events in sequences of probability distributions. It has also been applied in the context of stochastic differential equations, known as Freidlin-Wentzell theory [48], as well as for stochastic partial differential equations [19, 131,137]. In this case, the method essentially provides
us with rates of convergence to probabilistic limits. For example, for a dynamical system excited by very low intensity noise, large deviations theory gives closed form expressions bounding the probability for a deviation of the stochastic solution from the completely unperturbed solution, i.e. a probabilistic characterization of the stochastic solution relative to the deterministic limit. Despite its importance, it is not straightforward to apply this framework in order to quantify extreme events due to intermittent instabilities that emerge from the steady state attractor of the system, which is one of the central problems we are interested in this work.
For the probabilistic description of extreme events in phenomena characterized by intermittent instabilities, the analysis is usually limited to the statistical examination of observed statistics. For example, in ocean engineering, where it is important to analyze the probability of upcrossings and maxima for various quantities of interests (e.g. wave elevation or mechanical stresses), the standard setup involves the adoption of globally stable dynamics, for which many techniques have been developed (see e.g. [92, 130, 93]). There are numerous technical steps involved in this case that lead to elegant and clean results, but the starting point is the assumption of stationarity in the system response, which is not a valid hypothesis for intermittently unstable systems.
Extreme value theory [97, 71, 111, 37, 50] is also a widely utilized method that focuses on thor-oughly analyzing the properties of stationary stochastic processes following various distributions. However, in this case the analysis does not take into consideration the potential intermittently unstable nature of the system dynamics and is usually restricted to very specific forms of corre-lation functions on the response statistics [97, 71]. To this end, it is not surprising that for a large range of complex systems exhibiting intermittent characteristics, the Monte-Carlo method is the only reliable computational strategy to arrive at accurate estimates for the tail statistics. How-ever, for high-dimensional systems this direct approach is prohibitively expensive from a practical standpoint: recall, to resolve the probability pr requires (9(1/pr) samples.
Other quantification strategies include the Fokker-Planck (FP) equation [130, 126] for systems excited by white-noise and the joint response-excitation method [118, 3, 61] for arbitrary stochastic excitations. These methods have important limitations for high dimensional systems. In addition, even for low-dimensional systems, determining the part of the probability density function (pdf) associated with extreme events poses important numerical challenges. An alternative is the path integral method [91, 165], which entirely avoids solving the FP equation and is instead based taking advantage of the Markovian property of systems driven by white noise and constructs the pdf by utilizing conditional distributions though an iterative algorithm that requires numerical integration
of the system in time. Furthermore, closure techniques and moment equations [74,130], including cumulant closure methods [161], and also stochastic averaging and statistical linearization [166, 115], either cannot 'see' or miss extreme events or are expensive and require the solution of an inverse moment problem in order to determine the distribution of interest. Similarly, approaches relying on polynomial-chaos expansions [163] have been shown to have fundamental limitations for systems with intermittent instabilities or parametric uncertainties [78].
Subset simulation [4] is another technique for the estimation of rare event (failure) probabil-ities in reliability engineering applications, where the quantity of interest is the complementary cumulative distribution function of the response of a system with random inputs. The idea here is to construct a sequence of intermediate conditional probabilities with lower failure levels that are easier to sample from than the original failure probability. This translate the problem to the 'adaptive' sampling of the sequence of intermediate conditional events. Sampling these conditional events is nontrivial and cannot be efficiently determined by standard Monte-Carlo simulations, and specialized Markov chain Monte-Carlo (MCMC) strategies have been proposed for this purpose, but various other algorithms to perform this sampling have been proposed in recent works [18]. In other words, the subset simulation strategy provides a way to explore the failure region, without having to cleverly identify importance sampling densities to bias the distribution towards the failure region [116, chap. 5]. A disadvantage of such a strategy is that properties of the input noise are not taken into consideration, and thus obtaining a suitable parameterization can easily result in a problem with thousands or more random inputs, irrespective of the dimensionality of the dynamical system, if a judicious choice is not made. This is especially challenging for systems that are intermittently unstable, which would require a very large number of terms to accurately capture the excitation process, due to extreme sensitivity of the response's tails on the excitation. Estimating the stationary response pdf of a system with such a strategy thus has limitations.
In recent works, efforts have been undertaken to quantify the heavy tailed statistical structure of systems undergoing transient instabilities. For example, in [81] the intermittent behavior of turbulent diffusion models with a mean gradient is rigorously analyzed, while [109] explores and quantifies the capacity of imperfect models to capture the intermittent behavior of turbulent systems.
2.2 Review of select quantification strategies
We now provide a brief overview of several, select methods related to the quantification of extreme events, in particular: extreme value theory, large deviations theory, and the Fokker-Planck equation. We attempt to convey the central ideas of the methods without precise technical details. There is a vast literature on the methods described here, so the review is necessarily succinct. The section on extreme value theory is mainly from [97, 21], the section on large deviations theory is adapted from [145, 144, 22, 152], and the section on the Fokker-Planck includes material from [130, 103, 10, 128].
2.2.1 Extreme value theory
Extreme value theory deals with extreme deviations related to random variables exceeding a typical expected value. The theory is statistical based and provides a way to estimate the asymptotic distribution of extreme values from a set of ordered samples given by a random variable, and can be applied without a priori knowledge on the state. In essence, extreme value distributions are the limit distributions of extremes of a set of random variables and the problem becomes to fit the samples to the limit distribution by estimating the distribution parameters through maximum likelihood estimation and Bayesian methods. A major limitation of the theory are to systems with correlated variables, where results for this important practical case are nontrivial; for correlation functions of special forms there is convergence to an extreme value distribution and for correlated time series we can consider sequences that are much larger than the correlation length to draw some conclusions on the tail asymptote, however this is still an open problem [97].
Consider the set {X1, X2,. . . , of independent and identically distributed random variables
Xi with cumulative distribution function Px (x) = P (Xi < x). The distribution of the maximum
of the set, Y = max{X1, X2, .. , X, }, is given by
PY,
(x)
=P(Yn
< x) = P(X1 < x, X2 <x, . . . , Xn _<x) (2.1)= P(X1 < x)P(X2 _<x) . . .P(Xn _<x) = (Px(x))". (2.2)
In the limit n --