HAL Id: insu-03123428
https://hal-insu.archives-ouvertes.fr/insu-03123428
Submitted on 28 Jan 2021
HAL is a multi-disciplinary open access
archive for the deposit and dissemination of
sci-entific research documents, whether they are
pub-lished or not. The documents may come from
teaching and research institutions in France or
abroad, or from public or private research centers.
L’archive ouverte pluridisciplinaire HAL, est
destinée au dépôt et à la diffusion de documents
scientifiques de niveau recherche, publiés ou non,
émanant des établissements d’enseignement et de
recherche français ou étrangers, des laboratoires
publics ou privés.
Mesospheric temperature inversion and gravity wave
breaking
Alain Hauchecorne, Marie-Lise Chanin, Richard Wilson
To cite this version:
Alain Hauchecorne, Marie-Lise Chanin, Richard Wilson. Mesospheric temperature inversion and
gravity wave breaking. Geophysical Research Letters, American Geophysical Union, 1987, 14 (9),
pp.933-936. �10.1029/GL014i009p00933�. �insu-03123428�
GEOPHYSICAL RESEARCH LETTERS, VOL. 14, NO. 9, PAGES 955-956, SEPTEMBER 1987
MESOSPHERIC TEMPERATURE INVERSION AND GRAVITY WAVE BREAKING
A. Hauchecorne, M.L. Chanin, and R. Wilson
Service d'A•ronomie du CNRS, BP 3, 91371 Verri•res le Buisson, France
Abstract. More than 500 nightly mean from reentry data of the US space shuttle around temperature profiles have been obtained since the same altitude (Champion, 1986). Such density 1981 by two Rayleigh lidars located in south of anomalies are associated with layers of France 550 km apart. In the mesosphere a temperature inversion.
temperature inversion, a feature persisting for The goal of this paper is to present a several days, is frequently observed simulta- statistical analysis of this phenomenon by using neously at both sites. From a statistical study more than 500 lidar temperature profiles, and to of the inversion characteristics, it is shown show that it is consistent with the breaking of that its altitude ranges from 55-72 km in winter gravity waves in the mesosphere.
to 70-83 km in summer, while its probability of
occurrence presents a semi-annual variation with Experimental Evidence a maximum higher in winter than in summer and a
minimum lower in May than in September. The Rayleigh lidars provide temperature profiles seasonal variation of the temperature inversion from 30 to 90 km with a good vertical resolution is shown to be very similar to that of the MST (Hauchecorne and Chanin, 1980 ; Chanin and radar echoes in the mesosphere associated to Hauchecorne, 1984). If the data are integrated turbulent layers generated by the breaking of during a few hours, short term variations due to gravity waves. A crude estimate of the amplitude gravity wave perturbations tend to vanish and the growth with height of a gravity wave in the resulting temperature profile is representative presence of an inversion layer indicates that the of the mean state of the atmosphere above the wave will break preferably inside and above this lidar. Such profiles obtained in December 1986 layer. The persistence of a temperature inversion during 5 consecutive nights by the Rayleigh lidar during several days, with amplitude as large as located at Biscarrosse (44øN, iøW) are shown in 40 K, is tentatively explained by the heating of Figure 1. In the mesosphere these profiles are the turbulent layers generated by the continuous characterized by a minimum of temperature near breaking of gravity waves above the secondary 70 km, a strong positive gradient above, a secon- minimum of temperature. dary maximum near 75-80 km (up to 40 K warmer than the minimum) and scattered variations at the Introduction top of the profile. It should be noted that a
40 K increase in temperature is associated with a The zonal mean circulation in the upper 17 % decrease in density. In this example the mesosphere is very different from the circula- inversion layer persists at the same altitude tion predicted if a radiative equilibrium of the during a period of 5 days what is typical of our atmosphere is assumed. At the mesopause level the observations. A profile obtained on December 1, zonal winds are easterly in winter and westerly 1986 by the second lidar located at the Haute in summer, whereas the radiative equilibrium Provence Observatory (hereafter OHP, 44øN, 6øE) would induce strong winds in the opposite (Figure 2) shows an inversion layer at the same direction (Schoeberl and Strobel, 1978). The altitude as in the Biscarrosse profile taken winter mesopause is also much warmer in the real simultaneously, what indicates a horizontal atmosphere than in the radiative one. The role of extension of at least 550 km for this layer. The the gravity wave dissipation to maintain the short term stability of the temperature inversion observed mesospheric circulation has been pointed may be studied by comparing hourly averaged out by many authors during the latest years profiles during a night. This has been done for (Lindzen, 1981 ; Matsuno, 1982; Holton, 1982 ; the night of December 1, 1986 at OHP (Figure 3). Schoeberl et al., 1983). It is now well Due to the short time of integration, these recognized that wave transience and dissipation profiles are modulated by the presence of inter- in the mesosphere are responsible for the obser- nal gravity waves. It is not the purpose of this red thermodynamical structure and circulation. paper to study the gravity waves for themselves However all models assume a regular decrease as observed from lidar data and for that purpose of temperature from the stratopause to the meso- the reader may refer to Chanin and Hauchecorne pause while our Rayleigh lidars measurements, (1981 ; 1987). The inversion layer is visible in taken on a regular basis since 1981, display all the hourly profiles between 70 and 75 km with quite frequently a secondary maximum of tempe- a variable amplitude. This example shows that the rature. As far back as the sixties, this anomaly inversion layer persists during the night and was already observed around 75 km by rocket thus should not be interpreted as a tidal effect. measurement. Such a result was reported by Furthermore such a phenomenon is not only obser- Schmidlin (1976) but without explanation. More ved during winter : Figure 4 shows two profiles recently local density deficiencies were observed obtained in July 1986 by the OHP lidar. It thus
appears that the existence of an inversion layer
Copyright 1987 by the American Geophysical Union. is not related to the propagation of planetary
waves through the middle atmosphere, as they are
Paper number 7L6619. blocked by the easterly stratospheric winds in
0094-8276/87/007L-6619•03.00 summer.
954 Hauchecorne et al.: Mesopheric Temperature Inversion
% k.",
'%
q",
I
, N,,
,
$60 200 240 280 280 280 280 280 $60 200 240 280 280 280 280 280
TEBPERATURE (K) TEBPERATURE (K)
Fig• 1 Nightly mean temperature profiles at Biscarrosse from December 1 to December 5, 1986. The error bars (• 1 a) are indicated by the shaded area. The CIRA 1972 profile is shown for comparison (dotted line). Perturbations with vertical wavelengths shorter than 1.5 km
have been filtered.
Statistical Studies
Fig. 3 Hourly mean temperature profiles on December 1, 1986 at OHP. The adiabatic lapse rate P is represented for comparison in the layer of strong negative lapse rates.
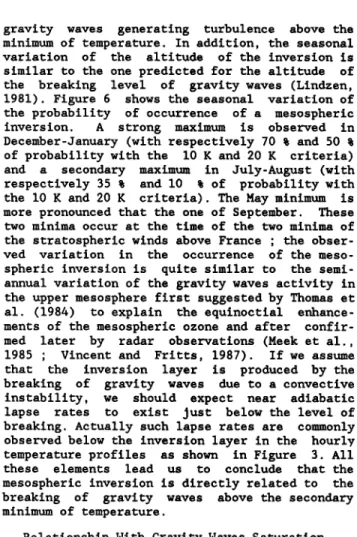
gravity waves generating turbulence above the minimum of temperature. In addition, the seasonal variation of the altitude of the inversion is similar to the one predicted for the altitude of the breaking level of gravity waves (Lindzen,
The OHP lidar has provided
a mean
tempera- 1981). Figure 6 shows
the seasonal variation of
ture profile for each night of clear sky condi-
the probability of occurrence
of a mesospheric
tions since June 1981 and more
than 500 profiles
inversion. A strong maximum
is observed in
are available to characterize the mesospheric December-January
(with respectively
70 % and 50 %
inversion on a statistical basis. In order to
of probability with the 10 K and 20 K criteria)
perform
this study, we define a criterion for the
and a secondary
maximum
in July-August
(with
existence of an inversion layer which is an
respectively
35 % and 10 % of probability with
increase
of temperature
above
the first minimum the 10 K and 20 K criteria). The May
minimum
is
larger than a specified
value (10 K or 20 K) with
more
pronounced
that the one of September.
These
an accuracy better than 5 K. Figure 5 shows from two minima occur at the time of the two minima of
all the profiles from June
1981 to September
1986
the stratospheric
winds
above
France
; the obser-
for which an inversion has been detected, the
ved variation in the occurrence of the meso-
altitude of the minimum
of temperature,
versus spheric
inversion
is quite similar to the semi-
the day of the year. The number of observed annual variation of the gravity waves activity in inversions is large in winter, from December to
February, at altitudes ranging from 55 to 72 km. In summer, from June to September, the density of observations is lower and the altitudes are
mainly concentrated between 70 and 83 km ; March- April and October-November appear as periods of transition between the winter and the summer
regimes : only two inversions are observed in May. It should be noted that the seasonal varia-
the upper mesosphere first suggested by Thomas et al. (1984) to explain the equinoctial enhance- ments of the mesospheric ozone and after confir- med later by radar observations (Meek et al., 1985 ; Vincent and Fritts, 1987). If we assume that the inversion layer is produced by the breaking of gravity waves due to a convective instability, we should expect near adiabatic lapse rates to exist just below the level of tion of the altitude of the inversion is very
similar to the seasonal variation of the MST breaking. Actually such lapse rates are commonly
observed below the inversion layer in the hourly radar echoes in the mesosphere shown for instance
by Balsley
and
Ecklund
(1984)
for the Poker Flat
temperature
these elementsprofiles as shown
lead us to concludein Figure 3. All
that theradar ; the altitude of the maximum of the radar
echoes
is about
5 km
higher
than the altitude of
mesospheric
inversion
is directly related
to the
the inversion. These authors consider that the
breaking of gravity waves above the secondary
minimum of temperature. radar echoes are due to turbulence layers genera-
ted by the breaking of gravity waves.
Such
a
Relationship
With Gravity
Waves
Saturation
result seems to indicate that the two phenomena
have the same origin and that the temperature We present now a possible explanation for the inversion is directly related to the breaking of persistence of an inversion layer during several
[-' OHP
<•
1 DEC
86
,,•..
160 200 240 280 TEMPERATURE ( K ) --80 •60 5O 4O_ OHP
'•",
OHP
- CIRA
1602 JUL
I , I , I/', i c]F•^
"1_
JUL
86
200 2/--,.0.7 2,4.
280 160JUL
'•
^u(;
200 240. I
280TEF1PERATURE (K) TErlPERATURE (K)
Fig. 2
Nightly mean temperature profile at OHP
Fig. 4 Nightly mean temperature profiles at OHP
Hauchecorne et al.: Mesospheric Temperature Inversion 95S
..9OL
, , , , , ,+, , , , , j
•v !
+
+ + ++ +
]
....80
I_
+ +++
+ +
+
+ -I
,W:,
I- +++++ + + +++++++
+++ _+++++ -,-
+/
+ *,- '""_ .-H- ++ / .::m I..,.+ + + +-•'•+ + + • .-,.- ..,.,+ • •- ,--J • L• + +• -'"'1'-+•
'"'-..,
+ ++
+ + + .,,,.++
.½
.•..I
< •.•+
6O "•'"'"'""
4t
+
,4+
I j+
I I I I I I I
50 I FI FI I A FI J J ^ $ 0 N O
Fig. 5 Altitude of the secondary minimum of temperature versus the day of the year for all OHP profiles from June 1981 to September 1986 for which a temperature inversion has been detected (10 K criterion).
dissipation up to the altitude where a condition of instability is met. If we assume that a convective instability occurs, which is a reasonable assumption considering the profiles shown in Figure 3, the wave induces an adiabatic temperature lapse rate. This gives ß
k T' = N2T/g
z s(9)
where T' is the saturation amplitude of the
wave. With the hypothesis (2)
and (3) k z is
expressed as ß
k x N
N
k = (lO)
z CO U - C
and the saturation amplitude expression is ß
T' 2 = N2T
2 (• _ c)2/g2
(11) days. We will show that the breaking of gravity The ratio R of the wave amplitude T' to its waves should occur preferably inside and above saturation value T' is obtained from (8) and the inversion layer and that the dissipation of (11) ßthe
waves
could
maintain
a quite
stable
tempera- T'
ture inversion. For that purpose a crude estima-
R =
•
o
_
(12)
T'
Po kx (•
c)3
tion of the amplitude growth with height of a non-dissipating gravity wave will be compared to its saturation amplitude.
In the absence of dissipation the vertical momentum flux of a wave is conserved. This
A saturation of the wave occurs as soon as
the ratio R becomes greater than 1. In addition to its exponential increase with height, R
Thus it
increases with N and with 1/(•
- c) 3 .
conservation
may
be written for a wave
propaga- depends
strongly
on the mean
temperature
and
wind
ting in a two-dimensional
atmosphere
ß
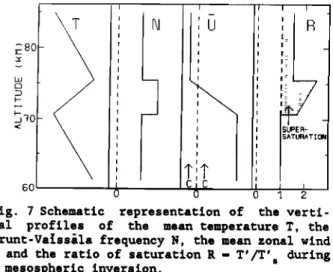
profiles. Figure
7 shows
a schematic
description
-z/H of the variation with height of these quantities
p u'w' = F ø = Poe
u'w'
(1)
in the case of a mesospheric inversion, forwhere p and Po are the atmospheric
densities at
instance in
winter. Considering the hourly
the altitude z and z • 0, u' and w' the profiles shown on Figure 3 we assume that the horizontal and vertical wind perturbations due to wave is near its saturation below the inversion.
the wave, F the vertical momentum
oflux and H
When the wave reaches the inversion layer, N
the mean scale-height of the atmosphere.
If we
increases
suddenly
and, assuming
that this layer
assume that
corresponds to the region of decrease of the
f << CO
<< N
(2)
zonal wind above
the westerly mesospheric
jet,
and using the short wavelength
approximation
h_ypothesis that will
be justified thereafter,
2 H k
z >> 1
(3)
u - c decreases
around 0. A large increase offor a large
range
R is obtainedof c values
inwhere f, CO and N are respectively the Coriolis, the inversion layer and a strong super-saturation
the wave
and the Brunt-Va[s&la
frequencies
and k z
of the wave
is expected.
This wave
deposits its
the vertical wave number, the relation between u' momentum, decelerates the zonal wind (what justl-
and w' is reduced
to
fies our hypothesis
on the decrease
of • in the
w' - CO
u'/N
(4)
inversion
layer),
and its breaking produces
turbulence. As seen in Figure 7, the generation The wave frequency is equal to ß of turbulence occurs inside and above the inver- sion layer. The presence of turbulence above the CO - k (u - c) x (5) minimum of temperature helps maintaining the inversion layer by two processes. The first one where k is the horizontal wave number, u the is the heating due to the viscous dissipation of mean zonal wind and c the horizontal phase speed
of the wave. Introducing (4) and (5) into (1) we
obtain ß
u'
z F
---ø N e
-z/H
(6)po k•
u - c
With the hypothesis (2) and (3), the temperature and wind perturbations T' and u' are related by :
T' • u' NT/g (7) where T is the mean temperature and g the acceleration of gravity. From (6) and(7) we obtain the estimation of the temperature perturbations ' F N • ezfa T z T,•. = o (8)
•o k• (•- c) g"
100[
• 80 • 60 < 40 o m 20 0 j F • A • J J A S 0 N DFig. 6 Annual variation
of the probability of
occurrence of a mesospheric inversion for the 10 K and 20 K criteria. A • 30 days trian- gular filter has been applied to smooth the
956
Hauchecorne
et al.: Mesospheric
Temperature
Inversion
60 I 0 I I i i I I i i o I I SUPER- SATURAT•O i i o • 2 Fig. 7 Schematic representation of the verti- cal profiles of the mean temperature T, theBrunt-Vatss•la frequency N, the mean zonal wind
u and the ratio of saturation R - T'/T', during
a mesosphertc inversion.
turbulent motions and the second one is the
help in operating the station in particular to J.P. SCHNEIDER, F. SYDA, J. BOURDARIE and G. BAIN
who collected the data. They also acknowledge the
helpful comments of H. LE TEXIER on the manus- cript. This work was supported by CNRS, DRET and
ETCA.
References
Basley, B.B., W.L. Ecklund and D.C. Fritts, VHF echoes from the Arctic mesosphere and lower thermosphere, Part I ß Observations in "Dynamics of the middle atmosphere", Terra Scientific Publishing Company, Tokyo, 1984. Champion, K.S.W., Middle atmosphere models and
comparison with Shuttle teentry density data, Advances in Space Research, 4, 1986.
Chanin, M.L. and A. Hauchecorne, Lidar observa- tions of gravity and tidal waves in the stratosphere and mesosphere, $. Geophys, Res,, 8_•6, 9715-9721, 1981.
Chanin, M.L. and A. Hauchecorne, Lidar studies of temperature and density using Rayleigh
downward
vertical heat flux from
the upper layer
scattering,
MAP
Handbook,
13, 87-99,
1984.
to the inversion
layer due to the turbulent Chanin,
M.L.
and A. Hauchecorne,
Lidar sounding
vertical mixing
of the atmosphere.
These
two
of the structure
and dynamics
of the middle
processes
heat the inversion layer while the
atmosphere.
A review
of recent
results relevant
layer underlying
the minimum
of temperature to transport
processus,
in "Transport
processes
remains
non-turbulent
and
cold. The
studies
of
in the middle
atmosphere",
Reidel
Publisbip•
the energy
budget
of the mesosphere
(Ebel, 1984)
Company,
1987.
have shown
that these two processes
are very Ebel,
A., Contributions
of gravity
waves
to the
efficient
above
70 km
and
may
contribute
by a few
momentum,
heat
and turbulent
energy
budget
of
tens
of Kelvins
per day
to the heat
budget
of the
the upper
mesosphere
and
lower
thermosphere,
J,
upper
mesosphere.
It is then possible
to explain
%tmos.
Terr, Phys,,
4--6,
727-737,
1984.
by this mechanism
how a temperature
inversion Hauchecorne,
A. and M.L. Ghanin,
Density
and
layer, with an amplitude
as large as 40 K,
temperature
profiles
obtained
by lidar between
persists
during
several days,
by the continuous 30 and 70 km, Ge0Dhys
, Res. Letters, 7,
breaking of gravity waves
occurring preferably in
564-568, 1980.
this layer.
Holton,
J.R., The role of gravity wave
induced
Conclusion
drag and diffusion in the momentum
budget of
the mesosphere, J. Atmos. $Ci,, 3__9,791-799, 1982. Rayleigh lidar observations of the mesosphe- Lindzen, R.S., Turbulence and stress owing to ric temperature in south of France have shown the gravity wave and tidal breakdown, J, Geophys,
frequent existence of a temperature inversion, Res,, •6, 9707-9714, 1981.
that persists during several days at the same Matsuno, T., A quasi one-dimensional model of the altitude and exists simultaneously above the two middle atmosphere circulation interacting with lidar sites distant by 550 km. The statistical internal gravity waves, J. Meteor. Soc, Japan,
characteristics of this inversion, obtained from 6--0, 215-226, 1982.
more than 500 nightly mean profiles, ,• are as Meek , C E ß ., I M . . Reid and A.H . Manson ,
follows ß Observations of mesospheric wind velocities.
- The altitude of the minimum
of temperature has
II.
Cross-sections of power spectral density
an annual variation with values ranging from 55 for 48-8 h, 8-1 h, 1 h-1 min over 60-110 km for to 72 km in winter and from 70 to 83 km in 1981, Radio Science, 20, 1383-1402, 1985. summer ; Schmidlin, F.J., Temperature inversions near
- The probability of occurrence of the tempera-
75 km, Geophys. Res, Letters, •, 173-176, 1976.
ture inversion has a semi-annual
variation with
Schoerberl, M.R. and D.F. Strobel, The zonally
a higher maximum
in winter (70 %) than in
averaged circulation of the middle atmosphere,
summer
(35 %) and a lower minimum
in May than
J. Atmos. Sci., 3--5, 577-591, 1978.
in September.
Schoerberl,
M.R. and D.F. Strobel and J.P.
The comparison
of the characteristics of the
Apruzese, A numerical model of gravity wave
temperature
inversion and of the MST
radar echoes
breaking and stress in
the mesosphere,
J__.
in the mesosphere,
and a simple estimation of the
Geophys
Res., 88, 5249-5259, 1983.
amplitude
growth
with height of a gravity wave, Thomas,
R.J., C.A. Barth and S. Solomon,
Seasonal
lead us to conclude
that the two
phenomena
have
variations
of ozone
in the upper
mesosphere
and
the same origin, that is to say the turbulent
gravity waves, Geophys.
Res. Letters, 1!,
field generated
by the breaking of gravity waves.
673-676, 1984.
This breaking
occurs preferably above the Vincent,
R.A. and D.C. Fritts, A climatology
of
secondary
minimum
of temperature
and
can
maintain
gravity wave
motions
in the mesopause
region
at
its
existence during several days with an
Adelaide, Australia, J, Atmos, Sci,, 44,
amplitude
as large as 40 K.
748-760, 1987.
Acknowledgments. The authors are grateful to