The Economies and Dimensionality of
Prototyping: Value, Time, Cost and Fidelity
The MIT Faculty has made this article openly available. Please share
how this access benefits you. Your story matters.
Citation
Tiong, Edward, Olivia Seow, Kenneth Teo, Arlindo Silva, Kristin L.
Wood, Daniel D. Jensen, and Maria C. Yang. “The Economies and
Dimensionality of Prototyping: Value, Time, Cost and Fidelity.”
Volume 7: 30th International Conference on Design Theory and
Methodology (August 26, 2018).
As Published
http://dx.doi.org/10.1115/DETC2018-85747
Publisher
ASME
Version
Final published version
Citable link
http://hdl.handle.net/1721.1/120042
Terms of Use
Article is made available in accordance with the publisher's
policy and may be subject to US copyright law. Please refer to the
publisher's site for terms of use.
THE ECONOMIES AND DIMENSIONALITY OF PROTOTYPING: VALUE, TIME, COST AND
FIDELITY
Edward Tiong
Ring Theory Pte. Ltd., Singapore
Olivia Seow
Ring Theory Pte. Ltd., Singapore
Kenneth Teo
SUTD-MIT International Design Centre, Singapore Arlindo Silva SUTD-MIT International Design Centre, Singapore Kristin L. Wood SUTD-MIT International Design Centre, Singapore Daniel D. Jensen
U.S. Air Force Academy Dept. of Engineering Mechanics USAF Academy,
Colorado, USA
Maria C. Yang
Massachusetts Institute of Technology Cambridge, MA, USA
ABSTRACT
Economic use of early stage prototyping is of paramount importance to companies engaged in the development of innovative products, services and systems because it directly impacts their bottom-line [1, 2]. There is likewise a need to understand the dimensions and lenses that make up an economic profile of prototypes. Yet, there is no reliable understanding of how resources expended and views of dimensionality across prototyping translate into value [3, 4]. To help practitioners, designers, and researchers leverage prototyping most economically, we seek to understand the tradeoff between design information gained and the resource expended into prototyping to gain that information [5]. We investigate this topic by conducting an inductive study on industry projects across disciplines and knowledge domains, while collecting and analyzing empirical data on their physical prototyping process [3]. Our research explores ways of quantifying prototyping value and reinforcing the asymptotic relationship between value and fidelity [6]. Most intriguingly, it reveals insightful heuristics that practitioners can exploit to generate high value from low and high fidelity prototypes alike.
MOTIVATION AND INSPIRATION
Prototyping is a fundamental activity in development process of product, service, and system design [4, 7]. In particular, physical prototyping is pointed out by practitioners as one of the most important and effective tools in their early concept work [8]. Industry titans like Ford and Dyson - renowned for achieving revolutionary designs of the Model T and Cyclonic Vacuum after numerous prototypes - are not the only ones realizing the effectiveness of prototyping [9, 10]. The building of prototypes has been ubiquitous in the development of innovative products, services, and system across the many industries, even with leaner and more agile companies and teams[1] such that for a payment device as shown in Figure 1. The Design Innovation (DI) process exhibits exemplar cases of how practitioners employ prototyping to amplify designers’ abilities and achieve high efficacy in industry projects [11, 36, 42].
The applicability of prototyping to design practitioners has resulted in a surge in studies on prototyping recently - contributions include the role of prototypes in companies [3] and state-of-the-art guidelines on prototyping [1]. One particular work that is noteworthy is “Sprint” by Jake Knapp of Proceedings of the ASME 2018 International Design Engineering Technical Conferences and Computers and Information in Engineering Conference IDETC/CIE 2018 August 26-29, 2018, Quebec City, Quebec, Canada
DETC2018-85747
Google Ventures. Our industrial colleagues are experiencing a wild expansion of quick prototyping uses based on “Sprint”, in an attempt to shortcut endless debate cycles, compress months of time into a single week by testing risky ideas and getting clear data from realistic prototypes, before making expensive commitments [46].
Figure 1: Physical prototypes made by SUTD-MIT International Design Center’s DI Team exploring concepts
for a new payment device for children
Notwithstanding the above, there remain significant gaps in this field that compels us to investigate - especially in areas and from perspectives that will be pertinent and valuable to practitioners.
Many existing studies tend to focus on student design teams in universities which do not closely reflect the scale at which companies conduct their design processes in terms of cost, schedule, and performance [12]. Besides, these contributions often involve controlled and constrained experiments that produce undeniably reliable and significant results, but are admittedly theoretical and do not necessarily reflect the full spectrum of complexity that practitioners face in multi-dimensional industry problems [2]. In many cases, publications use anecdotal stories from industry practice to support their viewpoints rather than systematically answer hypotheses. By doing so, these publications emphasize and underscore the need for more in-depth studies since the examples are used to illustrate rather than generalize [13, 14–19].
Overall, there is a strong need for research around physical prototyping, especially how it is conducted in the industry. A realm of prototyping that is of particular interest to design practitioners is its economies. Prototyping in companies, unlike that in universities or research, directly affect the bottom-line of a project. As such, practitioners must balance the cost of testing concepts and the potential profits it will reap [20, 21]. The failure to do so, has led some organizations to avoid it in total due to the uncertain return on investment [2]. Because resource considerations, time and costs are the primary barrier to its application in industry, understanding how to prototype economically across various dimensions, can not only help companies leverage prototyping to save cost, but increase efficacy [2, 1].
It is the goal of this work to study the economies of prototyping as part of a design process, with the intention of developing targeted strategies and heuristics to assist designers, practitioners, and researchers to prototype effectively and economically.
Many of our industrial colleagues have expressed keen interest in this area stating that they are very excited to gain new insight into the most effective ways to prototype. They indicate that much of their decision making process regarding prototyping come from simply doing what they’ve done in the past as opposed to seeking to enhance the prototyping process.
RESEARCH QUESTIONS
In this research, we explore an important aspect of prototyping for practicing designers and engineers - its economies. For clarity, we will define some important terms. The use of the group of words “economies”, “economic” and “economical” in the context of prototyping is in accordance with what Oxford Dictionary defined as giving good value or return in relation to the money, time or effort expended. [45]
Prototypes are used to gain design information that will allow a team to advance "in product [systems] development with minimal expenditure of time and cost” [1]. "There may well be a trade-off between the design information gained and the resources expended to gain that information," and we seek to understand this trade-off more profoundly [5].
Our research is characterized by a few key elements that are inspired by Lauff’s works in studying prototypes from empirical works in companies [3]. Firstly, we examine projects that "create physical end products, which have been studied less than digital products" - with the aim of contributing to this comparatively less explored sub-field [3]. Secondly, we study prototyping in industry projects rather than academic projects or experiments. This focus is because prototypes are considered critical to the success of a company or organization; yet, there is not a solid understanding of how it facilitates success [3]. Thirdly, the study is conducted by observing design teams execute the project in their natural work environment rather than as a controlled experiment. This inductive study aims to capture the full spectrum of complexity practitioners face and allows insights relating to industry projects to emerge organically [22].
The goal of our work is to be able to understand the economies of prototyping and the corresponding dimensionality - more concretely, how fidelity (estimated by time, cost and effort) affect its value (design information gained) - through empirical study in the natural work environment where design teams prototype for industry projects.
Combining our motivations with the work by leading researchers in this field, the driving research question we seek to answer is: What is the tradeoff between design information gained and the resources expended in prototyping to gain that information?
Other supporting questions we would like to answer include: How does the fidelity of prototypes affect its value? How do we quantify the value of prototypes? What strategies can we implement to be more economical and cost-efficient in prototyping?
RESEARCH METHODOLOGY
Figure 2: Research Methodology
This paper begins investigating this research topic through a process of research clarification. By studying the execution of an industry project (the driving project), the research problem will be refined - to one that is both academically and practically worthwhile and realistic - as data is recorded for analysis [23]. The research hypotheses and questions will then be investigated through the iterative development of quantitative models and qualitative analysis; which will allow us to explore more open-ended questions about how something is happening and why it is occurring [24]. We will then abstract findings into recommendations and heuristics that can help future practitioners develop more cost-efficient prototyping strategies. Finally, the paper qualitatively compares the findings with two supporting industry projects to assess its validity in different contexts. The methodology is illustrated in Figure 2.
INDUSTRY PROJECT
For this research, we study the prototyping efforts of one industry project as the driving case for analysis and later introduce two other multidisciplinary industry projects as supporting cases to validate our findings.
To provide some context to these projects, we introduce the Design Innovation Process Model (shown in Figure 3) - a systematic approach used in these projects for achieving success [11, 42]. This model is distinguished by its approach of
breaking down design innovation process into 4 main areas or phases - Discover, Define, Develop and Deliver.
Figure 3: IDC’s Design Innovation Process Model, with Mindsets
Before we proceed to describe the driving project - a Fintech B2B2C Product - it is noteworthy that this industry project was executed as a participatory design project, where the authors were also participants in the project.
FinTech B2B2C Product, Driving Project
As part of the Singapore’s ‘Smart Nation’ agenda to become a cashless society, a leading local bank tasked the design team with creating an innovative product-service that will help move the young generation onto digital payment [43]. The multi-disciplinary 4-person design team iteratively diverged and converged on ideas, producing more than 200 prototypes over the course of 6 months. Eventually, the team narrowed down on a best-fit design concept that was designed for manufacturing and acclaimed by both the client and users [25].
Figure 4: Overview of design concepts prototyped across all phases of the FinTech B2B2C Product project
To ensure consistency in our analysis, only the first phase of the entire design process will be studied - this is indicated by the red box in Figure 4. In this phase, the team explored and diverged to gather information through generating a range of new concepts [1]. Prototyping efforts for 50 unique design concepts were executed in parallel to more cost-efficiently discover unseen constraints and opportunities, enumerate more diverse solutions, and obtain more authentic and diverse feedback [26, 27]. Here, a prototyping effort is defined by Moe, et al. as the creation of prototypes and conduct of tests for a single design concept [12]. These prototypes were created with varying fidelity using an array of techniques such as 3d-printing, laser cutting, rendering, and DIY [36].
3-hour design reviews where the clients interacted with the prototypes were organized [8] so that the team could effectively convey the concepts [8] and obtain answers to specific design questions [4]. Because the clients did not fully understand their needs [28], this method was particularly useful in uncovering latent needs [29], understanding underlying principles [30], as well as sharpen categorical boundaries [31].
DATA COLLECTION
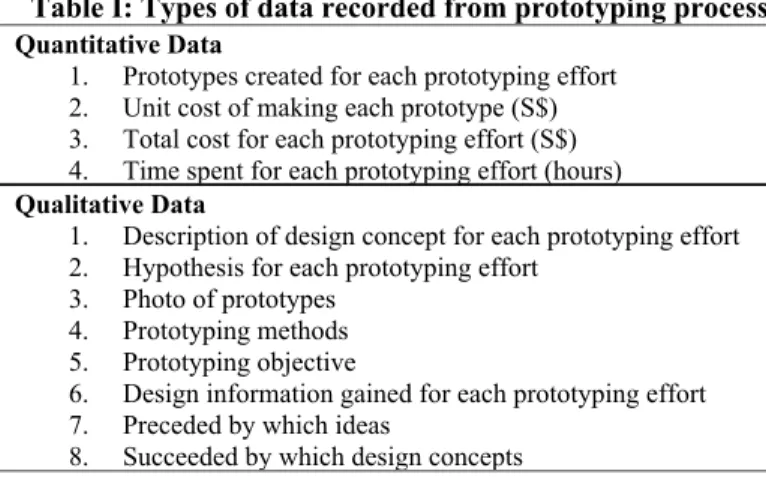
The data that was collected from this project for research purposes came from a multitude of sources: feedback from user during testing and interviews, comments from clients during review sessions, design team’s internal records of prototyping process and a retrospective review of the prototyping journey. The complete set of types of data captured for research purpose is described in Table I.
Table I: Types of data recorded from prototyping process Quantitative Data
1. Prototypes created for each prototyping effort 2. Unit cost of making each prototype (S$) 3. Total cost for each prototyping effort (S$) 4. Time spent for each prototyping effort (hours) Qualitative Data
1. Description of design concept for each prototyping effort 2. Hypothesis for each prototyping effort
3. Photo of prototypes 4. Prototyping methods 5. Prototyping objective
6. Design information gained for each prototyping effort 7. Preceded by which ideas
8. Succeeded by which design concepts
By virtue of letting the prototyping process in the FinTech B2B2C project unfold organically under the management and planning of the design team, we managed to collect a wealth of data that arguably captured a complete picture of the prototyping process. From this set of data, we build our models.
MEASURING THE ECONOMIES OF PROTOTYPING
Before we build our model, we have to define some terms clearly then decide what our input and output are. We reiterate
that the goal of this study is to understand the economies of prototyping as part of a design process, with the intention of developing targeted strategies and heuristics to assist designers, practitioners, and researchers to prototype effectively and economically. Accordingly, we begin by defining what prototyping economies mean in the context of this study.
The economies of prototyping is captured in how designers choose the ‘cheapest’ (lowest cost) way to prototype that is still effective; using fast and inexpensively methods to build prototypes that are sufficient to provide the required information [33]. Thus, we suggest that the input be fidelity (time, cost, effort) [4] and the output be value (design information gained). Understanding the relationship between the investment on prototyping activities and design success [4] is critical for a practitioner to make decisions [1].
Before proceeding, we set the stage for understanding fidelity and value by clarifying that the goal of prototyping in the Fintech project was to more deeply understand the clients’ needs for form factor of the payment device. As such, the prototypes were created primarily for its “implementation” - the method through which it performs the payment function [44]. Now, we are ready to quantify the input (fidelity) and the output (value).
Quantifying Fidelity
Other authors have suggested ways to measure fidelity such as using visual, breadth, depth, and interactivity dimensions [6], or with comparing it with respect to the final model [34]. But quantifying fidelity has its inaccuracies. It is influenced by the particular design context [5] and the stage of development [4].
Therefore we propose - on the premise that the building of prototypes is a trade-off between fidelity and the time, effort, and cost required to produce that prototype [4] - that resources expended can be a justifiable estimator for fidelity.
It is worthy to note that time, cost and effort expended in an prototyping effort is obviously related and often proportionate - greater effort consumes greater time and increases man-costs. As such, they should not be treated as independent variables. Henceforth, it is sufficient to choose just one out of these three factors.
In this case, we choose to use time expended as it directly translates to the realization of a prototype given a fixed team size, expertise, and access to resources. This is sufficient and more suitable than cost, which is primarily driven by the choice of prototyping method and may change over time [20]. For our study, we define the time spent for each prototyping effort as the number of hours that is expended in translating each of 50 unique design concepts from a sketch into a physical prototype that is capable of interaction with the clients, users, and stakeholders.
Value of Prototyping and Design Information
In quantifying the value of prototyping, we first establish that “need” information and experience to derive insights or intuitive foresights resides with the customers, users, and stakeholders in product-service-system development [28]. On this premise, the value of prototyping in the industry project lies in uncovering such “need” information that moves the team forward in system development [1]. The design information gained from each prototyping effort becomes the obvious choice of data that represents value and to be used as output for our analysis.
From the 50 prototyping efforts that was executed in the exploration phase of our driving project, a total of 19 unique pieces of design information was gained. These 19 pieces of design information were derived by synthesizing feedback that the clients provided during a three hour long design review session where 50 design concepts were presented and discussed using prototypes. The feedback was then categorized based on its affinity and recurrence into 19 unique pieces of design information.
To transform these textual design information into quantitative data that we can plot against time, we developed a way to quantify a value for every design information. A rubric to measure the value of design information was developed and tested for inter-rater reliability with 4 members of the design project. It was iterated on multiple occasions until we were confident of using it in the analysis. The 19 unique pieces of design information were then rated on a scale of 1-4 described in Table II.
Table II: Rubric to rate value of design information Value Score Impact of Design Information
1 Confirms a known or existing need. 2 Reveals an incremental latent need. 3 Deepens understanding of a key need. 4 Reveals a disruptive latent need.
For examples, the insight on financial literacy was rated to have a value of 4 as it revealed a disruptive opportunity for the design problem, while the design information that merely reinforced the need for the product to be cost-efficient on a large scale was rated with a score of 1. Ratings of some design information are shown in Table III.
Table III: Design Information and Score (truncated) Need Information Rated Value
Score 1. Need to teach financial literacy
2. Need to be avoid complex implementation 3. Need to build on existing payment behaviour 4. Need to be universally compliant
5. Need to have personalization
6. Need to be cost-efficient for large volumes ... 4 3 3 2 3 1 …
Here, we allude to that fact that some prototyping efforts elicited more than one piece of design information while others yielded none. Hence, to calculate the aggregate value captured by each prototyping effort, we summed up the value score of all the design information they elicited or created.
Concretely, we observed that the ‘Minimalist’ design – shown in Figure 5 - revealed only one piece of information about the clients’ latent need for a purely functional design to target an older demographic of their target users. This design information was rated as incremental - giving it a total score of two (2). On the other hand, the ‘LED Vending Token’ design elicited three pieces of information: the disruptive latent need to have financial literacy integrated in the device, an incremental latent need to have the design compliant with all their payment infrastructure island-wide, as well as a deepen key need to avoid complex implementation due to the diversity of stakeholder involved. These design information were rated four (4), two (2) and three (3) respectively, giving it an aggregated score of nine (9).
Figure 5: ‘Minimalist’ (left) and ‘LED Vending Token’
The aggregated scores of all prototyping efforts were subsequently normalized using the minimum and maximum aggregated value score of 0 and 9 respectively. Accordingly, ‘Minimalist’ and ‘LED Vending Token’ prototyping efforts normalized value scores are 0.22 and 1.
With the input and output clearly defined and quantified, we can proceed to build models to analyze the relationship.
PLOTS AND VISUALIZATIONS
A total of 50 distinct prototyping efforts were executed in this phase, providing us with 50 data points to analyze. Each prototyping effort was executed for a single design concept; while more than 50 prototypes were created due to exploration and refinement of the design ideas, only 50 prototypes representing each design concept were presented to the clients [12]. It is important to note that the 50 prototyping efforts are recorded in the same stage of the design process. By constraining our analysis as such, we necessarily establish consistency across all our data points.
Figure 6: Normalized Value vs Fidelity
We created a scatterplot using the 50 data points and observed a distribution with a mean normalized value of 0.391 and a high Pearson Correlation Coefficient of 0.530, indicating a strong correlation or high degree of association [35].
Next, we tested fitting various regression models to the data. As observed in Table IV, fitting a 2nd order polynomial curve yielded the highest r-squared value of 0.284. However, the intercept and coefficients of the 2nd order polynomial curve was not statistically significant, yielding a p-values of 0.195, 0.082 and 0.6296.
Table IV: r2-values for various trend-line fits
Trend-line Fit linear expo poly-2 log
All data points 0.281 0.16 0.284 0.265 On the other hand, fitting a linear regression model to the data, as shown in Figure 6, produced relatively good results with an r-squared value of 0.265. More importantly, its intercept and coefficients are statistically significant with p-values of 0.0086 and 7.55e-0.5 respectively. The linear regression model is defined by the following equation:
Normalized Value = 0.16432 + 0.0700 * Fidelity It is important to note that the low r-squared value observed in Table IV stems from the nature of how the design information was obtained; subjectivity of human factors such as interaction and psychology causes less of the variance to be explained by the model. Nonetheless, this is acceptable because we are using the model to understand relationships and outliers rather than predict.
To spot the outliers in the model, we first calculate the standard deviation of its residual, which turns out to be 0.204352. From this, we can identify which data points have residuals of more than twice the standard deviation of the residuals. Accordingly, two outliers at [1, 0.77] and [0.54, 1] were identified with residual 0.5435 and 0.4857 respectively.
We will later study these outliers in more details as part of our analysis.
At this juncture, we allude to the perspective that the use of this fitted curve is to give us a basis to compare with theory - its spread and statistical characteristics are not the most important parts of our analysis. Rather, the most critical thing is what the distribution of the data points tell us. The general trend, the outliers and the vertical effects all reveal important insights which we will discuss in greater detail in the following section.
DISCUSSION General Trend
At first glance, the data points signifying each prototyping effort seems to be scattered randomly without a pattern. However, the high degree of Pearson’s Correlation Coefficient tells us that there is a strong correlation between the fidelity and value [35]. We also observe a prevailing void in the bottom right and top left corners of the plot - indicating that very few prototyping efforts were of high fidelity and low value or low fidelity and high value. As such, it would be fair to say that higher fidelity prototypes tend to yield greater value.
Vertical Effect in Subplots
To derive deeper insights into the distribution of data points, we can analyze the vertical effect by splitting them into two subplots: low fidelity, and high fidelity for prototyping efforts that expended five or more man-hours. The difference in the mean value of each subplot reinforces our observation that higher fidelity prototypes tend to yield greater value. Expectedly, higher fidelity prototypes would entail higher cost and time expended.
Left Half - (Low Fidelity) n = 39
mean value = 0.339
Right Half - (High Fidelity) n = 11
mean value = 0.576 Figure 7: Low and high fidelity subplots
From the left subplot in Figure 7, we observe that low fidelity prototypes generated low to moderately high value. These low fidelity prototypes were primarily modified commercial products or created from basic craft - which implies the use of tools and components readily available, easy
to use and require little overhead maintenance or special training to operate [36]. By leveraging DIY design principles, effort invested in prototyping can be substantially reduced while improving build quality [36], such as the ones shown below in Figure 8.
Figure 8: ‘Card Pack' (left) achieved substantial representation using basic materials like cardboard, paper
printing, and a ring link, while ‘Super Sticker’ (right) leveraged off-the-shelf adhesive pad to demonstrate its
reusable adhesion concept.
By studying the higher fidelity prototypes in the right half, we observe that the increased fidelity translates into realizing more dimensions of a prototype - multiple features, components of interactivity, increased visual resolution [6]. Prototypes in Figure 9 show how these enhanced dimensionalities add to the possibility of eliciting different design information from the client, user and stakeholder, resulting in a higher valuation.
Figure 9: ‘Adaptable Token' (left) and ‘Bezel Coin' (right) - prototypes with highest fidelity - achieved proportionately
high dimensions of visual resolution, features sets and interactivity e.g. retractable cord and rotating bezel. Impact vs Time
McElroy’s “Prototyping for Designers” postulates that there is “a balance between the time and effort it takes to make a prototype and the value you’ll get from testing at that specific fidelity” [6]. It illustrates the three phases of that relationship as shown in Figure 10. McElroy believes that there is a right amount of time and effort that should be expended to achieve the optimal impact of prototyping; anything less would be not helpful and anything more, a waste of resources [6].
Figure 10: McElroy suggests that there is a balance between time spent and the value gained [6].
McElroy’s work provides us with more perspective for understanding the relationship between value and fidelity. We observe a qualitative trend in our data distribution that is not too far from McElroy’s proposal. Impact increases with fidelity and the observation of an asymptotic effect on the right-hand side suggesting a limit to the amount of value high-cost prototypes can yield even with its added dimensions. With more data points, we may even postulate that a logarithmic model will fit our data better than a linear model.
On the other hand, McElroy’s conjecture that there exists distinct three categories of impact for prototyping depending on the time spent deviates from what we observed. Firstly, we could not pigeon-hole all low fidelity prototypes as unhelpful, having discussed examples of low fidelity prototypes with high value. We also found - on the other end of the model where McElroy claims high fidelity prototypes are wasteful - cases of uniquely valuable prototyping efforts.
Uniquely Valuable Prototypes
Of the 50 prototyping efforts, exactly five (5) elicited a unique piece of design information that, otherwise, would not have been discovered by other prototyping efforts. They are denoted by orange star-shaped points in Figure 11. Two of them fell in the “time wasted” region, leading us to conclude that while these prototyping efforts are comparatively average in value, they are critical when evaluated on a macro level.
Figure 11: Orange star-shaped points reflect prototyping efforts that elicited a unique piece of design information.
Categorizing Prototypes
Given the spread of our empirical data points, we learn that we can derive deeper meaning when understandings these plots spatially. How then can we better categorize the value-fidelity relationship given the several contrary cases we found in McElroy’s approach to segmenting the space?
Figure 12: Segmenting prototyping efforts into four categories
Table V: Four grades of prototyping economics Green Highly Economical
Increasing returns to scale prototyping Cheap and valuable prototypes Yellow Moderately Economical
Constant returns to scale prototyping Expected prototypes
Orange Lowly Economical
Decreasing returns to scale prototyping Cheap but not-so-valuable prototypes Red Not Economical
We propose differentiating the space into four (4) distinct regions, guided by McElroy’s trend-line, illustrated in Figure 12 and further explained in Table V. These spatial segmentations give us a new perspective to study the outliers. From the green region, we learn how strategically employing DIY design principles can help designers create highly economical prototypes. While in the red region, amidst prototypes that the design team might not have created again given a chance, there exist prototypes that generated unique value as shown before in Figure 11. Hence, we can conclude that prototypes which are not economical are not necessarily bad or without use. On the contrary, they may have strategic purposes.
FINDINGS
The findings from the data and analysis may be expressed as a set of prototyping heuristics for economy:
Aim for increased dimensionality
Creating higher fidelity prototypes does not result in the generation of increased value. To ensure prototyping economically, the results suggest to aim for increased prototype
dimensionality as more resources are expended - as illustrated in Figure 9. The increase in breadth and depth of functionality, interaction, and visual resolution will better the chances of revealing unique and deeper design information [6]. Furthermore, prioritizing which dimension is important for a specific prototype will help designers focus and save time and effort [6].
Test core concepts with low fidelity prototypes
Low fidelity prototypes that are easy, fast and inexpensive to make [6] are not necessarily unhelpful, but may be strategically critical. Especially in the early stages of development, the relaxation of prototyping requirements does not have an adverse effect on final performance [1], such as those shown in Figure 13. Low fidelity prototyping fosters a sense of forward-progress through the "fail fast, fail cheap” attitude [37], making them particularly economical at testing core concepts, basic assumptions, and user mental models [6]
Figure 13: Low fidelity prototypes that were used to test basic assumptions of toy-like designs and core concepts like
integrating with a coin bank.
Increase low fidelity prototyping value with DIY design
Low fidelity prototyping that employs DIY design principles tend to yield more value [36]. These principles are aimed at reducing cost, time and effort of fabrication while improving the outcome [36]. Two particular methods of DIY design that was prevalent in the case study were "Hacking", which repurposes, modifies and redeploy an existing product, and "Basic Craft", which employs tools, components, and materials that are readily available [36]. These methods are illustrated in Figure 8.
Figure 14: High fidelity prototypes that ended up being wasteful because its larger idea had not been tested first.
Use high fidelity prototypes to test small details or features
High fidelity prototyping efforts have a purpose and strategic importance. Prototypes with higher fidelity representations, such as those in Figure 14, prove to lead to more accurate interpretations by third parties reviewing the design [38]. In particular, high fidelity physical prototypes are found to be particularly valuable when used to test small details rather than big ideas [6].
Be especially purposeful with higher fidelity prototypes
Being purposeful is key for high fidelity prototyping efforts. In general, a prototyping effort should answer a specific question [39] or resolve a unique design problem or opportunity [1]; like those shown in Figure 15. Accordingly, to be economical, higher fidelity prototyping efforts should be matched by the level of detail of questions asked [7].
Figure 15: ‘Emoji Watch’ and “ Shoe Disc” are high fidelity prototypes that were differentiated substantially to gain unique design information on end-user interactivity as well
as usage compliance across all payment infrastructure. Augment physical prototyping with other media and forms of design language
Augmenting physical prototypes with multi-media, such as videos and slides, can help make prototyping efforts more economical [8]. For example, virtual prototypes may drastically lower costs [40] and can be made more rapidly than physical prototypes [41], yielding roughly equal performance [40]. An example of this is the rendered prototype as seen on the left side of Figure 16.
Figure 16: A single design concept was realized as a physical prototype (right) - to demonstrate its interactivity -
and also as a rendered image (left) to illustrate it visual elements; each eliciting different design information.
SUPPORTING INDUSTRY PROJECTS
To validate the findings we abstracted from studying the driving project, we will use two supporting industry project that similarly employed prototyping heavily in the design process. An overview of the supporting projects with respect to the driving project is described in Table VI. By using two different industry projects, it aids in our validity of creating a holistic prototyping understanding [3]
Table VI: Overview of case projects Driving Project Supporting Project 1 Supporting Project 2 Industry FinTech SpaceTech Finance Project Nature B2B2C Product Technology R&D System Design Duration 6 months 12 months 2 months Team Size 4 people 2 people 3 people SpaceTech Technology R&D, Supporting Project 1
The objective of this project was to create a novel additive manufacturing (AM) process for use in hybrid rocket propulsion [7] by the client, a space start-up company. The team deconstructed the project into critical subsystems (Figure 17) and prototyped up to 20 iterations in each; low fidelity to high fidelity prototypes helped refine the technology-driven product [32].
Figure 17: Extruder head prototypes Finance System Design, Supporting Project 2
A design team was engaged by a leading global investment firm to design and deliver a system for 326 employees that will augment their use of the new activity-based workspace. Concretely, the solution had to be a compact and modular kit that stores and organizes an employee’s office accessories in an activity-based work environment while being easily portable. To meet an aggressive deadline and cycle time of just three weeks, the team procured, modified and combined off-the-shelf products to create the prototypes (Figure 18) which they used to gather feedback from employees.
Figure 18: Modular kit system prototypes VALIDATION OF FINDINGS
The ‘Finance System Design’ project reinforced many of our findings with their prototyping execution. The design team was observed using DIY design principles to create low cost, high impact prototypes were tested with more than 300 users. By procuring, modifying and combining existing commercial products, they created prototypes with high dimensionality, at a low cost and in a short time. Additionally, every prototype was purposefully planned to address hypotheses about each specific demographic of their users. Being highly economical in their approach, they achieved high user satisfaction with just eight (8) prototypes and two (2) iterations in a span of eight (8) weeks.
Similarly, the ‘SpaceTech Technology R&D’ project revealed practices that were aligned with our findings. In searching for prototyping the FDM x-y-z motion stage, the design team moved from low fidelity prototypes to test basic assumptions to high fidelity prototypes that tested smaller engineering details. [32] They also augmented their physical prototype with low cost virtual prototype through CAD models to reduce cost [32].
LIMITATIONS
The results, discussion, and findings in this study include some obvious caveats associated with the driving case study:
1. The extent to which design information is elicited depends not only on the fidelity of the prototype but how it is tested with the clients and users.
2. An average of 3.6 minutes spent on each prototyping effort with the clients and users was less than ideal as it limited the depth of discussions. 3-hour duration review sessions were much more useful but induced mental fatigue and affected the quality of discussions.
3. The biases of the clients - influenced by factors like their background in design, company culture, and demographics regarding age, gender, race, and experience - were not accounted for in this study. 4. The prototyping audience clients with agendas and
considerations that are starkly different from those of end-users.
5. The design team engaged, for the most part, a total of five (5) people from the client group.
CONCLUSIONS AND FUTURE WORK
The bottom line associated with prototyping makes the understanding of its economies particularly relevant to companies, designers, practitioners, and researchers. Besides providing practitioners with insights into how resources expended into prototyping translate into value, our work presents design teams with prototyping strategies that can help them effectively reduce cost while increasing efficacy.
There is much more to be explored in the realm of prototyping economically. What other ways can we measure fidelity to encompass a great degree of the time, cost, and effort that is invested in it? How can we measure the different dimensions of a prototype's fidelity consistently as McElroy's proposed? How does the gathering for design information change when we test prototypes with end-users instead of clients? How does the prototyping economies change with a service, system, or digital products? How do the demographic biases of designers, user, and clients affect the economies of prototyping? How do we further validate and deepen these results against more industry projects of a diverse nature? How do we prototype to yield as many design information as possible? Besides fidelity, does the way we test prototypes with clients and users affect the design information we gain from them? What other variables can we use as the input and output when measuring the economies of prototyping? How do the type of prototypes – “implementation”, “look and feel” and “role” - affect our understanding of their fidelity and economies? How else can we rate design information obtained from prototyping? How do we find the minimum subset of prototypes that we need to create to capture the maximum amount of design information?
ACKNOWLEDGMENTS
This work is supported by the Singapore University of Technology and Design (SUTD, sutd.edu.sg) and the SUTD-MIT International Design Centre (IDC, https://idc.sutd.edu.sg/). We would like to sincerely thank Maylizabeth Yap, for her contributions.
REFERENCES
1. Camburn, B., Viswanathan, V., Linsey, J., Anderson, D., Jensen, D., Crawford, R., Otto, K., Wood, K., 2017, “Design prototyping methods: State of the art in strategies, techniques, and guidelines,” Design Science, 3, E13. doi:10.1017/dsj.2017.10
2. Dow, S., and Klemmer, S., 2011, Design Thinking: The efficacy of prototyping under time constraints, Springer, Berlin, Heidelberg.
3. Lauff, C., Kotys-Schwartz, D., and Rentschler, E., 2017, “What is a Prototype? Emergent Roles of Prototypes From Empirical Work in Three Diverse Companies,” 10.1115/DETC2017-67173.
4. Yang, M., 2005, “A study of prototypes, design activity, and design outcome,” Design Studies, 26(6), 649-669.
5. Hall, R., 2001, “Prototyping for usability of new technology,” International Journal of Human-Computer Studies, 55(4), 485-501.
6. McElroy, K., 2017, Prototyping for designers: developing the best digital and physical products, O'Reilly Media, Inc, Sebastopol, CA.
7. Hartmann, B., 2009, Gaining design insight through interaction prototyping tools, Stanford University. 8. Elverum, C., & Welo, T., 2014, “The role of early
prototypes in concept development: insights from the automotive industry,” Procedia CIRP, 21, pp.491-496. 9. Womack, J., Jones, D. & Roos, D., 2008, The Machine
that Changed the World, Simon and Schuster. 10. Dyson, J. & Coren, G., 2001, Against the Odds: An
Autobiography, Texere, London.
11. Camburn, B., Auernhammer, J., Sng K., Mignone, P., Arlitt, R., Perez, B., Huang, Z., Basnet, S., Blessing, L., and Wood, K., 2017, “Design Innovation: A Study of Integrated Practice,” ASME 2017 International Design Engineering Technical Conferences and Computers and Information in Engineering Conference, ASME Paper No. DETC2017-68382. 12. Moe, R., Jensen, D., Wood, K., “Prototype
Partitioning Based on Requirement Flexibility,” ASME 2004 International Design Engineering Technical Conferences and Computers and Information in Engineering Conference, ASME Paper No. DETC2004-57221.
13. Thomke, S., 2003, Experimentation Matters: Unlocking the Potential of New Technologies for Innovation, Harvard Business Press.
14. Christensen, C. and Raynor, M., 2013, The Innovator’s Solution: Creating and Sustaining Successful Growth, Harvard Business Press.
15. Dodgson, M., Gann, D., and Salter, A., Think, Play, Do: Technology, Innovation, and Organization, Oxford University Press, 2005.
16. Kelley T., 2007, The art of innovation: Lessons in creativity from IDEO, America’s leading design firm, Crown Business.
17. Martin R., 2013, Design of Business: Why Design Thinking is the Next Competitive Advantage, Harvard Business Press.
18. Schrage, M., 2000,Serious play: how the world’s best companies simulate to innovate, Harvard Business School Press, Boston.
19. Verganti R., 2013, Design Driven Innovation: Changing the Rules of Competition by Radically Innovating What Things Mean, Harvard Business Press.
20. Austin, R. and Devin, L. 2003, Artful Making: What Managers Need to Know About How Artists Work , Financial Times Press.
21. Dahan, E., and Mendelson, H., 2001, “An extreme-value model of concept testing,” Management Science, 47(1), pp.102-116.
22. Charmaz, K., 2006, Constructing grounded theory, Sage Publications, California.
23. Blessing, L., and Chakrabarti, A., 2009, DRM: A Design Research Methodology, Springer, London. 24. Creswell J., 2012, Qualitative Inquiry and Research
Design: Choosing Among Five Approaches. Sage Publications.
25. Laseau, P., 1988,Graphic Thinking for Architects and Designers, 2nd ed, John Wiley & Sons Inc.
26. Buxton, B., 2007, Sketching User Experiences: Getting the Design Right and the Right Design, Morgan Kaufmann.
27. Tohidi, M., Buxton, W., Baecker, R., and Sellen, A, 2006, “Getting the right design and the design right,” SIGCHI Conference on Human Factors in Computing Systems, pp.1243– 1252.
28. Thomke, S., and Von Hippel, E., 2002, Customers as innovators: a new way to create value, Harvard Business Review.
29. Gartzen, T., Brambring, F., and Basse, F., 2016, “Target-oriented prototyping in highly iterative product development,” Procedia CIRP, 51, pp.19-23. 30. Colhoun, J., Gentner, D., and Loewenstein, J., 2008,
“Learning abstract principles through principle-case comparison,” Cognitive Science Society, pp. 1659–1664.
31. Boroditsky, L., 2007, “Comparison And The Development Of Knowledge,” Cognition, 102, pp.118–128.
32. Camburn, B., Arlitt, R., Perez, B., Anderson, D., Choo, P., Lim, T., Gilmour, A., Wood, K., 2017, “Design Prototyping of Systems,” ICED17: 21st International Conference on Engineering Design.
33. Dijk, L, Vergeest, J S M and Horvath, I, 1998, “Testing shape manipulation tools using abstract prototypes,” Design Studies, 19(2), pp.187-201. 34. Lim, Y., Stolterman, E. and Tenenberg, J., 2008, “The
anatomy of prototypes: prototypes as filters, prototypes as manifestations of design ideas,” ACM Transactions on Computer-Human Interaction (TOCHI), 15(7).
35. Karadimitriou, S., n.d., “MASH Correlation R”, from https://www.sheffield.ac.uk/polopoly_fs/1.536458!/fil e/MASH_Correlation_R.pdf
36. Camburn, B., Sng, K., Perez, K., Otto, K., Wood, K., Jensen, D., and Crawford, R., 2015, “The way makers prototype: principles of DIY design,” ASME 2015 International Design Engineering Technical Conferences and Computers and Information in Engineering Conference, American Society of
Mechanical Engineers,
pp.V007T06A004-V007T06A004.
37. Gerber, E. and Carroll, M., 2012, “The psychological experience of prototyping,” Design Studies, 33, pp.64-84.
38. Hannah, R., Joshi, S. and Summers, J., 2012, “A user study of interpretability of engineering design representations,” Journal of Engineering Design, 23, pp.443-468.
39. Otto, K. and Wood, K., 2001, Product Design: Techniques in Reverse Engineering and New Product Design, Prentice-Hall.
40. Camburn, B., Dunlap, B., Gurjar, T., Hamon, C., Green, M., Jensen, D., Crawford, R., Otto, K. and Wood, K., 2014, “A strategic method for design prototyping,” Journal of Mechanical Design, 137. 41. Christie, E., Jensen, D., Buckley, R., Ziegler, K. and
Crawford, R., 2012, “Prototyping strategies: literature review and identification of critical variables,” ASEE Annual Conference and Exposition, San Antonio, Texas.
42. Sng, K., Raviselvam, S., Anderson, D., Blessing, L., Camburn, B., and Wood, K., 2017, “A design case study: Transferring design processes and prototyping principles into industry for rapid response and user impact,” 21st International Conference on Engineering Design–ICED 2017.
43. Bhunia P., 2017, Accelerating drive towards cashless society in Singapore – A snapshot of recent initiatives, from
https://www.opengovasia.com/articles/7937-accelerati ng-drive-towards-cashless-economy-in-singapore-a-sn apshot-of-recent-initiatives.
44. Houde, S., Hill, C., 1997, What do prototypes prototype? In Handbook of Human-Computer Interaction, 2nd ed., Elsevier Science, Amsterdam.
45. Simpson, J. and Weiner, E., 1989, Economical, Oxford
English Dictionary, from
https://en.oxforddictionaries.com/definition/economica l
46. Knapp, J., Zeratsky J. and Kowitz B., 2016, Sprint: How to Solve Big Problems and Test New Ideas in Just Five Days, Simon & Schuster, New York.