Dynamics of freshwater plumes: observations and numerical
modeling of the wind-forced response and alongshore
freshwater transport
byDerek Allen Fong
B.S. Stanford University(1991)
M.S. Stanford University (1992)
Submitted in partial fulfillment of the requirements for the degree of DOCTOR OF PHILOSOPHY
at the
MASSACHUSETTS INSTITUTE OF TECHNOLOGY and the
WOODS HOLE OCEANOGRAPHIC INSTITUTION June 1998
©
Derek Allen FongThe author hereby grants to MIT and to WHOI permission to reproduce and to distribute copies of this thesis documejt in whole or in part.
Signature of Author ... . ...
Joint Pr gram m Physical Oceanography Massachusetts Institute of Technology Woods Hole Oceanographic Institution June 15, 1998 Certified by...- ---W. Rockwell Geyer Associate Scientist Thesis Supervisor Certified by... ... David C. Chapman Senior Scientist Thesis Supervisor Accepted by ... / Karl R. Helfrich
Acting Chairman, Joint Committee for Physical Oceanography Massachusetts Institute of Technology MASSACHUSETTS INSTITUTE Woods Hole Oceanographic Institution
Dynamics of freshwater plumes: observations and numerical modeling of the wind-forced response and alongshore freshwater transport
by
DEREK A. FONG
MIT/WHOI Joint Program in Oceanography
Submitted to the Massachusetts Institute of Technology/Woods Hole
Oceanographic Institution Joint Program in Oceanography in May, 1998 in partial fulfillment of the requirements for the Degree of Doctor of Philosophy
Abstract
A plume often results when a river discharges fresh water into the nearshore waters. This thesis combines both hydrographic data and idealized numerical sim-ulations to examine how ambient currents and winds influence the transport and mixing of plume waters.
The alongshore transport of freshwater is studied using a numerical model. In the absence of ambient currents, the downstream coastal current only carries a fraction of the discharged fresh water; the remaining fraction recirculates in a continually growing "bulge" in the vicinity of the river mouth. The presence of an ambient current augments the freshwater transport in the coastal current so that it matches the freshwater source.
The thesis also studies the wind-induced advection and mixing of a river plume, using data collected in the western Gulf of Maine (GOM) and idealized numeri-cal modeling experiments. The cross-shore structure of the GOM plume varies as function of fluctuations in alongshore wind forcing. Estimates of the alongshore momentum balance indicate an approximate Ekman balance. The model simula-tions of a plume forced by upwelling winds demonstrate that the plume thins and is advected offshore by the cross-shore Ekman transport. The thinned plume is susceptible to significant mixing because of the sheared horizontal currents.
Thesis co-supervisor: Dr. W. Rockwell Geyer
Title: Associate Scientist, Woods Hole Oceanographic Institution Thesis co-supervisor: Dr. David C. Chapman
Dynamics of freshwater plumes: observations and numerical modeling of the wind-forced response and alongshore freshwater transport
by
DEREK A. FONG
MIT/WHOI Joint Program in Oceanography
Submitted to the Massachusetts Institute of Technology/Woods Hole
Oceanographic Institution Joint Program in Oceanography in May, 1998 in partial fulfillment of the requirements for the Degree of Doctor of Philosophy
Abstract
A freshwater plume often forms when a river or an estuary discharges water onto the continental shelf. Freshwater plumes are ubiquitous features of the coastal ocean and usually leave a striking signature in the coastal hydrography. The present study combines both hydrographic data and idealized numerical simulations to examine how ambient currents and winds influence the transport and mixing of plume waters. The first portion of the thesis considers the alongshore transport of freshwater using idealized numerical simulations. In the absence of any ambient current, the downstream coastal current only carries a fraction of the discharged fresh water; the remaining fraction recirculates in a continually growing "bulge" of fresh water in the vicinity of the river mouth. The fraction of fresh water transported in the coastal current is dependent on the source conditions at the river mouth. The presence of an ambient current augments the transport in the plume so that its freshwater transport matches the freshwater source. For any ambient current in the same direction as the geostrophic coastal current, the plume will evolve to a steady-state width. A key result is that an external forcing agent is required in order for the entire freshwater volume discharged by a river to be transported as a coastal current.
The next section of the thesis addresses the wind-induced advection of a river plume, using hydrographic data collected in the western Gulf of Maine. The obser-vations suggest that the plume's cross-shore structure varies markedly as a function of fluctuations in alongshore wind forcing. Consistent with Ekman dynamics, up-welling favorable winds spread the plume offshore, at times widening it to over 50 km in offshore extent, while downwelling favorable winds narrow the plume width to a few Rossby radii. Near-surface current meters show significant correlations
be-tween cross-shore currents and alongshore wind stress, consistent with Ekman the-ory. Estimates of the terms in the alongshore momentum equation calculated from moored current meter arrays also indicate an approximate Ekman balance within the plume. A significant correlation between alongshore currents and alongshore wind stress suggests that interfacial drag may be important.
The final section of the thesis is an investigation of the advection and mixing of a surface-trapped river plume in the presence of an upwelling favorable wind stress, using a three-dimensional model in a simple, rectangular domain. Model simulations demonstrate that the plume thins and is advected offshore by the cross-shore Ekman transport. The thinned plume is susceptible to significant mixing due to the vertically sheared horizontal currents. The first order plume response is explained by Ekman dynamics and a Richardson number mixing criterion. Under a sustained wind event, the plume evolves to a quasi-steady, uniform thickness. The rate of mixing slowly decreases for longer times as the stratification in the plume weakens, but mixing persists under a sustained upwelling wind until the plume is destroyed. Mixing is most intense at the seaward plume front due to an Ekman straining mechanism in which the advection of cross-shore salinity gradients balances vertical mixing. The mean mixing rate observed in the plume is consistent with the mixing power law suggested by previous studies of 1-D mixing, in spite of the two-dimensional dynamics driving the mixing in the plume.
Thesis co-supervisor: Dr. W. Rockwell Geyer
Title: Associate Scientist, Woods Hole Oceanographic Institution Thesis co-supervisor: Dr. David C. Chapman
Acknowledgments
During my tenure as a Joint Program student, I have had the help, encourage-ment and friendship of so many people, that it is difficult to know where to begin and end this list. Even after one of the longest acknowledgment lists ever written in a Joint Program thesis is done, I am sure I will have forgotten some important people; to you I offer my apologies and implicit thanks.
This thesis was a long road to becoming a better scientist. My growth as a scientist is attributable to many teachers and colleagues at both MIT and WHOI. First and foremost, I owe a great deal of thanks to my advisors Rocky Geyer and Dave Chapman. I thank them for their excellent advice, their ability to point out important aspects in a particular problem, and above all, their efforts to help me hone my skills of scientific inquiry while respecting my own opinions and interests. I think I learned as much about how to approach my science as I did about river plumes. For both these experiences, I will be forever grateful. I would also like to thank the other members of my thesis committee-Glenn Flierl, Glen Gawarkiewicz, and Steve Lentz, who in spite of their own busy schedules, took the time to read my manuscripts and the thesis, attend meetings, and share their wisdom. I would like to especially thank Steve Lentz for his unlimited availability; because he was only a couple steps down the hall, he was often the guinea pig for the latest of my frequent fits of insight or dillusion. Bruce Warren, thank you for chairing my defense and providing a broader perspective on my thesis. Many thanks to a couple leaders in the field of plumes, Rich Garvine and Bill Boicourt for both their enthusiasm and encouragement, and comradery at the conferences. Special thanks to Michele Connor for her friendship and never-ending assistance in making sure I was able to reach my always busy advisor.
Many thanks to the members of the Red Tide team: Rocky, Rich Signell, Don Anderson, Peter Franks, Bruce Keafer, and Ted Loder. I cannot thank Rich enough for his assistance with a myriad of computer-related questions and his invaluable mentorship with the Blumberg-Mellor model. Thanks, of course, are owed to Alan Blumberg who kindly allowed me to use his model. Thanks to Albert Fischer, I was able to use a scanner to incorporate figures from previous studies into the thesis. I would also like to acknowledge my insightful proofreader, Melissa Bowen.
Finally, I come to the people who made this whole experience more than just a chance to get piled higher and deeper. I first would like to thank the members of the original talented ten from 1992: Jay Austin, Natalia Beliakova, Lyn Har-ris, Stefan Lewellyn-Smith, Frangois Primeau, Jamie Pringle, Brian Racine, Miles Sundermeyer, and Bill Williams. Your friendship and sharing of the experiences were helpful innumerable ways. I would also like to thank other members of the P.O. legacy for their friendship: Juli Atherton, Melissa Bowen, Chris Edwards, Ari Epstein, Albert Fischer, Dan Goldner, Steph Harrington, Steven Jayne, Paula Fratantoni, Paul Robbins, and Sandra Werner. Thank you also to the many other
Joint Program students like Deb Hassler, Ann Pearson, and Sheri White who re-minded me that P.O. was not the center of the universe. To Julia Westwater in the Education Office, thanks for the amazing key lime pie recipe, your friendship, and always assisting me in those moments of crisis. Thank you to my friend and Stanford officemate Chris Rehmann whose scientific advice, friendship, and sense of humor have been of great value for so many years.
Some special thank yous are owed to some friends who helped me remember to partake in things like good food and recess. Brian and Kate Racine, thanks for sharing in the adjustment to life in New England. It was nice to be part of a second family. Craig Lee and Joanna Muench, thank you for sharing in my indulgences of exquisite food and music. Jay, you'll never be Minnesota Fats in either billiards ability or stature, but thanks for blowing aways some insolent spheres with me. Jessica Baker, Shannon McDaniel, Ellen Mecray, Greg Winston, the rest USGS/SEA gang, and members of the Falmouth Track Club: thanks for sharing what it's like to not be a student. Jess, a special thank you for rounding out what would have been an otherwise humdrum final few months with your good humor, friendship, and inspiration. Sandra, Steve, Ellyn Montgomery, Payal Parekh, and Bob Pickart-thanks for sharing the whole first marathon experience: it is one I'll never forget. Lyn and Frangois, you were terrific schoolmates, but more importantly, wonderful housemates and playmates.
I owe many thanks to some special housemates who made life much more bearable through their friendship and support over the past five and a half years. Thank you Peter (and Michelle!) Unrau for your wit, interest in bridge, the sailing adventures, and a shared passion for salt and vinegar. Frangois, you're a crazy Canadian, but you taught me so much (some good, some bad, some ugly); I know I would not have made it though generals without your mutual bickering, studying, and suffering. Lyn, thank you for your friendship, warm home (even sans coal!), and teaching me so many things about living life to its fullest. Thanks for the bike rides (someday we'll take that long tour) and getting me into running. Finally, Liz Kujawinski and Steve: thank you for putting up with an aging (but, aging well) grump of an old man. I'm so glad that our friendship and household were more resilient than either our road or washing machines.
My parents, Lincoln and Moria Fong, and friends from a far, Janet Anderson, John Beckman, Pat Broun, Hugo and Marie Burgemeestre, Calendula Chang, Morris and Doris Close, Rachel Collin, Allen and Alice Cuenca, Wayne and Liz Fischer, Jackie Holen, Tony and Louise Huen, Erin Jones, Lisa Kimura, Anu Krishnaswamy, Johnny Lin, Caroline Park, David Ross, Kerri Winters, Jennifer Yamashita, have all lent me encouragement, prayers, and the timely phone call or email to keep me in touch with things that are really important.
And finally, the fundamental and important thanks: this research was funded by a National Science Foundation graduate fellowship, and Gulf of Maine Regional Marine Research Program grants UM-S227 and UM-S276.
Contents
Abstract 3
Acknowledgments 5
1 Introduction 13
1.1 The bulge region and coastal current . . . 16
1.2 Plume response to alongshore wind forcing . . . 18
1.3 T hesis outline . . . 21
2 The alongshore transport of fresh water in a surface-trapped river plume 23 2.1 Introduction . . . 25
2.2 The numerical model... . . . . . . . 28
2.3 The unforced river plume . . . 32
2.3.1 B ase case . . . 34
2.3.2 Coastal current freshwater transport . . . 40
2.3.3 Plume response for different inflow parameters . . . 43
2.3.4 Temporal variations in freshwater transport . . . 53
2.4 The influence of an ambient flow field . . . 55
2.5 Sum m ary . . . 67
3 The wind-forced response of a buoyant coastal current: Observations of the western Gulf of Maine 71 3.1 Introduction . . . 73
3.3 Hydrographic surveys . . . . 3.4 Moored Current Meter records . . . . 3.4.1 Ekm an balance . . . . 3.4.2 Other contributors to the alongshore momentum balance 3.5 Discussion and Summary . . . . 4 The response of a river plume during an upwelling favorable
wind event
4.1 Introduction . . . . . . . . .. 4.2 T heory . . . .
4.2.1 Parameterizing vertical mixing in the plume . . . 4.2.2 A simple conceptual model . . . . 4.3 3-D Model description . . . . 4.3.1 Boundary conditions . . . . 4.3.2 Initializing a freshwater plume . . . . 4.4 Plume response to a moderate amplitude wind . . . . 4.4.1 Basic plume response . . . . 4.4.2 Plume mixing dynamics for a moderate amplitude 4.5 Sensitivity to forcing conditions . . . . 4.5.1 Quasi-steady plume thickness . . . . 4.5.2 Plume mixing rates . . . . 4.5.3 Comparison of plume mixing with 1-D mixing stuc
97 100 100 102 107 109 110 113 113 119 128 130 136 wind lies . . . 138 4.6 Comparison with downwelling winds . .
4.7 Discussion and summary . . . .
142 146
5 Summary and discussion
5.1 Summary . . . . 5.2 Unresolved issues . . . .
151 . . . 152 . . . 156 Appendix: The unsteady Ekman problem
Bibliography 159 163 95 . . . . . .. . . . .
List of Figures
2.1 Surface salinity distribution in an idealized numerical model . . . 26
2.2 Surface salinity distribution for the Chesapeake Plume, July/August 1972 ... ... 27
2.3 M odel Configuration . . . 30
2.4 Schematic of river mouth forcing conditions.. . . . . . . 31
2.5 Model surface salinity and velocity fields.. . . . . . . 36
2.6 Cross-shore momentum balance in coastal current . . . 38
2.7 Cartoon of circulation within bulge and coastal current . . . 39
2.8 Idealized Margules front representation of the coastal current . . . 41
2.9 Model freshwater transport
Qfcc
in coastal current . . . 442.10 Bulge behavior for different input conditions . . . 46
2.11 Freshwater transport as a function of discharge Rossby number . . . . 48
2.12 Bulge shapes as a function of Rossby number . . . 50
2.13 Eddy/bulge leakage cartoon . . . 52
2.14 Temporal variations in the coastal current . . . 54
2.15 Bulge width as a function of time . . . 56
2.16 Surface salinity for base model run plus 10 cm/s ambient current . . . 58
2.17 Freshwater transport for same parameters as Base case plus an am-bient flow field of 10 cm/s . . . 59
2.18 Steady state plume width . . . 61
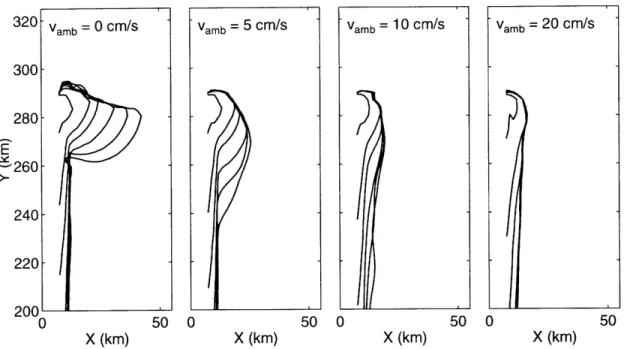
2.19 Traces of 31 psu isohaline at plume surface for Base case with different am bient flow fields . . . 62
2.20 Freshwater transport as a function of time for different ambient flows 63 2.21 Freshwater transport as a function of ambient flow field strength . . . 65
3.1 The study region: the western Gulf of Maine . . . 74
3.2 1993 observations in the western Gulf of Maine . . . 77
3.3 1994 observations in the western Gulf of Maine . . . 78
3.4 Surface salinity for downwelling and upwelling wind conditions . . . . 80
3.5 Time series of alongshore wind stress, salinity and cross-shore veloc-ities measured at Cape Porpoise in 1994 . . . 84
3.6 Time series of terms in the shear alongshore momentum equation . . 88
3.7 Balancing the shear alongshore momentum . . . 91
4.1 Velocity and density profiles in simple theory . . . 101
4.2 Cartoon of conceptual model plume response . . . 104
4.3 Numerical model configuration . . . 108
4.4 Surface salinity for river plume forced by a moderate upwelling wind . 112 4.5 Stress and salinity sections . . . 115
4.6 Profiles of Coriolis and stress divergence terms . . . 116
4.7 Salinity and alongshore momentum balance terms . . . ... 118
4.8 Cross-shore momentum balance . . . 120
4.9 Sections of vertical salt flux and salinity . . . 122
4.10 Profiles of velocity shears, salt flux, and salinity... . . . . . . . 124
4.11 Profiles of stress, stratification, and vertical salt flux . . . 125
4.12 Circulation pattern in reference frame of the advected plume . . . 127
4.13 Sections of salinity and vertical salt flux . . . 131
4.14 Numerical model plume thickness h, versus theoretical thickness he . 134 4.15 Bulk Richardson number as a function of wind stress . . . 135
4.16 Integrated salt flux as a function of time for different wind stresses . . 137
4.17 Log-log plot of Ri, versus non-dimensional entrainment rate we,* . . . 141
4.18 Plume response to downwelling . . . 143
List of Tables
2.1 Parameters of numerical calculations. . . . 32 2.2 Summary of freshwater transport. . . . 47
3.1 Observed change in plume width at Cape Porpoise vs. simple model theory . . . 82 3.2 Low-passed correlation coefficients for observed winds and velocities 83 3.3 Low passed correlation coefficients for alongshore momentum terms 87 4.1 Parameters of numerical calculations presented in Section 4.4. . . ..128 4.2 Comparison of numerical simulations with conceptual model. . . . 132
The ocean has been good to me.
Chapter 1
Introduction
Hobbes: "Do you have an idea for your story yet?" Calvin: "No, I'm waiting for inspiration. "
A large fraction of the terrestrial material delivered to the ocean is accomplished via river discharge. River discharge carries freshwater and is often a source of nutri-ents, biological species, sediment, and unwanted toxic contaminants [Franks et al., 1992; Masse and Murthy, 1992; Nittrouer et al., 1991]. The discharge can play an important role in coastal ocean dynamics in the vicinity of the river mouth because it acts as a source of momentum and buoyancy. Typically, the river discharge first mixes with oceanic water in an estuary such that water entering the coastal ocean is not completely fresh and is often only slightly less saline than the ambient coastal waters. The studies presented here will focus on interactions of the brackish riverine discharge after it has left an estuary mouth.
The less dense water of a river discharge and its associated flow field are called a river plume. River plumes occur over a variety of spatial scales. Garvine [1995] provides a simple framework in which to study different plume systems. His clas-sification scheme is based on the Kelvin number (K), the ratio of the plume width to the baroclinic Rossby radius. A description of the dynamics of small-scale (low
K) plumes in which inertial effects are more important than rotation can be found
in O'Donnell [1990], Garvine [1974,1981,1984], and Garvine and Monk [1974]. The dynamics are usually nonlinear, and rotation is typically unimportant. For plumes of K ~ 0(1) or greater, earth's rotation becomes important and tends to turn the buoyant discharge to the right (in the Northern Hemisphere) as it exits the estu-ary mouth. This thesis focuses on large-scale (large K) river plumes where earth's rotation is important to the plume dynamics.
Large-scale plumes have traditionally been viewed as coastal currents driven by their own baroclinicity [Kao, 1981]. The alongshore transport of fresh water and flow within the plume, however, can be strongly influenced by external forcing conditions
such as winds [Miinchow and Garvine, 1993b] and remotely forced ambient flow fields. It is likely that these two forcing agents may play important roles in the alongshore flow of plume water.
Chapman and Lentz [1994] classify plumes as either surface-trapped or
bottom-attached. The former plume is one where the fresh water forms a shallow, surface-trapped layer that spreads over the ambient shelf water and exhibits strong vertical stratification. Examples of surface-trapped plumes are the Columbia River and Chesapeake Bay plumes [Boicourt, 1973; Hickey et al., 1998]. A plume is bottom-attached if a significant portion of the plume spans the water column from surface-to-bottom. These plumes have been observed in the South Atlantic Bight [Blanton
and Atkinson, 1983}.
Yankovsky and Chapman [1997] provide a framework for determining whether a
freshwater discharge will be surface-trapped or bottom-trapped and describe some of the dynamical differences in the source region. It is worth noting that the presence of wind forcing can alter a plume's structure, and hence classification. For example, a sustained downwelling wind event can advect a surface-trapped plume against the coast such that its structure temporarily becomes bottom-attached. While this thesis will focus primarily on the surface-trapped class of plumes, it is hoped that many of dynamics discussed will be relevant to both surface-trapped and bottom-attached plumes. The literature review which follows will discuss previous work involving both plume types and only distinguish between the two when necessary.
1.1
The bulge region and coastal current
A surface-trapped plume consists of two distinct dynamical regions: a bulge re-gion near the estuary mouth and a geostrophic current in the direction of Kelvin wave propagation downstream of the bulge (Figure 1.1). Most laboratory studies of plumes have focused on the establishment of the geostrophically-balanced down-coast buoyancy current flowing in the direction of Kelvin wave propagation [Griffiths
and Hopfinger, 1983; Stern et al., 1982]. These studies have shown that the leading
edge or nose of the plume propagates at the rate comparable to the phase speed of the first mode baroclinic wave. Whitehead and Chapman [1986] note that the nose propagation decays in time, caused by shelf wave radiation. The deceleration of the density-driven current suggests that, in the absence of winds or external forcing, the plume water will only be transported a finite distance downstream. While the photographs contained in these studies hint at the presence of a bulge upstream of the coastal current, no mention is made of its existence.
The buoyancy-driven plume flow has been studied extensively with numerical models. Like the aforementioned lab studies, early studies by Kao [1981] and
Garvine [1987] focus on the rightward veering of the river discharge (in the
North-ern Hemisphere) and its subsequent steady-state geostrophic current. Garvine [1987] does, however, acknowledge that there exists a transition region between the river mouth and the downstream coastal current.
One of the first studies to identify the bulge region of the plume is the modeling study of Chao and Boicourt [1986]. They model a freshwater plume in the absence of any external forcing (e.g., tides, winds, ambient flow field). Their base model run shows that, at least at depth, the bulge region near the estuary mouth consists
BULGE
COASTAL CURRENT
Figure 1.1: Cartoon of surface-trapped plume.
of an anti-cyclonic, recirculating cell of brackish water. Between t=5 and 10 days of buoyancy forcing, the bulge widens and expands offshore. The growth of the bulge implies that the downstream geostrophic current does not transport the entire freshwater volume supplied by the river discharge downstream, and the plume is not in steady-state. This behavior is also observed in a recent study by Oey and
Mellor [1993] where their bulge region continually grows in time and periodically
sheds eddies, apparently due to a baroclinic instability mechanism. Based on the observed continual growth of the bulge in these studies, it is likely that a plume cannot be treated as a steady-state phenomenon.
Modeling studies by Kourafalou et al. [1996b], McCreary et al. [1997], and
Chap-man and Lentz [1994] also note significant recirculation near the river mouth and
that some of the freshwater is transported upcoast, opposite the direction of Kelvin wave propagation, in the absence of any external forcing. If the fate of a freshwater plume is to be understood, it is necessary to investigate how much buoyancy the geostrophic current in the plume can transport, and the role external forcing plays in enhancing or arresting the downcoast transport of freshwater. One of the goals of this thesis is to identify the role an ambient current plays in alongshore plume advection and transport of fresh water. It will consider ambient currents oriented in the direction of Kelvin wave propagation, similar to those found on many continental shelves.
1.2
Plume response to alongshore wind forcing
Most plume systems are exposed to additional external forcing mechanisms that can affect the advection and fate of the fresh water: e.g., winds and tides. The former
has been the subject of several studies. Miinchow and Garvine [1993a] show how alongshore winds could significantly alter the cross-shore structure of the Delaware River plume. Upwelling winds tend to spread the plume significant distances offshore while downwelling winds tend to confine the plume against the coast. The observed behavior is consistent with Ekman dynamics. The offshore spreading of the Delaware plume is large under upwelling winds such that the hydrographic surveys show a plume over 30 km wide, and not completely resolved by the surveys.
Modeling studies also demonstrate the plume's Ekman-like response to along-shore wind forcing [Chao, 1988b; Kourafalou et al., 1996a]. Chao [1987] shows how upwelling winds tend to spread the plume offshore and also arrest downstream prop-agation of fresh water because of the downwind barotropic response. In contrast, downwelling winds strengthen the downcoast transport of fresh water by enhancing cross-shore density gradients, and hence, the geostrophic current. While the basic Ekman response has been described in previous studies, the wind-induced advection has not been quantified.
Wind forcing not only advects the plume; it also can lead to the mixing of plume waters. While some of the previous modeling studies have looked into the sensitivity of plume mixing to bottom friction, stratification, and magnitude of the background diffusivity [Chao, 1988a; Kourafalou et al., 1996b], there has been little work done to address the underlying physics driving the mixing in a freshwater plume.
The role of tidal mixing is investigated by Blanton and co-workers using ob-servations in the South Atlantic Bight (SAB) [Blanton et al., 1994; Blanton and
Atkinson, 1983]. They find that river discharge in the SAB, where the plume is
absence of strong prevailing winds, tidal mixing should be the dominant mechanism by which plume waters are mixed and dispersed.
It seems likely, however, that in a surface-trapped plume, tidal mixing should play a less important role. Wind stress may be the dominant mixing agent because the significant stresses within the plume may lead to turbulent mixing. If the plume is not in contact with the bottom topography, it is likely that the tidally generated turbulence near the bottom will have little effect on mixing in the plume.
While the basic plume response to winds has been discussed in several previ-ous studies, almost no attention has been focused on addressing the role of winds in mixing the plume and ambient coastal waters. Based on their observations of the Niagara River plume, Masse and Murthy [1992] suggest that enhanced mixing is expected during upwelling due to weakened vertical density gradients; they also suggest that mixing should be inhibited during downwelling due to enhanced gradi-ents. It seems reasonable, however, to expect that mixing would be enhanced during either type of alongshore wind stress because of the energy source provided by the winds. In addition, it is likely that upwelling winds would actually increase vertical salinity gradients while at the same time enhancing velocity shears.
The one-dimensional mixing problem of a stratified fluid forced by a surface stress has been studied extensively in the laboratory (e.g., Fernando [1991], Kato
and Phillips [1969], Kantha et al. [1977]). Trowbridge [1992] shows that mixing is a gradient transport process where turbulent mixing is maintained at a constant Richardson number. Although the river plume problem is clearly two- if not three-dimensional, the mixing processes in a plume may bear some relation to the mixing observed in these studies. One of the goals of this thesis is to identify the mixing
mechanisms that occur in a plume during a wind event.
1.3
Thesis outline
The goal of this study is to elucidate the basic physical processes associated with a large-scale, surface-trapped river plume. In particular, the study focuses on un-derstanding the role of wind-forcing and the ambient coastal circulation in deter-mining the structure and evolution of a plume. The thesis includes observations of the wind-forced plume dynamics in the western Gulf of Maine and some process-oriented numerical modeling experiments of wind-induced mixing during upwelling winds and plume dynamics in the absence of winds. One of the key contributions of this work is the quantification of both the along and cross-shore motions of plume waters.
The thesis is organized as follows. In Chapter 2, an idealized series of numeri-cal modeling experiments is conducted to study the evolution of a surface-trapped plume neglecting the influence of winds, but considering the effects of an along-shore barotropic flow. In this section of the thesis, the importance of the bulge region is identified. One key result is that much of the fresh water volume discharged by a river is not transported downstream by the plume's baroclinicity; external forcing may play an important role in augmenting the freshwater transport in the plume. In Chapter 3, cross-shore motions of a plume are studied using observations col-lected from the western Gulf of Maine. Using some simple ideas, it is found that the cross-shore motion of the plume is approximated by an Ekman balance. The wind-induced mixing of the plume during an upwelling favorable wind event is described and quantified in Chapter 4. In this chapter, the mechanism by which mixing is
maintained during a sustained upwelling wind event is described. In Chapter 5, the thesis results are summarized and future work is suggested. These chapters employ a range of methods to probe the fundamental dynamics governing a freshwater plume. Each of them shows evidence that the winds and ambient currents can dominate the buoyancy-forcing in determining the transport and fate of a plume.
Chapter
The alongshore transport of fresh
water in a surface-trapped river
plume
Hobbes: "OK ... um, first let's make a list of what we know." Calvin: "Yeah, that's a good way to start!"
Abstract
The alongshore transport of a surface-trapped river plume is studied using a three-dimensional model. Model simulations exhibit the previously observed right-ward veering (in the Northern Hemisphere) of the fresh water and establishment of a downstream geostrophically-balanced coastal current. In the absence of any ambient current, the plume does not reach a steady-state. The downstream coastal current only carries a fraction of the discharged fresh water; the remaining fraction recirculates in a continually growing "bulge" of fresh water in the vicinity of the river mouth.
The river mouth conditions influence the amount of fresh water transported in the coastal current relative to the growing bulge. For high Rossby number (0(1)) discharge conditions, the bulge shape is circular and the coastal current transport is smaller than for the model runs of low Rossby number discharges. For all model runs conducted without an ambient current, the freshwater transport in the coastal current is less than the freshwater discharged at the river mouth.
The presence of an ambient current (in the same direction as the geostrophic coastal current) augments the transport in the plume such that its downstream freshwater transport matches the freshwater source, and the plume evolves to a steady-state width. The steady-state transport accounted for by the ambient current is independent of the strength of the ambient current. The amplitude of the ambient current only determines the time required to reach a steady-state plume width. The key result of this study is that an external forcing agent (e.g., wind or ambient current) is required in order for the entire freshwater volume discharged by a river to be transported downstream.
2.1
Introduction
The rightward turning (for an observer looking towards the sea from the river mouth) of large-scale river inflow [Garvine, 1995] in the northern hemisphere has been well documented in previous studies. The fresh water discharged from the Chesapeake and Delaware Bays, and Androscoggin/Kennebec Rivers have all been found to leave a significant freshwater signature towards the right and downstream of the river
mouth (where downstream is defined to refer hereafter to the direction a Kelvin wave propagates) [Boicourt, 1973; Miinchow and Garvine, 1993b, Chapter 3]. Similar behavior has also been observed in the laboratory [Griffiths and Hopfinger, 1983;
Stern et al., 1982; Whitehead and Chapman, 1986] and in numerical models [Chao and Boicourt, 1986; Kourafalou et al., 1996; Oey and Mellor, 1993].
The plume can be separated into two dynamically distinct regions: a bulge region near the river mouth and a downstream coastal current [Chao and Boicourt, 1986). Many of the previous studies (e.g., Garvine [1987], Kao [1981]) have focused pri-marily on the downstream coastal current; these studies have found that the coastal current is largely in geostrophic balance. This cross-shore momentum balance is
consistent with field observations [Minchow and Garvine, 1993a].
A few studies have looked at the dynamics at the river mouth [Chao and Boicourt, 1986; Valle-Levinsion et al., 1996; Zhang et al., 1987]. These papers investigate the exchange flows near the estuary/river mouth and the lateral variations in the estuarine circulation for a wide estuary/river mouth. Less attention has been paid to the bulge region itself, which appears to be a prominent feature in previous investigations (e.g., Figure 2.1). One would expect that the bulge could contain a significant fraction of the fresh water discharged by the river.
0
200
0
200
(km)
(km)
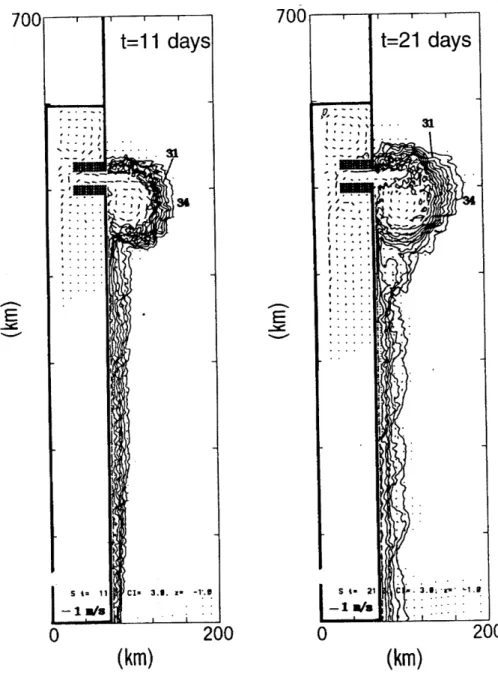
Figure 2.1: Surface salinity distribution at t=11 and 21 days in an idealized numer-ical modeling study of an estuarine-forced plume without winds, tides, or ambient flow field (adapted from Oey and Mellor [19931).
Figure 2.2: Surface salinity distribution for the Chesapeake Plume, July/August 1972 (from Boicourt [19731).
Chao and Boicourt [1986 note that the bulge consists primarily of an anticyclonic
flow field that induces upwelling within it. Oey and Mellor [1993] show the bulge may shed eddies downstream. Yankovsky and Chapman [1997] suggest that the dynamics within the bulge are primarily cyclostrophic in nature, i.e., the momentum balance is dominated by the pressure gradient, the Coriolis force, and the centrifugal force associated with the azimuthal velocity around the bulge.
Although the previous modeling studies have identified the bulge region in the vicinity of the river mouth and the much narrower downstream coastal current
(Fig-ure 2.1), the actual dynamics of the bulge need to be addressed. Furthermore, the plume bulges observed in models are usually more pronounced than those in nature. For example, the surface salinity structure of the Chesapeake plume [Boicourt, 1973] suggests a slight bulge near the river mouth; however, the downstream coastal cur-rent is nearly the same width as the bulge (Figure 2.2), in contrast to Chao and
Boicourt's [1986] simulation (their Figure 6).
It is understandable that plumes in previous modeling studies may differ from those observed in the field: typically, numerical models have sought to isolate the
buoyancy forcing of the river from the other complex physical processes influencing plume behavior. Thus, the numerical studies have often neglected external forcing agents such as ambient coastal circulation. Understanding the differences between the unforced and forced model plumes is a necessary step to furthering the under-standing of plume dynamics.
The idealized numerical experiments presented in this chapter explain some of the differences between previous field observations and idealized numerical simulations of surface-trapped river plumes. The numerical model is presented in Section 2.2. The dynamics of the unforced river plume are investigated in Section 2.3, concentrating on the implications for the alongshore transport of fresh water. The influence of an ambient alongshore flow is considered in Section 2.4. The results are summarized in Section 2.5.
2.2
The numerical model
A three-dimensional, primitive equation model [Blumberg and Mellor, 1987] is used, with the model domain consisting of a rectangular basin with a flat bottom of 50 m
depth (Figure 2.3). Fresh water is discharged uniformly (in y and z) at the coastline
(x = 0), via a river centered at y = 277 km into a 65 km x 340 km model basin. In
order to resolve the spatial structure of the plume, a variable resolution grid with 50 x 100 x 23 grid cells is employed (shown as dots in Figure 2.3). The horizontal grid resolution is 1.5-3 km in the cross-shore direction and 3-6 km in the alongshore direction; vertical grid resolution is better than 1 m within the surface-trapped plume.
The model solves the hydrostatic, Boussinesq primitive equations. Sub-grid scale processes are parameterized by eddy coefficients for both momentum and scalar diffusion using the Mellor-Yamada level 2.5 closure scheme [Mellor and Yamada, 1982] for vertical mixing. Horizontal diffusivities are held constant at 10 m2/s. The influence of rotation is implemented with a constant Coriolis parameter
f
set to 10-4 s-, a reasonable value for a mid-latitude plume. The model uses a split time step for internal and external modes. The external mode is two-dimensional and stepped in 10 second steps to satisfy the CFL condition associated with surface-gravity waves. The internal mode time step, based on the internal wave speed, is 7 minutes. A recursive Smolarkiewicz [Smolarkiewicz and Grabowski, 1990] scheme is used to advect scalar fields. General model properties and details of the numerical algorithms can be found in Blumberg and Mellor [1987].The model is forced with a river inflow centered at y=287.5 km. The river inflow is of uniform density and discharged with uniform velocity from a river mouth of width L, and depth h, (Figures 2.3 and 2.4). This buoyancy forcing is steady and occurs for a period of up to 30 days. For the model runs investigating the role of ambient flows, a uniform, barotropic alongshore ambient flow field is imposed at the upstream (y=340 km) boundary of the model domain. All model runs presented
Plan view ... j ... L ... ... : ... ... ... ... ... :: ... ... ... ... I ... ... ... :: ... ... . ... ... .:..: ... ... : ... ... ... ... .... ... ... ... ... ... : ... ... ... .... ... ... ... ...... .. ... ... ... : ...... .. ... ... :: ... ... ... ... ... ... ... ... ... ... ... ... :: ........... ... . .. .... ... ... ... ... :.... . ... .... : - :: :: : . I ... . . ... ... :: , : ... ... : ... d .. ... ... ... ... . ... ... ... . . .. . . .. . . .. . . .. .. .. . . .. . . .. . .. . . .. . .... ... .. : . .. . . .. .. . . .. .. .. ... . .. . . . .. .. . . .. .. .. .. .. . . . . . .. . . .. . . .. .. .. .... . . ... d ... 300
250
200150
10050
0Section (x-z) view
0
10 ,E 20 _r... ... .. ... ~3040
0 20 40 60x (km)
0 20 40 60x (kin)
Figure 2.3: Model configuration. Blumberg and Mellor's Estuarine Coastal Ocean Model-3D (ECOM-3D) is run on a 65 km x 340 km x 50 m grid. Grid resolution is indicated by small dots in both plan and section views. Vertical sigma levels are closely spaced at the surface to resolve the near surface plume behavior. Freshwater is discharged from a river at x = 0 centered about the alongshore position y = 287.5 km (indicated by arrow). The river width is varied from 3-15 km (in vicinity of river mouth, grid cells (dots) are spaced 3 km apart in the alongshore (y) direction). The coastline (and land) is shaded in light gray.
-z=Om
APr
z=50 m
x=O km
- -hr IFigure 2.4: Schematic of river mouth forcing conditions. River discharge is accom-plished through a uniform river discharge of water which differs in density from the ambient fluid by Ap, Discharge is accomplished through a river mouth of width L, and depth h, with velocity u,.
;ow
neglect the influence of tides and winds. The only variable scalar property considered in this study is salinity. The temperature of both the river discharge and the ambient coastal water is held fixed at 4 'C. The ambient coastal salinity is 32 psu while the salinity of the river inflow ranges from 16-28 psu.
It is worth noting that rarely in nature does a river plume develop in the absence of either winds or an ambient flow field for more than a few days, so these simulations are not intended to represent actual river outflows. The goal of this study is, how-ever, to compare previous idealized studies with the complicated plume structures observed in nature. In order to facilitate such a comparison, this study replicates previous idealized investigations and infers the limitations of making such simplifica-tions to the plume system. In short, the objectives are to understand the underlying physics involved with the buoyancy flux of the river itself, and how these physics are modified by the presence of an ambient flow field.
2.3
The unforced river plume
Four model parameters are varied within the following ranges: the volume flux of water discharged by the river, 2,500<
Q,
<10,000 m3/s; the density anomaly of theriver discharge 3.1 < (Ap), < 12.4 kg/m 3 which is equivalent to a salinity anomaly
of the river discharge 4 < (AS)r < 16; the width of the river inflow, 3 < L < 30 km; and the thickness of the river inflow, 3 < hr < 30 m. For all cases presented, the equivalent fresh water discharged by the river is Q, = 1250 m3/s. Table 2.1
summarizes the inflow parameters for all the model runs.
For the narrowest river mouth cases considered (L, = 3 km), the river mouth is only one model grid cell wide. To insure the results presented were not dependent
Table 2.1. Parameters of numerical calculations presented in Section 2.6. Q, is the total volumetric transport of the river discharge, Qf, is the fresh water river discharge, and (AS), is the salinity anomaly associated with the river discharge. All other variables
Run No. 1 2 3 4 5 6 7 8 9 10 11 12 13
are defined in the text.
QT (m3/s) 10,000 10,000 10,000 10,000 10,000 10,000 10,000 10,000 10,000 10,000 10,000 10,000 5,000 Qjr (m3/s) 1,250 1,250 1,250 1,250 1,250 1,250 1,250 1,250 1,250 1,250 1,250 1,250 1,250 (AS), (psu) 4 4 4 4 4 4 4 4 4 4 4 4 8 (AP)r (kg/m 3) 3.1 3.1 3.1 3.1 3.1 3.1 3.1 3.1 3.1 3.1 3.1 3.1 6.2 hr (m) 15 15 15 15 3 3 3 3 3 30 30 30 15 Lr (km) 3 6 9 12 3 6 9 12 15 3 9 15 3 14 2,500 1,250 16 16 12.4 12.4 15 15 33 14 2,500 1,250
on the under-resolution of the river mouth, sensitivity tests were conducted using a limited model domain at four times the horizontal resolution (for both x and y directions) of the standard runs reported. The basic properties of bulge width and position, coastal current width, and freshwater transport agree to within 2%. However, there was a noticeable change in the plume structure at the bulge circum-ference between the low and high resolution simulations. The wave-like meanders surrounding the bulge in Figure 2.5 disappeared in the high resolution simulation. This discrepancy suggests that in order to model the detailed dynamics of the bulge region, and the potential eddy fluxes associated with it (e.g., Oey and Mellor [1993]), one must be careful in choosing the grid resolution of the model.
2.3.1
Base case
As a base case (Run 1 in Table 2.1), a freshwater river inflow of 1,250 m3/s (ac-complished through a 10,000 m3/s discharge of 28 psu salinity(Ap = 3.1 kg/m 3)) is
imposed entering a coastal ocean initially at 32 psu salinity. The fresh water enters through a river mouth of 3 km width and 15 m depth. The size of the freshwater inflow is representative of a moderately strong discharge during the spring freshet for several North American rivers such as the Kennebec/Androscoggin, Delaware, and the South Atlantic Bight River systems [Blanton and Atkinson, 1983; Geyer et
al., 1998; Miinchow and Garvine, 1993a].
The development of the unforced plume closely resembles the behavior found in previous modeling studies (e.g., Figure 2.1, Chao [1998]) of surface-trapped plumes. Most of the river water turns to the right upon entering the model domain (Figure 2.5). After only a few days, the plume has developed into two distinct regions: a near source bulge and a downstream coastal current. The coastal current is only
a few kilometers wide, in contrast to the continually expanding bulge region which extends over 30 km offshore after seven days of river discharge. In addition, there is a small leakage of water upstream, i.e., in the direction opposite of Kelvin wave propagation, similar to that found in previous modeling studies such as McCreary
et al. [1997] and Chapman and Lentz [1994].
Chapman and Lentz [1994] suggest the upstream flowd is related to the initial
geostrophic adjustment of the river discharge. They argue that this produces a buoyancy flux which subsequently feeds a self-sustaining upstream propagation of the upstream intrusion. The simulations presented here are consistent with their hypothesis. The northward intrusion is present at the onset of river discharge, and is sustained for all time (Figure 2.5). In addition, the model runs conducted in this study exhibit stronger upstream propagation for larger density anomaly inflows, consistent with Chapman and Lentz [1994].
A recent study by McCreary et al. [1997] found that an upstream intrusion of the plume is consistent with a layered analytical model; however, the mechanism by which this upstream intrusion is achieved requires ambient stratification in the coastal waters. The northward intrusion observed here and in other studies (e.g.,
Chapman and Lentz [1994], Kourafalou et al. [1996]) takes place in spite of an
initially unstratified coastal ocean. The upstream transport of fresh water is the topic of current research and beyond the scope of this study. It is only important to note that the upstream leakage can account for up to 10 % of the total freshwater discharge.
The coastal current is unidirectional with velocities up to 40 cm/s in the down-stream direction. The cross-shore momentum balance is primarily geostrophic in the
t= 3 days
... 541.../.
0.5c
541 n/s/
. . . .
Surface Salinity (psu) t= 5 days
ce=.... 594m.. /s
... 5.m/s
0 20 40
X (km)
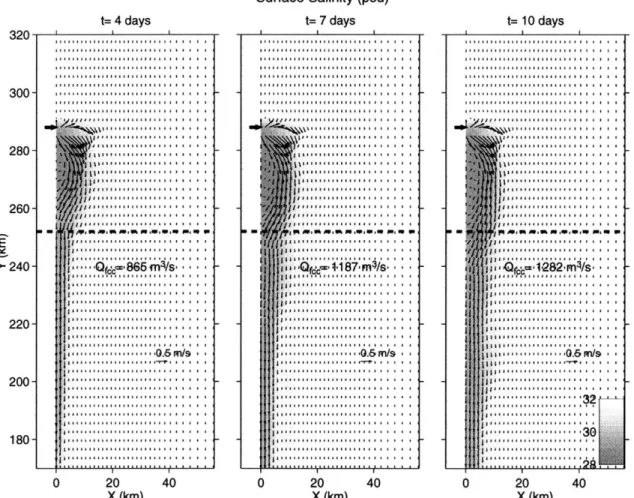
Figure 2.5: Surface salinity run (Run 1) at t=3, 5, and
the flow field. Freshwater transport in coastal current is measure at y=252 km (indicated by dashed line). River mouth location is indicated by bold arrow.
300- 280- 260-E >- 240 - 220- 200-180- 30 -9 0 20 40 0 20 40 X (km) X (km)
(psu), indicated by gray shading, for Base Case model 7 days. Velocity vectors are superimposed to indicate
coastal current with the Coriolis and pressure gradient terms being over a magnitude larger than all other terms (Figure 2.6).
The bulge region is similar in appearance to an anticyclonic gyre or eddy, with velocities approaching 50 cm/s at its circumference and slower velocities near the center. The transport around the bulge is not axially symmetric. The seaward side of the bulge has a stronger flow field than near the coast. The asymmetry can be explained by a simple cartoon (Figure 2.7). The perimeter flow on the seaward side of the bulge contains both recently discharged river water and "older" recirculating water. The water that does not get transported in the coastal current is then recirculated in the near coast portion of the bulge. The freshwater transport in the coastal current
Qfcc
is defined asQfcc / AS dA
ffso
where v is the alongshore velocity, AS is the salinity difference between the plume and ambient water, So is the ambient salinity, 32 psu, and the area integral is computed over the depth/cross-shore section of the coastal current. For the base case, the freshwater transport in the coastal current (measured at y=252 km) is between 500-600 m3/s (Figure 2.5), less than half of the 1250 m3/s fresh water
input by the river. Since the coastal current does not transport all of the freshwater input at the river mouth, the excess recirculates in the bulge region. It should be emphasized that it is unclear a priori whether the bulge recirculation is a consequence of the strength of the coastal current or visa-versa. The influence of the source conditions on the bulge behavior and freshwater transport in the coastal current will be discussed in Section 2.3.3.
2 4 6
distance from shore (km)
-20 -10 0 10 10-6m/s2 Salinity psu) 20 25 -Alongshore velocity (cm/s) -3011 1 0 2 4 6 8 1
distance from shore (km)
0 ut vU wU -10 -15 - - -.. -20 -25 --30 0 10-6 m/s2
Figure 2.6: Sections of salinity (psu) and alongshore velocity are shown in the upper two panels. Profiles of terms in the cross-shore momentum balance are shown in the lower panels at the location given by the heavy vertical line overlying the salinity contours. 8 10 -5 -10 E i -15 -0 -20 --25 -0 0 -5 -10 E E -15 _0 -20 -25 -30 L--30 20 30 3 ' ' ' ' 0
-RIVER
-4
It
t
I
/
4
BULGE
COASTAL CURRENT
Figure 2.7: Cartoon of circulation within bulge and coastal current. The flow along the seaward side of the bulge transports water which supplies water to both the coastal current and the continually growing recirculation within the bulge.
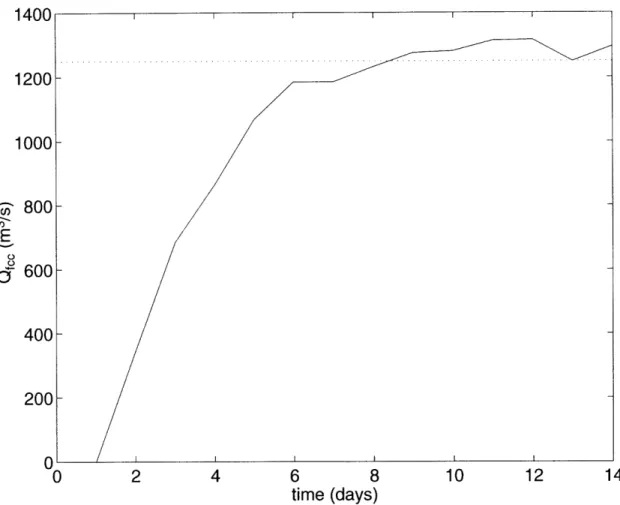
The discrepancy between coastal current transport and fresh water river input persists through the model run, and this necessitates a growing bulge. The mismatch between the river discharge and coastal current transport does vary somewhat in time; however the freshwater transport of the coastal current is found to be signif-icantly less than the river discharge for the entire model simulation. The temporal variability of the freshwater transport is discussed in Section 2.3.4.
In spite of the observed meanders on the circumference of the bulge region, the bulge remains stable for all 21 days of simulation. In fact, none of the conducted model runs exhibits eddy shedding as predicted by Oey and Mellor [1993]. As discussed earlier, it is plausible that the observed instabilities in their modeling study are due to their coarse grid resolution.
The continuous growth of the bulge implies that the unforced river plume is an unsteady phenomenon. This behavior contrasts the assumption of steadiness used in several previous studies of freshwater plumes [Garvine, 1996; Yankovsky and
Chapman, 1997; Zhang et al., 1987].
2.3.2
Coastal current freshwater transport
Qualitatively, the freshwater transport in the coastal current can be understood by considering a simple representation shown in Figure 2.8. Consider a 2-layer, Margules front system which has a quiescent lower layer and a geostrophic cross-shore momentum, i.e.,
Ap =h
(2.1)
x=O
x=LP1
h(x)
P2
Figure 2.8: Idealized Margules front representation of the coastal current.
where Ap = (P2 - Pi) is the density difference between the plume and the
ambi-ent water, h is the plume thickness, v is the alongshore velocity,
f
is the Coriolis parameter, po is a ambient density equal to 1025 kg/ma, and g is the gravitational acceleration.The transport in the coastal current is,
Qcc
=
vd
A
=
vhdx
(2.2)
where A is the cross-sectional area of the plume and L is the plume width. Sub-stitution of (2.1) into (2.2) and integration gives an expression for the geostrophic transport in the coastal current,
Q
= (h2 - h2) (2-3)where g' is the reduced gravity (g2) and ho and hL are the plume thickness at the coast and its offshore edge, respectively. If one assumes hL
<
ho, then the transportcan be estimated by,
Qcc = (h2) (2.4)
where the minus sign associated with transport being in the negative y direction has been dropped for convenience. It should be noted that since the density of the plume is only a function of salinity in the numerical experiments, the salinity anomaly is approximately proportional to the density anomaly and hence, g' (assuming a linear equation of state, Ap =
#AS,
where#
= 0.79 m3 kg-1 psu- 1).Similarly, one can derive an expression for the freshwater transport for the Mar-gules front,
Qf ~ A po (g'ho)2
Q5
= v ASdA~ (2.5)so
g#So 2f
where Apo is the ambient water density and again, it has been assumed hL < ho. Equation (2.5) predicts that for the Margules front the freshwater transport is a function of only g'ho, the buoyancy of the plume at the coast. This quantity is
proportional to the potential energy of the coastal current.
For more complicated salinity structures than a Margules front, the relation-ship between the plume buoyancy and the freshwater transport remains the same. Namely, for a continuously stratified plume, the freshwater transport in the coastal current depends on (g'ho)2, and only the coefficient in front of expression (2.5) is modified and g' is based on the depth-averaged density anomaly. For exam-ple, for salinity profile that varies linearly with x and z within the plume, (AS = ASO(1 - x/L + z/ho), where ASO is the maximum salinity anomaly within the
2.3.3
Plume response for different inflow parameters
In this subsection, the behavior and physics of the base case are tested for a variety of forcing conditions (see Table 2.1).
Potential energy and freshwater transport in the coastal current
For all the model runs conducted, the freshwater transport in the coastal current shows a consistent dependence on the plume's potential energy at the coast. A linear fit of the observed model freshwater transport as a function of the squared potential energy at the coast (g'ho)2 at t=5 days is shown in Figure 2.9. The least squares regression of the model's coastal current freshwater transport
Qfcc = (- O (g'ho)2 (2.6)
results in y 0.377 and o- = 61 m3/s. The fit is excellent (r2 = 0.94), consistent with a cross-shore momentum balance that is primarily geostrophic in nature. It should be noted that the conputed y-intercept o-, does not make sense for small
g'ho. Without any buoyancy, Qfcc should equal zero. The regression is similar for
the entire duration of the model runs considered. For a regression which includes all the model runs for t=1 day through t=14 days, the fit is also excellent with -y = 0.383 and r2 = 0.98. As was previously noted, the coefficient 'y can be interpreted as a
"shape factor" related to the details of the salinity distribution within the coastal current. Figure 2.6 shows a typical section within the coastal current. The structure is roughly linear in both the depth and cross-shore directions, consistent with the value of 7- = 1/3 for linearly varying salinity in x and z.
1200 1000- 800-E 600 400- 200-0 0 0.01 Figure 2.9: Model km, as a function 0.02 0.03
q.04
0.05 0.06 0.07 (g'h 0) (m4/s4) 0.08freshwater transport