NOTE TO USERS
Page(s) not included in the original manuscript and are
unavailable from the author or university. The manuscript
was scanned as received.
38-41
This reproduction is the best copy available.
®
APPROCHE PROBABILISTE HYBRIDE POUR LA
RECHERCHE D'IMAGES PAR LE CONTENU AVEC
PONDERATION DES CARACTERISTIQUES
par
Touati Hamri
Memoire presente au Departement d'informatique
en vue de l'obtention du grade de maitre es sciences (M.Sc.)
FACULTE DES SCIENCES
UNIVERSITE DE SHERBROOKE
1*1
Library and
Archives Canada
Published Heritage
Branch
395 Wellington Street Ottawa ON K1A0N4 CanadaBibliotheque et
Archives Canada
Direction du
Patrimoine de I'edition
395, rue Wellington Ottawa ON K1A0N4 CanadaYour file Votre reference ISBN: 978-0-494-49510-0 Our file Notre reference ISBN: 978-0-494-49510-0
NOTICE:
The author has granted a
non-exclusive license allowing Library
and Archives Canada to reproduce,
publish, archive, preserve, conserve,
communicate to the public by
telecommunication or on the Internet,
loan, distribute and sell theses
worldwide, for commercial or
non-commercial purposes, in microform,
paper, electronic and/or any other
formats.
AVIS:
L'auteur a accorde une licence non exclusive
permettant a la Bibliotheque et Archives
Canada de reproduire, publier, archiver,
sauvegarder, conserver, transmettre au public
par telecommunication ou par Plntemet, prefer,
distribuer et vendre des theses partout dans
le monde, a des fins commerciales ou autres,
sur support microforme, papier, electronique
et/ou autres formats.
The author retains copyright
ownership and moral rights in
this thesis. Neither the thesis
nor substantial extracts from it
may be printed or otherwise
reproduced without the author's
permission.
L'auteur conserve la propriete du droit d'auteur
et des droits moraux qui protege cette these.
Ni la these ni des extraits substantiels de
celle-ci ne doivent etre imprimes ou autrement
reproduits sans son autorisation.
In compliance with the Canadian
Privacy Act some supporting
forms may have been removed
from this thesis.
Conformement a la loi canadienne
sur la protection de la vie privee,
quelques formulaires secondaires
ont ete enleves de cette these.
While these forms may be included
in the document page count,
their removal does not represent
any loss of content from the
thesis.
Canada
Bien que ces formulaires
aient inclus dans la pagination,
il n'y aura aucun contenu manquant.
Le 15 Janvier 2008
lejury a accepte le memoire de M. Touati Hamri dans sa version finale.
Membres dujury
M. DjemelZiou
Directeur
Departement d'informatique
M. Mohammed Lamine Kherfi
Membre
Departement de mathematiques et d'informatique - Universite du Quebec a Trois-Rivieres
M. Ernest Monga
President-rapporteur
Departement de mathematiques
A mon cher pere et ma chere mere.
A mes freres et soeurs.
A mes neveux et nieces, mes beau freres.
SOMMAIRE
Durant la derniere decennie, des quantities enormes de documents visuels (images et videos) sont produites chaque jour par les scientifiques, les journalistes, les amateurs, etc. Cette quantite a vite demontre la limite des systemes de recherche d'images par mots cles, d'ou la naissance du paradigme qu'on nomme Systeme de Recherche d'Images par le
Contenu, en anglais Content-Based Image Retrieval (CBIR). Ces systemes visent a
loca-liser les images similaires a une requete constitute d'une ou plusieurs images, a l'aide des caracteristiques visuelles telles que la couleur, la forme et la texture. Ces caracteristiques sont dites de bas-niveau car elles ne refletent pas la semantique de l'image. En d'autres termes deux images semantiquement differentes peuvent produire des caracteristiques bas-niveau similaires. Un des principaux defis de cette nouvelle vision des systemes est
I'organisation de la collection d'images pour avoir un temps de recherche acceptable. Pour
faire face a ce defi, les techniques developpees pour l'indexation des bases de donnees tex-tuelles telles que les arbres sont massivement utilisees. Ces arbres ne sont pas adaptes aux donnees de grandes dimensions, comme c'est le cas des caracteristiques de bas-niveau des images. Dans ce memoire, nous nous interessons a ce defi. Nous introduisons une nouvelle approche probabiliste hybride pour I'organisation des collections d'images. Sur une col-lection d'images organisee hierarchiquement en noeuds selon la semantique des images, nous utilisons une approche generative pour l'estimation des melanges de probabilites qui representent l'apparence visuelle de chaque noeud dans la collection. Ensuite nous appliquons une approche discriminative pour l'estimation des poids des caracteristiques visuelles. L'idee dans notre travail, est de limiter la recherche seulement aux noeuds qui representent mieux la semantique de la requete, ce qui donne une propriete semantique a la recherche et diminue le fosse semantique cause par les caracteristiques de bas-niveau.
R E M E R C I E M E N T S
Je tiens en premier lieu a exprimer ma grande reconnaissance et mes vifs remerciements a mon directeur de recherche, le professeur Djemel Ziou pour son aide, ses conseils, ses encouragements, sa contribution, sa disponibilite, ses critiques et sa patience.
J'aimerais egalement remercier mes collegues du laboratoire MOIVRE (MOdelisation en Imagerie, Vision et REseaux de neurones) Zahir, Lotfi, AU, Nizar, Mohand, Sabri et
Ouael pour leur soutien et agreable compagnie. Je tiens a remercier aussi mes collegues Ahmed et Sidali pour leur soutien.
Mes remerciements s'adressent a tous les membres du Departement d'informatique de l'Universite de Sherbrooke qui ont contribue a ma formation.
Mes remerciements vont egalement aux Laboratoires Universitaires Bell et au Conseil de Recherche en Sciences Naturelles et en Genie du Canada (CRSNG) pour leur soutien. Enfin, j'adresse un remerciement particulier pour toute ma famille ainsi que tous ceux qui me sont proches pour leur soutien moral durant mon sejour au Quebec.
Table des matieres
SOMMAIRE iii
R E M E R C I E M E N T S iv
Table des matieres v
Introduction 1
Approche probabiliste hybride pour la recherche d'images par le contenu
avec ponderation des caracteristiques 3
Conclusion 42
Bibliographie 43
Introduction
La Recherche d'Images par le Contenu ou Content-Based Image Retrieval (CBIR), est une technique qui localise, dans une collection, des images similaires a une requete en utilisant les caracteristiques visuelles telles que la couleur, la texture et la forme. Ces dernieres annees beaucoup de systemes CBIR ont ete developpes [6] [15]. lis sont motives par les multiples inconvenients des systemes de recherche par mots cles. Ces derniers, pour pouvoir retrouver une image, etiquettent toutes les images de la collection avec des mots cles, puis les techniques standards de recherche de texte sont appliquees pour re-tracer les images qui ont les memes etiquettes que la requete. Les systemes de recherche d'images par mots cles souffrent de la capacite limitee des mots a decrire le contenu d'une image. En plus, l'enorme quantite d'images disponibles dans les bases de donnees et Internet rend le processus d'annotation tres couteux. Ces inconvenients ont donne nais-sance au nouveau paradigme CBIR, dans lequel la similarity entre images est determined par leurs contenus visuels. Plusieurs descripteurs globaux et locaux decrivant le contenu (couleur, texture et la forme) ont ete utilises dans la litterature [12] [4] [11] [13] [7] [8], un descripteur global decrit l'image complete, le local decrit une region dans l'image. Ces descripteurs de contenu sont qualifies de bas-niveau car ils ne refletent pas la semantique des images. Deux images totalement differentes peuvent avoir les memes descripteurs. Ce fosse semantique constitue le premier defi pour la recherche d'images par le contenu. Une solution possible consiste a introduire la semantique grace au retour de la pertinence [10] [7] [3] [13]. Les utilisateurs sont amenes a faire des jugements sur la pertinence par rap-port a leurs besoins et les images retournees par le systeme. Le jugement obtenu permet de modifier des parametres du processus de recherche. Un autre defi pour les systemes de recherche d'images par le contenu est d'etre des systemes temps reel, en d'autres termes
avoir un temps de recherche acceptable independamment du nombre d'images dans la collection. L'organisation de la collection d'images s'impose alors, actuellement la plu-part des systemes utilisent les structures de donnees [1] telles que les arbres. [9] compare differentes structures d'arbres utilisees par des CBIRs, il constate que leur performance d'indexation diminue rapidement quand la dimension des descripteurs visuels augmente. Ces structures de donnees ne sont pas adaptees a gerer et indexer des donnees a grandes dimensions ce qui est le cas de la plupart des descripteurs visuels. Les approches alter-natives qui semblent prometteuses sont basees sur des modeles probabilistes [2] [5] [14]. L'utilisation de ces modeles pour l'organisation des collections d'images diminue aussi le fosse semantique produit par les descripteurs visuels de bas-niveau. Dans ce memoire, nous developpons une approche probabiliste hybride (generative/ discriminative) pour l'organisation et la recherche d'images par le contenu. Sur une collection d'images orga-nisee hierarchiquement en noeuds selon la semantique des images, nous appliquons une approche generative pour l'estimation des melanges de probabilites qui representent l'ap-parence visuelle de chaque noeud dans la collection. Ensuite nous utilisons une approche discriminative pour l'estimation des poids des caracteristiques visuelles pour maximiser la separation entre les noeuds. L'idee de base dans notre travail est l'utilisation de notre approche pour identifier les noeuds qui representent mieux la semantique de la requete, apres la recherche d'images est limitee a ces noeuds. Cette utilisation nous permet de diminuer le fosse semantique cause par les caracteristiques visuelles de bas-niveau. Nous proposons un algorithme d'extraction de descripteurs visuels locaux de couleur, de tex-ture et de forme qu'on nomme puzzle, qu'on compare au descripteur SIFT identifie dans la litterature parmi les meilleurs descripteurs visuels locaux proposes [11]. Dans le reste du memoire nous detaillons notre modele pour la recherche d'images par le contenu via un article, et une conclusion resume le travail et propose quelques perspectives.
Approche probabiliste hybride p o u r
la recherche d'images par le contenu
avec ponderation des
caracteristiques
Dans ce chapitre, nous exposons le travail intitule "A Hybrid Probabilistic
Fra-mework for Content-Based Image Retrieval w i t h Feature Weighting". Dans
ce travail nous developpons un modele probabiliste hybride pour l'organisation des col-lections d'images. Les methodes existantes sont basees essentiellement sur les structures de donnees telles que les arbres. Ces structures de donnees ne sont pas adaptees a des donnees a grande dimension tels que les descripteurs visuels des images. Les modeles pro-babilistes semblent mieux adaptes pour l'organisation des collections d'images a cause de leur capacite a representer efficacement les donnees a grande dimension. Kherfi et Ziou [5] ont propose un modele probabiliste hierarchique pour la recherche d'images par le contenu. lis ont montre la capacite d'une telle approche a gerer et organiser les col-lections d'images. Dans la meme vision, nous proposons un nouveau modele probabiliste hybride. La collection est decrite a travers une ontologie hierarchique decrite par un arbre. Nous utilisons une approche generative pour la representation des noeuds d'images par des melanges de probabilites. Les approches generatives sont connues pour leur flexibi-lite vis-a-vis l'estimation et la mise a jour des parametres des melanges de probabiflexibi-lites. Le modele generatif est consolide par une analyse discriminative pour renforcer davan-tage les caracteristiques visuelles pertinentes. Dans ce travail, nous avons aussi developpe
notre propre algorithme pour l'extraction des descripteurs visuels de couleur, texture et forme. Notre approche a ete validee sur une collection de 4300 images. Dans ce qui suit, nous detaillons le modele probabiliste dans un rapport de recherche a soumettre a un journal international. Cet article constitue l'aboutissement de mes travaux de maitrise en informatique sous la direction du professeur Djemel Ziou.
A Hybrid Probabilistic Framework for Content-Based
Image Retrieval with Feature Weighting
Touati Hamri and Djemel Ziou
D e p a r t e m e n t d'informatique, Universite de Sherbrooke, Quebec, C a n a d a . Emails:{touati.hamri, djemel.ziou}@usherbrooke.ca
A b s t r a c t
In this paper, a hybrid probabilistic framework for CBIR modeling is proposed.
To build a retrieval system that runs on a collection of thousands of images, the collection is indexed. The indexing techniques currently used are based on the clas-sical multidimensional access methods, for example, trees. The performance of such techniques decreases rapidly with the increase of data dimensionality. Since data types such as images are generally represented by high-dimension low-level features, these data structures are not suitable. Here, we develop a probabilistic framework for image collections organization, which is better suited to high-dimension data, and brings a semantic property to the retrieval process, narrowing the gap between human perception and the low-level features. To make our framework more flexible than existing ones, we use a generative approach to estimate the model parameters. We develop a discriminative approach for feature weighting to improve the cluster-ing performance of the generative model. Furthermore, we propose an algorithm to extract local color, shape, and texture features. Our local shape feature performs better than the well-known SIFT in our model.
Keywords: Content-Based Image Retrieval, collection organization, feature
1 Introduction
In the last ten years a number of Content-Based Image Retrieval (CBIR) systems have been proposed[18][36]. These systems are motivated by several drawbacks of keyword-based image retrieval systems, including the limited capacity of keywords to describe image content and the rapid expansion of multimedia technology which increases the number of images in databases and Internet, making the annotation process very expen-sive. CBIR systems retrieve relevant images in a database using visual content of the images, colors, textures and shapes. In general, such systems differ from each other in five ways: what visual features they use, how they evaluate the similarity of the images, how they index their collection to increase the efficiency of the retrieval process, how they express their query, and the manner in which they employ user feedback to improve retrieval.
For the features, several describing color, texture and shape have been used in litera-ture. Color features include the color histogram [9] [8], the color coherence vector [30], the color co-occurrence matrix [37] [7] [21] [15] and color moments [9] [19] [33] [8] [24]. Under texture features we find values derived from the gray-level co-occurrence matrix[19], the Tamura feature[37], wavelet coefficients[9] [33], Gabor filter-based features [8] and local binary patterns [34]. More details on texture can be found in [26]. Some shape features are the normalized inertia [9], the directional fragment histogram [38], Zernike moments [8], the histogram of edge direction [33] and the edge map [2] [40] [20]. A feature descrip-tor can be dense or discrete. A dense feature is computed on all pixels, while discrete ones are computed on a subset of pixels. To extract discrete features two techniques are commonly used. The first applies a segmentation algorithm to divide the image into homogeneous regions, after which a feature descriptor is extracted from each region [17] [9]. The second technique is to detect salient points (called also interest points or regions of interest, ROI), after which we calculate a feature vector around each of them. Several salient point detectors and descriptors have been proposed in the literature, including the Scale Invariant Feature Transform (SIFT) [23] and the Harris-Laplace regions [27]. For more details, see [28], where Mikolajczyk and Schmid compare several salient point detectors and descriptors.
Once image features are extracted, another problem is how we can measure the sim-ilarity between them. Rubner et al [32] give a good summary of the various similar-ity measurements. They classify them into heuristic distances like the Minkowski-form
distance Lp, non-parametric test statistics such as the X2-statistic, information-theory
divergences such as the Kullback-Leibler divergence, and ground distances such as the
quadratic form. Note that when we deal with ROI we need a matching strategy in
addi-tion to the similarity measurement, because of the fact that one image region can match several regions in another image. The study described in [28] compares three strategies:
threshold-based matching, nearest-neighbor matching, and nearest-neighbor distance ratio matching. Generally, authors use similarity measurements suited to their features and
query model. For example, in [17], a probabilistic metric based on likelihood estimation is used.
CBIR systems use low-level features to represent images. However, these features don't necessary represent the human perception of these images. To overcome this gap between low-level features and image semantics, authors have introduced the user need as a dimension in the system. This intervention is known in the literature as
Rele-vance Feedback (RF): the user is asked to give a judgment on the retrieved images by
selecting those which are relevant and irrelevant to his query. The system will use this judgment to improve retrieval. Two main approaches exist in the literature, the optimal
query technique and feature weighting. In the optimal query technique (see [25]) the
system updates the query according to user feedback by finding the query value that minimizes the distance from the user-relevant images, and maximizes that from the ir-relevant images. In feature weighting (see [19] [10] [33]) systems increase weights for the features that discriminate between relevant and irrelevant images, and reduce them for non-discriminating features. When measuring the similarity between the query and images, the features with high weights thus make a greater contribution.
Another important thing in CBIR systems is the indexing of the image database. To build a retrieval system that runs on a collection of thousands of images, the collection must be indexed. Compared to the body of literature on retrieval approaches, little work has been done on visual content-based indexing. The currently used indexing practice seems to be based on the well-known multidimensional access methods (R-tree,
R+-tree,R*-tree, KD2B-tree). A good summary of these methods can be found in [1].
In a comparative study of the existing structures used in CBIR, [22] Ling et al report that their performance decreases rapidly as the data dimension increases. So these data structures are not useful when dealing with high-dimension data, which is the case for data such as images and video. Alternative approaches that seem promising are based on probabilistic and neural network models such as those reported in [3] [16] [35]. Such frameworks are commonly used in the object recognition field for example [14] [39] [12]. These frameworks have an important property: they incorporate a semantic meaning for clusters. Using them to index databases for CBIR will help to improve retrieval performance by eliminating semantically irrelevant clusters, giving a semantic property to the retrieval process and bringing it closer to human perception. This kind of approach is in its infancy and more effort is needed in this direction.
This work is related to the research done by Kherfi et al [16]. They develop a prob-abilistic approach for modeling image collections, applied to a hierarchical collection of images. Their approach offers several interesting characteristics. It is applicable for differ-ent purposes: indexing, retrieval, browsing and summarizing. It combines image contdiffer-ent with keywords, narrowing the semantic gap; it is hierarchical and thus suitable for index-ing. The advantages of the hierarchical model have been demonstrated by several studies like [3] and [35]. However, the maximization of their model parameters is done for the whole collection at the same time, so that the optimal parameters for a given class in the collection depend on the parameters of all classes at the same level. This fact makes updating the collection (adding/removing classes or images) very heavy, and requires the model to be refit at each significant update. By significant, we mean an update that re-quires a model parameter update, for example adding a class. To better understand this problem, let us recall the concept of a generative/discriminative probabilistic framework. In general, we can divide the probabilistic models existing in the literature into two ap-proaches: generative and discriminative. In generative models like those described in [11] [5], the model for each class is learned separately by using only its data set. With this paradigm, the aim is to be able to reproduce the class. Using probabilistic terminology, let's call the data o and the class m. With generative models we aim to estimate the probability density function p(o \ 6m) where 0m are the PDF parameters that represent
m. In the discriminative approach [35] [13] [39], the borders between classes are learned
using all classes in the data set at the same time. So p(9m \ o) is learned instead of
p(o | 6m) in the generative approach. In the literature, discriminative approaches have
proven their superiority to generative ones in classification performance [29]. However unlike generative approaches, they do not handle the problem of missing data and adding or removing a class means performing a new learning process for all the data, which is very time-consuming. Generative and discriminative models can be combined, as in [14], to produce what we call a hybrid model. Such models aim to combine the flexibility of the generative and the performance of the discriminative approach. In our work we aim to produce a probabilistic approach that is flexible and discriminative. Using the same paradigm proposed by Kherfi et al., we develop a hybrid model. First we use a generative approach to represent our image classes with different features, producing a PDF for each class and feature separately; then we apply a discriminative approach, to estimate the feature weights to be used to combine features that maximize the separation between classes. We have applied this hybrid approach to a hierarchical collection, where each class in the hierarchy will have its own feature weights that maximize the discrimination between it and its neighbors.
Section 2 presents our approach. We explain the technique used to model the collec-tion and the feature weighting schema, followed by a detailed descripcollec-tion of our cluster-ing and retrieval process. Section 3 presents our feature extraction algorithm, that we call puzzle-feature, which gives us local color, shape and texture features. We go onto demonstrate that in our model, it performs better then the well-known SIFT. Section 4 presents the details and results of our experimental tests. Section 5 gives our conclusion and directions for future work.
2 Collection m o d e l i n g
A collection is a set of visual documents, an ontology, and a global description of the collection. A visual document is the representation of a concept formed by one or more objects, the relationship between them, and any kind of associated metadata. It can be an image or regions of interest that are structured on a local ontology, and represented
by radiometric vectors. Each radiometric feature is represented by local and/or global vectors. For example, color may be represented by a global histogram of color and/or by color vectors representing key regions of the visual document. A prior; knowledge describing the semantic content (such as object name) is associated with each node in the collection, for example the "animals" node or airplanes node.
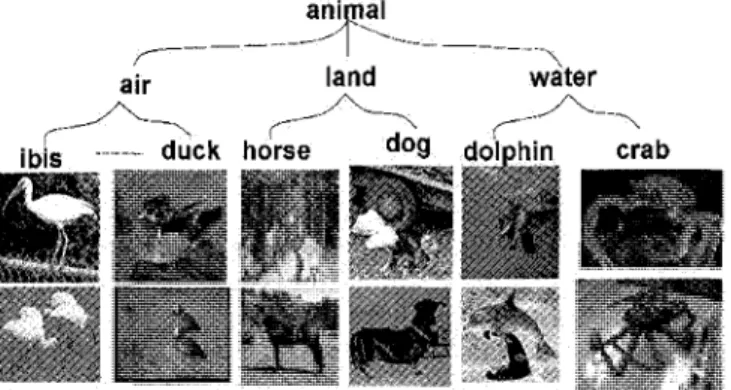
For our purposes, an ontology is a hierarchical (tree) data structure containing all the relevant objects related to a specific domain, their relationships and the rules within that domain. The choice of a hierarchical structure will help us in the feature weighting process, where the idea is to define, for each level in the hierarchy, its proper feature weights. For example for cars and apples, shape features will be helpful to separate them while in the case of red apples and green apples, color features will be more helpful than shape. So a hierarchical structure has a very interesting property that we will exploit in our model. Figure 1 gives an example of a hierarchical structure, where the root is the node "animal". In "animal", we find "air", "land", and "water" animals. These are
intermediate nodes, and each of them has its daughters which are the leaves. In such
a collection, the images belonging to an intermediate or root node are all its daughters images.
2.1 T h e model
Modeling the collection makes it possible to understand the data, extract missed infor-mation, and increase the accuracy of the management system. It makes the management straightforward in the sense that any management operation is directly deduced from the way the collection is modeled. In our model, the management of visual documents is based on their features. The definition and the computation of these features are based on the radiometrical content of the visual document, such as color, texture, shape, and regions of interest. Our collection is organized into several node levels, where each node is an abstraction of an object or set of objects and their relationship, providing semantic information on visual documents. Due to the uncertainty in visual data, the main idea underlying our collection modeling approach is to estimate, for each node in the collec-tion, its probability density function (PDF) representing the appearance models of its associated visual documents.
Mathematically, consider m — (l,c) a collection node, where I indexes the levels and c the node at level /. The appearance model of m is a PDF mixture of o defined by:
Kic
p(o | om) = Y1P™P(° I Q™i) (i)
p(° I 8m) is a mixture of K\c clusters with a parameter vector 9m that indicates how the
visual document o can be generated by the node m, where pmi is a mixing parameter and
p(o | 0mi) a P D F with parameters 9mi. Modeling the collection requires the estimation
of all parameters maximizing the likelihood for each node. The likelihood formulation is given as follows. Each visual document is represented by Nr regions of interest, each
of which has Nf specific features. Such region may be homogenous parts of an object, inhomogeneous regions (e.g., regions containing a point of interest). It should be noted that one of these regions is the visual document itself, allowing a global representation. For example, let us assume that the visual document represents a face. The face is described by regions of interest obtained by a detector such as SIFT or Harris-Laplace. A vector of features provided by the detector is associated with each region, allowing the face to be described by a set of vectors. Furthermore, the node is formed by N0 visual
documents o. The global generative likelihood for a given node m is expressed by:
Nf • N0 Nr Kmf
^ = n i l H(J2 PmfiP(^onrf I 0mfi)) (2)
/ = 1 n = l r = l %=\
where a0„r/ is the vector feature / describing the region r in the document on. Kherfl et
al. [16] use the same idea, but they define their likelihood for a given level I, which leads to a costly maximization schema. Our likelihood is defined for each node separately, which makes it more flexible when processing an update. We maximize the likelihood of each P D F mixture separately using an EM algorithm. The accuracy of the collection modeling depends on the choice of PDFs to be used and the optimization algorithm. The PDFs must fulfill the following requirements: 1) accurately reproducing the shape of the data space; 2) allowing statistical interpretation of the data; and 3) allowing modeling in high-dimensional space. To fulfill the above requirements, we chose a Dirichlet of the second kind. This PDF has nice properties such as a flexible shape (asymmetric, symmetric) and allowing the modeling of high-dimensional data [4]. If a random vector
X = (Xi,X<2, ...,Xd) follows a generalized Dirichlet distribution, the P D F is given by:
**
x
'HMm
xt
"
1(1
-t
x
'
r
"
(3>
where £f= 1 Xt < 1, 0 < X, < 1 for i = l,...,d, 7, = A - ai+x - 0i+i for i = l,...,d- 1,
and 7d = (3d - 1.
The mixture parameter estimation is done by the EM algorithm proposed in [4], where a d-dimension generalized Dirichlet mixture parameter estimation problem is reduced to the estimation of d Beta mixtures. Details on this EM are given in Appendix B. Note that in the definition of the generalized Dirichlet distribution, we have two conditions on the data: YA=I XJ < 1 and 0 < Xi < 1 for i = 1, ...,d. Since we can't be sure that the
data we are using satisfy these conditions, we must apply a transformation to the data. Details on this transformation are given in Appendix C.
2.2 Feature weighting
For a given node, the relevance of different features is not the same. For example, the texture feature will be relevant in the case of textured images and irrelevant in non-textured images. Consequently, features cannot contribute to the retrieval process in the same manner and a weighting process must be applied. The model in Equation 1 is well known in the literature as the least semantic probabilistic model. We will make significant improvements to this model by increasing its data-clustering capabilities by using feature weighting.
The definition of p(o | 9m) requires particular attention. Let us consider two features.
The first feature is shared by all nodes and p{p | 9m) for all I is high. For the second,
p(o | 6m) is high for node m and low for the other nodes. The second feature allows us
to discriminate between nodes and its contribution in the clustering process is desirable, while that of the first feature is not. More generally, a feature is relevant if p[p \ 6m) is
high and this is not the case for nodes at the same level of abstraction. Otherwise it is irrelevant. The introduction of the relevance of features reduces the confusion between nodes, thus leading to more accurate clustering. We define the relevance of a feature / for a node m as:
No Nr r>(a f I 9 )
Pmf - I I I I ^ -Tn TFT W
„ = l r = l l^kenV{a0nrf \ #fcj
where Q is a list of nodes at the same abstraction level.
At a given abstraction level, the weighting process consists in defining feature weights. These weights enhance r-^P /r/ ,a N in the clustering processes for relevant features
and attenuate it for irrelevant features. Consequently, the weights for a relevant feature should be high, meaning that its participation will be greater than other features, and low for an irrelevant feature, meaning that its participation will be less than that of other features. Once all node parameters are estimated for all features, these weights (a) should maximize the following discriminative likelihood which is denned for a given list of nodes fl:
Na N0 Nr N, v(a ,\0 )
i
n
= n n n n ( / y ' z/
/amf
^
m = l n = l r = l / = l l^keQ. P\uonrf I Vk)
Since ^ n,r/ m]fl ^ € [0,1], then when o w is close to 0, l/<7m/ is high and the
feature relevance is attenuated, while when amf is high, l/<rm/ is low and the relevance
of the feature is increased. For convenience, we maximize the log of equation (5). For two given features, it is sufficient to compare the relative attenuation of the irrelevance. That is, if one of these two features is more relevant then its weight should be greater. Consequently amf can be chosen between zero and one. We need to estimate amf by
maximizing equation (5) under the constraint Z)/=i ° W = 1- We obtain (see Appendix A):
l-TN° TNr loa(^p{a°nrt^m) }
amf — . (o)
Based on the above analysis, the schema in Figure 2 summarizes our model.
2.3 Retrieval
Let us recall that retrieval is a ranking of the visual documents available in the collection according to the user query Since in our collection, each node is an abstraction of a given semantic meaning (object name), the idea behind our model is to identify the k best nodes in the collection that most closely represent the semantic meaning of the user query, after which, the retrieval is limited to these k best nodes. We have chosen to select
k nodes, because the user query can match several nodes if it contains several objects, k
can be set to a given value or determined by thresholding the score. In our experiments, we set k to a given value. So our retrieval process involves two steps: 1. identifying the
k best nodes in the collection and 2. performing a retrieval from these k nodes.
Note that our collection is organized hierarchically, so the node ranking process will also be hierarchical. Starting with the root's daughters, we rank the nodes and keep the
k best ones. Then for each chosen node, we rank its daughters and again keep the k best
ones. The process is repeated until all the chosen nodes are leaves. Finally, we rank the leaves retained. The images belonging to the k best leaves will participate in the image ranking to determine the best images. We will now detail the node ranking process for a given level of abstraction, which is used hierarchically to identify the k best leaves, as explain before. We also give the image ranking process used to identify the images most
Hierarchical collection of images O ...
A\
Generative estimation of model parameters I. -Maximization AV A', S'r *"•»! =If II IKE^'^a
,r/
f<W*))
~4l
'(«Si3X?i • • %)-• C|i;3) 01-3/'' C ^ X ^ j f } - '
C'&..ef)(9i...%)(ei:;:0}"B
Discriminative estimation of feature weights Maximization,,,__
n fj
n ni^Ll^L ,. *.,
{\<Ti.,.<JfJ '- (51- • • °f) VS;' • "V - °i.'3<-'"similar to the query.
Consider that we have a query Q = qx A ... Ag„ where A is the "and" operator and
qi is an image. This query form which is the same used in [16] and [3], enables us to
combine positive images. Note that query forms combining negative and positive images have been used in the literature: for more details see [19]. For a given level of abstraction /, the node ranking can be defined as a ranking of the probabilities that each node at I generates the query Q. These probabilities are calculated using a Bayesian rule where we combine all features using their weights. The node ranking is done by the equation:
N,
argmaxm€i{ J ] p(0mf | Q)l/c7mt} (7)
/ = i
where amj is the weight of feature / calculated as described in section 2.2 and p(9mf | Q)
indicates how probable the query is to be generated by the node m using the feature / . According to Bayes' rule, we have:
Ptfmf I Q) p{Q 1 Omf) EkeiPiQ I 0kf)
Assuming that all <& and aqij are independent, we have:
n Nir
P{Q | Omf) = I I I I P(aQdf I Omf)
i = l j=l
where n is the number of images in query Q, Nir the number of regions of interest in
image qi, aqijf is the descriptor of feature / in region j in qi and p(aqijf | 0mj) is the score
given by the PDF representing the node m using feature / .
For image ranking, let ip be the list of images o belonging to the k best nodes chosen according to Equation 7. When performing retrieval in ijj, the image ranking will be done using all features by combining two similarities: semantic similarity and low-level similarity. Semantic similarity indicates the semantic resemblance between query Q and the node of image o, which is the probability that the node generates the query. The low-level similarity indicates the resemblance between the query and the image o using low-level features (color, shape and texture). The following equation gives the image ranking:
argmaxoeil{J] (p(0mf | Q)l/a^pf{Q \ o))} (8)
where p(6mf \ Q) (the semantic similarity) is defined as before and P/(Q \ o) (the
low-level similarity) is the similarity score between image o and query Q according to feature / . Since, in the proposed model, an image is characterized by regions of interest as seen in section 2.1, the low-level similarity measurement should be adapted to these regions of interest. Pf(Q | o) can be used both for similarity and matching. For matching, Mikolajczyk et al [28] perform a good evaluation of different regions of interest and compare three strategies of matching. We chose to use the Nearest Neighbor Matching (NNM) strategy, where two regions of interest A and B are matched if the descriptor of
B is the nearest one to the descriptor of A, and the distance between them is below a
given threshold. Let 4>qu0 = ((agiif,a0ij),..., ( a ^ / , a06i/)) be the list of the bi matched
regions between images qt and o according to the NNM strategy using feature / . We
define Pf{Q \ o) by:
n n 1 bi
Pf(Q I 0) = lipj(Qi I °) = I I ^ r (
6»
_ J2d(
aQdf>
aojf))
where d(aqijf, a0jf) is the distance between matched regions aQijf and a0jf using feature
/ . As a measure of similarity, we can use the Kullback-Leibler divergence [32] defined by:
p(Q\of) = l/KL(p(Q\9Qf),p(of\eof))
where 90f and QQJ are the PDF mixture parameters representing all regions of interest
using feature / in the image o and the query Q respectively. We use the same EM algorithm [4] used in model estimation to estimate 80f and QQJ. KL is a Monte Carlo
approximation of the Kullback-Leibler divergence given by:
Km
X\8
i)Mx\e
j))^\t\o
g^^
b m=l P\xm I uj)
where sample drawn according to p(x | 8i). Finally, note that in our experiments we use matching.
3 Visual features
In our CBIR system, we use several features describing color, shape and texture. We use the well-known feature SIFT, and we investigate a new feature that we call puzzle-feature, which can be applied to obtain local color, texture and shape. We will now details.
3 . 1 P u z z l e - f e a t u r e : a n e w f e a t u r e
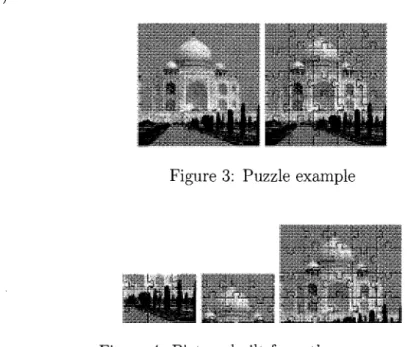
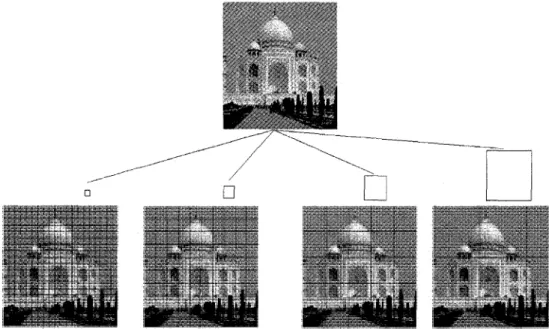
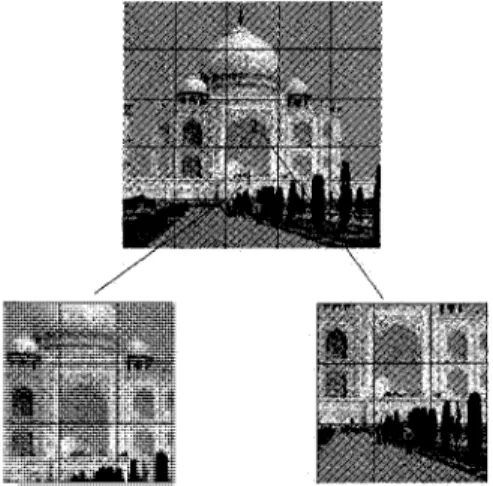
Our aim is to build a feature which will enable us to find even a part of an image. The idea is inspired by the familiar notion of "jigsaw puzzle" (see Figure 3 for an example). We build a picture puzzle by carving a given picture into small fragments, nearly the same shape, and then mixing them. People with inductive reasoning aptitude can resolve the puzzle (put all the pieces back together). The interesting thing about this puzzle, is that all of the pieces we can reassemble the full picture but also other pictures (see Figure 4).
i: (•'• '-' h
& - >"&*- _l ' l
-Figure 3: Puzzle example
I i • i
1 C * X.) ,0
Figure 4: Picture built from the same puzzle
The content of the puzzle pieces determines the nature of the features. If one uses pieces which describe the color, it will be a color-puzzle; shape content will make it
shape-puzzle; texture content, a texture-puzzle. We chose a square pieces shape because it is simple to handle, as shown in Figure 5.
i i
i t ;
•: • ;•
Figure 5: Square-based puzzle
The main question is what width of square to use. The answer to this question is the solution for the scale invariance feature problem. From an image we produce a series of puzzles, starting with a given width and doubling it until obtaining minimum 9 pieces for the puzzle as shown in Figure 6. Using this puzzle series, the puzzle feature will be composed by all the pieces of different width which preserve the image at different resolutions. 1 } 1 1 > 1 ' ' I'M, : , T i : "• •>: 1 Littl-lLiLJ «§^+|
•*— iliillllJ
^ - - * J ^
- M U * j 3 " r - •ft
rr.
;v
1 1 * i i , n 1 . - • ! « ?ft . .
l |
-' - I
i ' ' 1 1 1V*!
ar
Now, we need to maintain the neighbor relation between puzzle pieces. This rela-tion preserves spatial informarela-tion and decreases the interference between puzzle pieces. For example, pieces 1 and 2 (see Figure 7) resemble each other in color. We propose
I I " I
L*s?h- i i tare i m i I *. SJ «£ "Wpa.
\* ',' i ', r,y, ! >.«iL)l l"r,r * - • > • ' ! •J •f +r
; i V— [ ' MlM ^ i ^ « V i j *ijtj
ifEXPI
Figure 7: Interference between pieces
to use the following neighbor relation. Let Xp : (xpi,Xp2,...,xpn) be an n-dimension
vector which defines the content (color, shape, or texture) of the puzzle piece p. Let
Xi,X2,X$,X^,X$,XQ,XT,X$ be the vectors corresponding to p's neighbors. We define
the difference vector DPti between p and the neighbor X, by:
Up,i = v%>il> O'pili • ••> Q"pin)
\XpO %iOi Xpl Xil i — ) •Epn %in)
The neighboring relation between piece p and its neighbors is captured by the mean and variance of all JDP]1, DP i 2,..., DP{n dimensions:
1 8 j 8
Mean(Dp) = (Mpl,Mp2,..., Mp n) = ( - ] T G ^ I , , o X Xi n)
and
1 8 1 8
Var(Dp) = (Vpl, Vp2,..., V^) = (-^(MPi ~ dPn?, , « E (Mp n - dpinf)
So finally, each puzzle piece will be characterized by three vectors Xp, Mean(Dp),
makes the feature robust to scale. So to make the full feature robust to scale and rota-tion, we should choose an Xp vector that is also rotation robust. Now we will explain
the vectors (Xp) selected to build color, texture and shape puzzles.
3.1.1 Color-puzzle feature
We use the first and second moments (mean and variance) of each band in the CIE L*a*b color space. We have chosen the L*a*b space because it is a color-uniform representation. So our Xp for the color puzzle will be the 6-dimension vector Xp = (mean(l), var(l),
mean(a), var(a), mean(b), var(b)), which produces a puzzle piece vector totalling 18
dimensions after addition of the Means(Dp) and Vars(Dp) vectors.
3.1.2 Texture-puzzle feature
For texture we use gray-level images. The features derived from the co-occurrence matrix have been widely used in CBIR [19]. This matrix is indexed by a single displacement (8x,
8y), where as usually this matrix is calculated for several displacements. In our
texture-puzzle, we propose to use a feature derived from the co-occurrence matrix [15] indexed by a distance d instead of (8x,5y). So when estimating it, we check all pixels at distance d which make it invariant to rotation. We first transform our image into gray-level image. For each puzzle piece we calculate the gray-level co-occurrence using distance d=lpixel and derive from it the following values: Mean, Variance, Energy, Entropy, Contrast and Homogeneity. So our Xp for the texture puzzle will be the 6-dimension vector Xp =
(Mean(p), Var(p), Ener(p), entr(p), Contr(p), Homo(p)), which again produces a
18-dimension puzzle piece vector.
3.1.3 Shape-puzzle feature
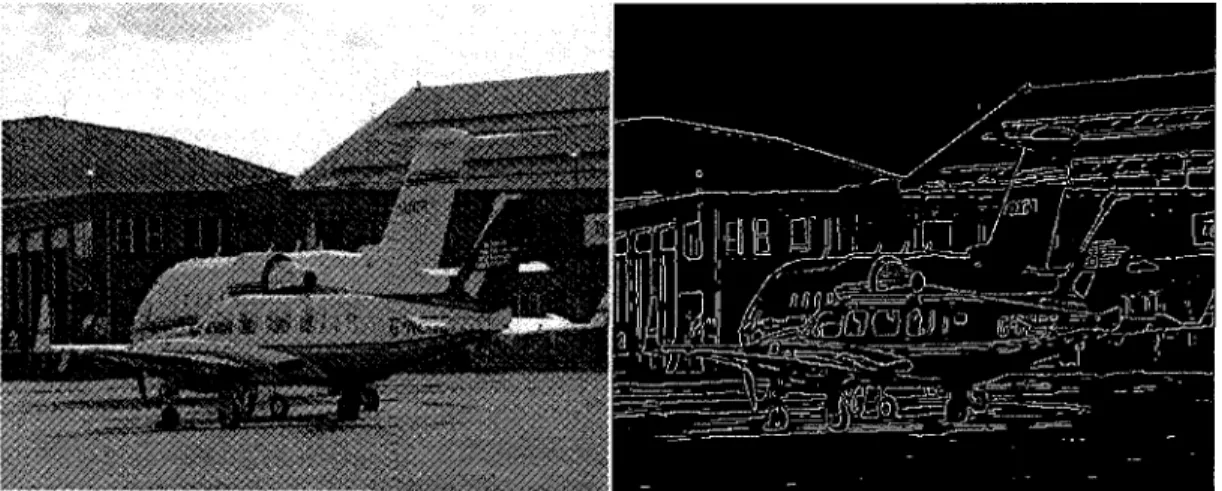
We introduce pixel type as a novel manner to characterize shape. We start by extracting the image edge map (see Figure 8). The edge map contains shape information; we will use it to build the shape-puzzle instead of using the original image. A standard shape representation that has been often used in the literature is the edge orientation histogram
Figure 8: Image edge map
applied to produce a normalized histogram. A small error in estimating this global orientation shifts all the edge orientations. As our shape feature, we use a differential
orientation histogram. The idea is is to characterize the edge pixel by an invariant
rotation measurement. This measurement is the mean and variance of the difference in orientation between its edge pixel neighbors. Figure 9 gives a simple example of these mean and variance calculation. We use 3 bins for the mean and 3 for the variance, which results in 9 bins or edge pixel types. We use a pixel-type histogram of 9 bins as a vector
90= j
135-Mean=(135c+9Qc+135c)'3=120c
Var=t'f!350-i20J):+(90=-120cy+(135c-i20:):J 3=450
Figure 9: Example of orientation difference mean and variance estimation
X to characterize the shape in puzzle pieces. In addition to this histogram, we use the
percentage of edge pixels in the puzzle piece. So our Xp for the shape puzzle will be a
10-dimension vector.
3.2 Other features used
For comparison purposes, in addition to color, texture, and shape puzzles, we also use the well-known SIFT 1 feature [23] which is identified in [28] as one of the best local
features existing in the literature.
4 Experiments
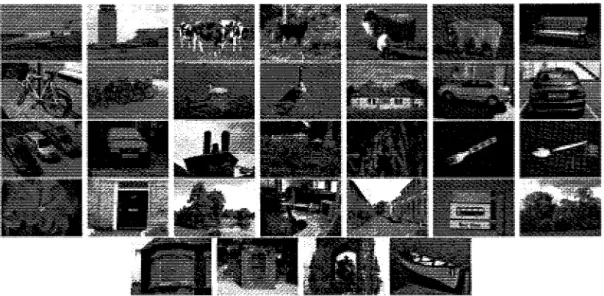
To evaluate our CBIR, we used the Microsoft Research Cambridge Image Database 2
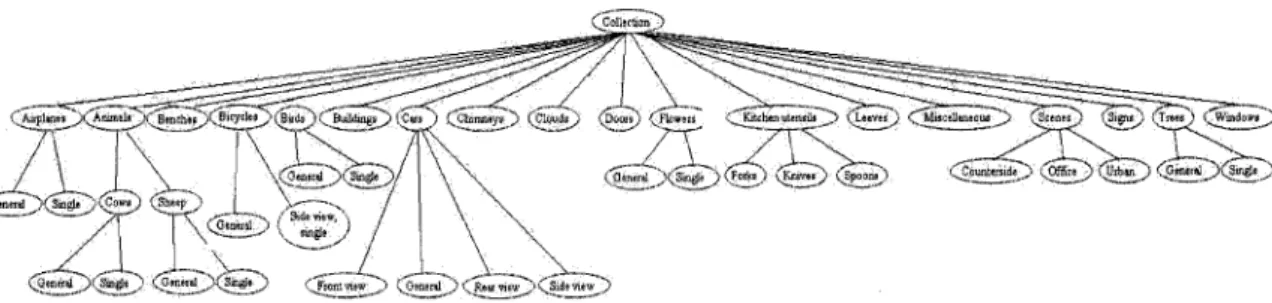
(retrieval, classification), which contains 4323 images (Figure 10 gives image examples). It is organized hierarchically, and has 33 leaves, as shown in Figure 11. 4158 images will
Figure 10: Examples of images from the collection
be used in the model learning phase, and the remaining 165 images (5 images per leaf) will
1http://www.cs.ubc.ca/~lowe/keypoints/
CcollKtion°^
Figure 11: The hierarchical structure of the collection
be used as described below. We carried out three experiments, each intended to measure a specific aspect of our system. The first measures the clustering performance and the improvement achieved by using feature weights. The aim of the second experiment is to evaluate the system retrieval performance. The third test is intended to evaluate the retrieval performance using external images (the 165 images); we make this test more challenging by applying several transformations to the images.
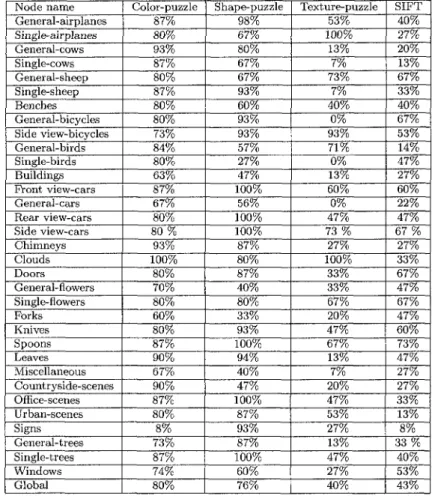
First Experiment: Each image in the learning database will be a query. This test
will be done for each feature alone, and after that, all features are used. Table 1 gives the precision results for all collection leaves using color-puzzle, shape-puzzle, texture-puzzle, and SFIT. Table 2 gives the precision results of combining features without weighting, and using our weighting schema. A substantial improvement in classification rate is achieved with our feature weighting schema.
Second Experiment: We randomly choose 15 images for each leaf, and use them as
queries. Each time, we check the number of similar images in the 10 top ranked images and the 20 top ranked images. We do a sequential retrieval by traversing the whole collection, and a retrieval using our model. Table 3 gives the precision results for all collection nodes using all features. We find that our model improves semantic retrieval performance, relative to sequential retrieval.
Third Experiment: Using only our model, we do the same test as in the second
experiment with the remaining images (the 165 images). Six transformations are applied to each images, giving us a total of 1155 images. The transformations are: zoom, rotation, zoom+rotation, deformation, image blur, and light change, as shown in Figure 12. Tables
Node name General-airplanes Single-airplanes General-cows Single-cows General-sheep Single-sheep Benches General-bicycles Side view-bicycles General-birds Single-birds Buildings Front view-cars General-cars Rear view-cars Side view-cars Chimneys Clouds Doors General-flowers Single-flowers Forks Knives Spoons Leaves Miscellaneous Countryside-scenes Office-scenes Urban-scenes Signs General-trees Single-trees Windows Global Color-puzzle 87% 80% 93% 87% 80% 87% 80% 80% 73% 84% 80% 63% 87% 67% 80% 8 0 % 93% 100% 80% 70% 80% | _ 60 % 80% 87% 90% 67% 90% 87% 80% 8% 73% 87% 74% 80% Shape-puzzle 98% 67% 80% 67% 67% 93% 60% 93% 93% 57% 27% 47% 100% 56% 100% 100% 87% 80% 87% 40% 80% 33% 93% 100% 94% 40% 47% 100% 87% 93% 87% 100% 60% 76% Texture-puzzle 53% 100% 13% 7% 73% 7% 40% 0% 93% 71% 0% 13% 60% 0% 47% 7 3 % 27% 100% 33% 33% 67% 20% 47% 67% 13% 7% 20% 47% 53% 27% 13% 47% 27% 40% SIFT 40% 27% 20% 13% 67% 33% 40% 67% 53% 14% 47% 27% 60% 22% 47% 6 7 % 27% 33% 67% 47% 67% 47% 60% 73% 47% 27% 27% 33% 13% 8% 3 3 % 40% 53% 43%
Table 1: Classification rate for the first experiment using features separately
4 and 5 give the global result for all transformations. On the average, we achieve a retrieval rate of 53% similar images in the 10 top ranked images, and 47.3% in the 20 top ranked images for all transformations. This proves the robustness of our system relative to the transformations used.
Node name General-airplanes Single-airplanes General-cows Single-cows General-sheep Single-sheep Benches General-bicycles Side view-bicycles General-birds Single-birds Buildings Front view-cars General-cars Rear view-cars Side view-cars Chimneys Clouds Doors General-flowers Single-flowers Porks Knives Spoons Leaves Miscellaneou Countryside-scenes Office-scenes Urban-scenes Signs General-trees Single-trees Windows Global Without weights 80% 87% 73% 80% 67% 87% 80% 50% 93% 67% 54% 63% 70% 40% 67% 87% 80% 93% 67% 74% 87% 44% 80% 87% 93% 53% 77% 80% 87% 67% 80% 87% 74% 74.4% Feature weighting 87% 100% 87% 100% 100% 87% 100% 93% 100% 80% 80% 100% 78% 100% 100% 100% 93% 100% 87% 100% 100% 60% 93% 100% 93% 60% 93% 93% 93% 87% 93% 93% 80% 91%
Table 2: Classification rate for the first experiment using all features, with weights and without
N o d e n a m e G e n e r a l - a i r p l a n e s Single-airplanes General-cows Single-cows G e n e r a l - s h e e p Single-sheep Benches General-bicycles side view-bicycles G e n e r a l - b i r d s Single-birds Buildings F r o n t view-cars General-cars R e a r view-cars Side view-cars C h i m n e y s C l o u d s D o o r s General-flowers Single-flowers Forks Knives S p o o n s Leaves Miscellaneous C o u n t r y s i d e - s c e n e s Office-scenes U r b a n - s c e n e s Signs G e n e r a l - t r e e s Single-trees W i n d o w s G l o b a l 10 t o p r a n k e d images O u r m o d e l 8 7 % 100% 8 7 % 100% 100% 8 7 % 100% 9 3 % 100% 56% 8 0 % 100% 8 7 % 9 0 % 100% 100% 9 3 % 100% 8 7 % 100% 100% 6 0 % 9 3 % 100% 9 3 % 6 0 % 9 3 % 9 3 % 9 3 % 8 7 % 9 3 % 9 3 % 8 0 % 90.4% Sequential retrieval 3 7 % 5 7 % 3 6 % 3 2 % 56% 5 3 % 4 6 % 5 2 % 4 1 % 14% 29% 2 5 % 2 9 % 7% 7 7 % 6 5 % 5 5 % 9 1 % 5 1 % 3 0 % 3 5 % 2 2 % 50% 4 9 % 4 1 % 1 3 % 4 4 % 56% 5 8 % 3 0 % 5 0 % 3 5 % 4 5 % 4 2 . 8 % 20 t o p r a n k e d images O u r m o d e l 8 7 % 100% 8 7 % 100% 100% 8 7 % 100% 9 3 % 100% 2 8 % 8 0 % 100% 4 3 % 4 5 % 100% 100% 9 3 % 100% 8 7 % 100% 100% 6 0 % 9 3 % 100% 9 3 % 6 0 % 9 3 % 9 3 % 9 3 % 8 7 % 9 3 % 9 3 % 80% 86.9% S e q u e n t i a l retrieval 3 5 % 50% 3 4 % 34% 50% 4 9 % 4 4 % 5 0 % 36% 10% 2 4 % 2 8 % 26% 9% 70% 50% 6 0 % 8 5 % 4 2 % 2 7 % 30% 2 1 % 4 9 % 50% 4 0 % 1 1 % 4 2 % 5 0 % 50% 2 7 % 4 8 % 3 3 % 4 5 % 39.7%
ftp
fr**'s
*m
'is
Figure 12: Image transformations: (a) original image, (b) rotation, (c) zoom,
(d)rotation+zoom, (e) deformation, (f) blur, (g) light change
Node name General-airplanes Single-airplanes General-cows Single-cows General-sheep Single-sheep Benches General-bicycles Side view-bicycles General-birds Single-birds Buildings Front view-cars General-cars Rear view-cars Side view-cars Chimneys Clouds Doors General-flowers Single-flowers Forks Knives Spoons Leaves Miscellaneous Countryside-scenes Office-scenes Urban-scenes Signs General-trees Single-trees Windows Global Transformation Original image 10 top ranked images 50% 64% 72% 4 0 % 4 4 % 3 8 % 6 8 % 8 4 % 52% 2 0 % 34% 76% 54% 6 0 % 56% 76% 70% 100% 9 4 % 4 8 % 3 4 % 5 0 % 60% 66% 6 8 % 56% 6 6 % 5 5 % 4 8 % 72% 50% 5 5 % 94% 60% 20 top ranked images 4 4 % 5 5 % 6 5 % 5 5 % 5 0 % 4 5 % 6 5 % 8 5 % 5 5 % 2 7 % 3 0 % 8 0 % 5 0 % 5 3 % 4 6 % 70% 8 0 % 9 4 % 9 0 % 50% 4 4 % 4 0 % 6 3 % 6 8 % 5 5 % 5 5 % 5 0 % 4 7 % 2 8 % 7 0 % 4 7 % 4 2 % 9 0 % 5 7 % Rotation 10 top ranked images 4 7 % 6 3 % 6 5 % 4 0 % 4 6 % 3 3 % 6 4 % 79% 5 5 % 18% 30% 7 7 % 50% 6 0 % 50% 70% 72% 100% 8 7 % 4 8 % 4 0 % 4 7 % 56% 59% 70% 54% 6 3 % 52% 4 3 % 6 9 % 5 5 % 4 9 % 9 2 % 57.7% 20 top ranked images 4 3 % 58% 60% 44% 4 5 % 44% 5 5 % 7 5 % 6 5 % 14% 19% 7 5 % 5 5 % 49% 4 4 % 60% 7 5 % 90% 9 5 % 50% 4 3 % 3 5 % 54% 6 3 % 6 5 % 50% 5 5 % 44% 3 5 % 66% 4 5 % 4 8 % 9 1 % 54.8% Zoom 10 top ranked images 4 4 % 54% 4 8 % 3 2 % 3 0 % 3 6 % 4 8 % 76% 4 3 % 20% 34% 50% 6 8 % 56% 82% 70% 84% 100% 8 8 % 4 6 % 62% 4 4 % 64% 60% 5 8 % 6 6 % 4 4 % 4 0 % 4 2 % 72% 2 8 % 3 0 % 74% 54.3% 20 top ranked images 4 0 % 5 0 % 3 2 % 30% 20% 3 5 % 4 3 % 70% 3 0 % 1 5 % 2 1 % 3 3 % 60% 4 4 % 8 0 % 6 0 % 8 5 % 9 0 % 6 5 % 3 6 % 50% 3 0 % 4 1 % 4 0 % 5 5 % 6 0 % 4 0 % 4 3 % 3 8 % 70% 3 1 % 2 7 % 70% 46.5%
Table 4: Retrieval rate for original image, rotation, and zoom in the third experiment,
using weighting features.
N o d e n a m e G e n e r a l - a i r p l a n e s Single- airplanes General-cows Single-cows G e n e r a l - s h e e p single-sheep Benches General-bicycles Side view-bicycles G e n e r a l - b i r d s Single-birds Buildings F r o n t view-cars G e n e r a l - c a r s R e a r view-cars Side view-cars C h i m n e y s C l o u d s D o o r s General-flowers Single-flowers Forks K n i v e s S p o o n s Leaves Miscellaneous C o u n t r y s i d e - s c e n e s Office-scenes U r b a n - s c e n e s Signs G e n e r a l - t r e e s Single-trees W i n d o w s G l o b a l T r a n s f o r m a t i o n R o t a t i o n + z o o m 10 t o p r a n k e d images 4 4 % 4 2 % 3 5 % 5 6 % 4 0 % 4 2 % 4 4 % 72% 6 4 % 18% 2 0 % 4 5 % 64% 3 4 % 8 2 % 70% 80% 9 5 % 6 2 % 54% 4 4 % 2 9 % 5 4 % 4 7 % 7 4 % 5 6 % 4 0 % 3 8 % 4 7 % 5 8 % 24% 3 5 % 5 8 % 50.5% 20 t o p r a n k e d images 36% 2 8 % 3 3 % 4 8 % 3 1 % 2 9 % 8 2 % 70% 6 0 % 17% 10% 4 2 % 6 0 % 2 4 % 8 5 % 60% 6 6 % 8 4 % 6 0 % 50% 3 9 % 2 0 % 4 8 % 44% 6 5 % 6 0 % 4 1 % 3 0 % 4 1 % 60% 2 3 % 3 0 % 50% 4 6 . 3 % D e f o r m a t i o n 10 t o p r a n k e d images 5 6 % 4 6 % 4 0 % 7 2 % 4 8 % 4 4 % 5 8 % 7 6 % 4 6 % 2 0 % 2 3 % 52% 6 6 % 4 0 % 7 8 % 6 6 % 76% 9 6 % 8 0 % 3 5 % 4 0 % 4 4 % 5 0 % 4 8 % 6 4 % 5 4 % 4 4 % 3 2 % 4 3 % 5 2 % 4 8 % 50% 9 0 % 53.9% 20 t o p r a n k e d images 4 8 % 3 8 % 50% 6 0 % 30% 3 4 % 5 5 % 70% 4 1 % 1 3 % 18% 50% 5 5 % 34% 50% 6 0 % 70% 8 0 % 7 5 % 2 5 % 3 6 % 3 1 % 2 7 % 3 3 % 4 9 % 5 5 % • 4 5 % 2 8 % 3 6 % 4 9 % 3 7 % 4 7 % 8 5 % 45.9% Blur 10 t o p r a n k e d images 36% 40% 4 8 % 3 6 % 4 4 % 50% 66% 60% 5 2 % 15% 32% 8 8 % 4 8 % 40% 6 4 % 72% 72% 100% 92% 4 4 % 3 1 % 4 4 % 6 4 % 60% 54% 56% 6 6 % 3 6 % 30% 74% 19% 4 0 % 94% 53.5% 20 t o p r a n k e d images 34% 4 0 % 4 6 % 3 7 % 3 4 % 4 0 % 6 0 % 4 8 % 4 0 % 1 3 % 2 3 % 7 5 % 3 7 % 3 8 % 30% 3 8 % 7 0 % 9 0 % 8 5 % 3 6 % 2 8 % 3 9 % 4 0 % 4 3 % 4 8 % 52% 5 5 % 3 1 % 2 3 % 7 5 % 2 5 % 3 2 % 9 0 % 4 5 . 3 % Light c h a n g e 10 t o p r a n k e d images 3 0 % 4 8 % 2 2 % 2 6 % 4 6 % 3 2 % 30% 90% 8 4 % 18% 2 3 % 4 2 % 3 2 % 3 6 % 4 4 % 3 2 % 74% 52% 52% 56% 6 8 % 3 1 % 4 4 % 3 9 % 3 6 % 2 8 % 4 8 % 3 8 % 4 0 % 32% 2 0 % 26% 2 5 % 4 0 . 7 % 20 t o p r a n k e d images 2 8 % 3 8 % 14% 2 0 % 3 9 % 2 3 % 22% 9 0 % 8 5 % 1 1 % 12% 3 2 % 2 2 % 1 8 % 3 3 % 3 2 % 70% 5 0 % 4 0 % 50% 6 5 % 19% 3 3 % 3 1 % 3 5 % 3 5 % 5 5 % 3 9 % 3 6 % 3 5 % 14% 20% 2 3 % 35.4%
Table 5: Retrieval rate for rotation+zoom, deformation, and light change in the third experiment using weighting features.
5 Conclusion
In this paper, we have presented a hybrid probabilistic framework for CBIR modeling, using a generative approach for node parameter estimation, and a discriminative approach for feature weighting. We proved that defining feature weights for each node increases the systems clustering performance. We found also that processing retrieval with our model improves the semantic retrieval result, compared to sequential retrieval. So using a probabilistic framework for CBIR gives a semantic property to retrieval, narrowing the gap between human perception and low-level features. Furthermore, we proposed an algorithm to extract local color, shape, and texture features. Our experiments showed that our local shape feature performs better than the SIFT descriptor. In future work, we should apply our probabilistic framework to larger collections, and use more features. Indeed, increasing the number of images and features will give better assessment to the validity of our model.
References
[1] H.K. Ahn, N. Mamoulis, and H.M. Wong. A Survey on Multidimensional Access Methods. Research report, Hong Kong University of Science and Technology, Hong
Kong, 1997.
[2] M. Banerjee and M.K. Kundu. Edge Based Features for Content Based Image Retrieval. Pattern Recognition, vol.36, no. 11, p.2649-2661, November 2003.
[3] K. Barnard and D. Forsyth. Learning the Semantics of Words and Pictures.
Inter-national Conference of Computer Vision, vol.2, p.408-415, 2001.
[4] N. Bouguila and D. Ziou. A Hybrid SEM Algorithm for High-Dimensional Unsu-pervised Learning Using a Finite Generalized Dirichlet Mixture. Image Processing,
IEEE Transactions on. vol.15, no.9, p.2657- 2668, Sept 2006.
[5] G. Carneiro, A.B. Chan, P.J. Moreno, and N. Vasconcelos. Supervised Learning of Semantic Classes for Image Annotation and Retrieval. IEEE Transactions on
Pattern Analysis and Machine Intelligence, vol.29, no.3, p.394-410, March 2007.
[6] H. Chang and D.Y. Yeung. Kernel-Based Distance Metric Learning for Content-Based Image Retrieval. Image and Vision Computing, vol.25, no.5, p.695-703, 2007.
[7] M.H. Chang, J.Y. Pyun, M.B. Ahmed, J.H. Chun, and J.A. Park. Modified Color Co-Occurrence Matrix for Image Retrieval. LNCS, Advances in Natural
Computa-tion, vol.3611, p.43-50, 2005.
[8] T.S. Choras, T. Andrysiak, and M. Choras. Integrated Color, Texture and Shape Information for Content-Based Image Retrieval. Pattern Analysis and Applications, On line, first accessed, 2007.
[9] T.W.S. Chow, M.K.K. Rahman, and S. Wu. Content-Based Image Retrieval by us-ing Tree-Structured Features and Multi-Layer Self-Organizus-ing Map. Pattern
[10] G. Das, S. Ray, and C. Wilson. Feature Re-Weighting in Content-Based Image Retrieval. LNCS, Image and Video Retrieval, vol.4071, p. 193-200, 2006.
[11] L. Fei-Fei, R. Fergus, and P. Perona. Learning Generative Visual Models from Few Training Examples: An Incremental Bayesian Approach Tested on 101 Object Categories. CVPR , Workshop on Generative-Model Based Vision, vol.12, p. 178, 2004.
[12] K. Grauman and T. Darrell. The Pyramid Match Kernel: Discriminative Classifi-cation with Sets of Image Features. Proceedings of the Tenth IEEE International
Conference on Computer Vision, vol.2, p.1458-1465, 2005.
[13] A.D Holub and P. Perona . A Discriminative Framework for Modelling Object Classes. Computer Vision and Pattern Recognition, IEEE Computer Society
Con-ference on Publication, voll, p.664-671, 2005.
[14] A.D. Holub, M. Welling, and P. Perona. Combining Generative Models and Fisher Kernels for Object Recognition. Proceedings of the Tenth IEEE International
Con-ference on Computer Vision, vol.1, p. 136-143, 2005.
[15] J. Huang, S.R. Kumar, M. Mitra, W.J. Zhu, and R. Zabih. Image Indexing using Color Correlograms. IEEE Computer Society Conference on Computer Vision and
Pattern Recognition, p.762, 1997.
[16] M.L. Kherfi and D. Ziou. Image Collection Organization and Its Application to Indexing, Brosing, Summarization, and Semantic Retrieval. IEEE Transactions
On Multimedia, vol.9, no.4, June 2007.
[17] M.L. Kherfi and D. Ziou. Image Retrieval Based on Feature Weighting and Rele-vance Feedback. Image Processing, International Conference on, vol.1, p.689-692, October 2004 .
[18] M.L. Kherfi and D. Ziou. Image Retrieval from the World Wide Web: Issues, Techniques and Systems. ACM computing surveys, vol.36, no.l, p.35-67, March 2004.
[19] M.L. Kherfi and D.Ziou. Relevance Feedback for CBIR: A New Approch Based on Probabilistic Feature Weighting with Positive and Negative Examples. IEEE
Transactions on Image Processing, vol.15, no.4, p.1017-1030, April 2006.
[20] N.W. Kim, T.Y. Kim, and J.S. Choi. Edge Based Spatial Descreptor using Color Vector Angle for Effective Image Retrieval. LNCS, Modeling Decisions for Artificial
Intelligence, vol.3558, p.365-375, 2005.
[21] D. Liang, J. Yang, J.J Lu, and Y.C Chang. Image Retrieval using Weighted Color Co-Occurrence Matrix. LNCS, vol.3567, p. 161-165, 2005.
[22] H. Ling, W. Lingda, C. Yichao, and L. Yuchi. Indexing Structures for Content-Based Retireval of Large Image Databases: A Review. LNCS, vol.3689, p.626-634, 2005.
[23] D.G. Lowe. Distinctive Image Features from Scale-Invariant Keypoints.
Interna-tional Journal of Computer Vision, vol.60, no.2, p.91-110, 2004.
[24] Y. Lu, Q. Zhao, J. Kong, C. Tanh, and Y. Li. A Two-stage Region-Based Image Retrieval Approach Using Combined Color and Texture Features. LNCS, vol.4304, p.1010-1014, 2006.
[25] A. Marakakis, N. Galatsanos, A. Likas, and A. Stafylopatis. A Relevance Feedback Approach for Content Based Image Retrieval Using Gaussian Mixture Models.
LNCS, vol.4132, p.84-93, 2006.
[26] T. Mihran and K.J. Anil. Texture Analysis. In C.H. Chen, L.F. Pau, P.S.P. Wang(eds.), The Handbook of Pattern Recognition and Computer Vision (2nd
Edi-tion), p.207-248, World Scientific Publishing Co, 1998.
[27] K. Mikolajczyk and C. Schmid. Indexing Based on Scale Invariant Interest Point.
Proceedings Eighth IEEE International Conference Computer Vision, vol.1,
[28] K. Mikolajczyk and C. Schmid. A Performance Evaluation of Local Descriptors.
IEEE Transactions on Pattern Analysis and Matchine Intelligence, vol.27, no. 10,
p. 1615-1630, October 2005.
[29] A. Ng and M. Jordan. On Discriminative Vs. Generative Classifiers: A Comparison of Logistic Regression and Naive Bayes. In T. Dietterich, S. Becker and Z. Ghahra-mani (eds.), Advances in Neural Information Processing Systems 14, Cambridge, MA: MIT Press, 2002.
[30] G. Pass and R. Zabih. Histogram Refinement for Content-Based Image Retrieval.
Processing of the IEEE Workshop on Application of Computer Vision, Sarasota
1996.
[31] G. Qiu. Color Image Indexing using BTC. IEEE Transaction on Image Processing, vol.12, no.l, p.93-101, January 2003.
[32] Y. Rubner, J. Puzicha, C. Tomasi, and J.M. Buhmann. Empirical Evaluation of Dissimilarity Measures for Color and Texture. Computer Vision, The Proceedings
of the Seventh IEEE International Conference on, vol.2, p.1165-1172, 1999.
[33] L. Si, R. Jin, S.C.H. Hoi, and M. R. Lyu. Collaborative Image Retrieval via Regu-larized Metric Learning. Multimedia Systems vol.12, no.l, p.34-44, 2006.
[34] V. Takala, T. Ahonen, and M. Pietikainen. Block-Based Methods for Image Re-trieval using Local Binary Patters. LNCS, vol.3540, p.882-891, 2005.
[35] A. Vailaya, A.K. Jain, and H.J. Zhang. Image Classification for Content-Based Indexing. IEEE Transactions on Image Processing, vol.10, no.l, p.117-130, January 2001.
[36] R. C. Veltkamp and M. Tanase. Content-Based Image Retrieval Systems: A Survey.
Revised and extended version of Technical Report UU-CS-2000-34, October 28,
[37] Q. Wu, C. Zhou, and C. Wang. Content-Based Affective Image Classification and Retrieval by using Support Vector Machines. Proceedings of the Tenth IEEE
Inter-national Conference on Computer Vision, vol.1, p.136-143, 2005.
[38] I. Yahiaoui, N. Herve, and N. Boujemaa. Shape-Based Image Retrieval in Botanical Collections. LNCS, vol.4261, p.357-364, 2006.
[39] H. Zhang, A.C. Berg, M. Maire, and J. Malik. SVM-KNN: Discriminative Nearest Neighbor Classification for Visual Category Recognition. Proceedings of the 2006
IEEE Computer Society Conference on Computer Vision and Pattern Recognition,
vol.2, p.2126-2136, 2006.
[40] X.S. Zhou and T.S. Huang. Edge Based Structural Features for Content Based Image Retrieval. Pattern Recognition Letters, vol.22, no.5, p.457-468, April 2001.
Appendices
A Feature weights
NU N0 Nr Nf , | n \
^ - n n n ^
T
it 7W '
(9)
m=l ra=l r = l / = 1 ^keQ. P{uonr/ | Vk)
where NQ is the number of nodes in Q, N0 the number of visual documents of node
m, Nr the number of regions of interest in visual document o, Nf the number of features
used, and amf the weight of feature / for the node m. In order to maximize the log of LQ
under the constraints J2fii amf = 1 for 1 < m < NQ, we introduce a Lagrange multiplier
\m for each constraint. We obtain:
Na N0 Nr Nf 1 p(a0nrf | 9m) N(l Nf LiPmfiXmjlKmKN^lKfKNf = Y; J2Y.J2 ~ 1°9{^ ZJ~n T 7 T T ) + 2 ^ ^m (1 - ] T Cm/)
m=l n=l r=l /=1 °m/ l^keU P\ao„rf \ uk) m=\ f-\
To simplify notation, let us set Amf = En=i Hr=\ M v ^ H H r r ) - We obtain:
Nn Nf 1 Nfi Nf L(crmf, ^m)l<m<Nn,l<f<Nf = /_J / ^ A n / + 2 ^ Am( l — 2 ^ amf) m=l /=1 ° V f m=l /=1 We have: dL(amf ,\m) — Ajj X. = f) Aij . A, We have also:
dL{amf,\m) _ 1 ^Nf _ „ ~Nf , ^iV/ J_Ail _
9A^ - x ^ / = i ° V - u => 2^/=i o-j/ - i => 2v/=i V Ai
-(10)
/ = 1
10 and 11
A j