HAL Id: hal-00688516
https://hal.archives-ouvertes.fr/hal-00688516
Submitted on 17 Apr 2012HAL is a multi-disciplinary open access archive for the deposit and dissemination of sci-entific research documents, whether they are pub-lished or not. The documents may come from teaching and research institutions in France or abroad, or from public or private research centers.
L’archive ouverte pluridisciplinaire HAL, est destinée au dépôt et à la diffusion de documents scientifiques de niveau recherche, publiés ou non, émanant des établissements d’enseignement et de recherche français ou étrangers, des laboratoires publics ou privés.
Experimental and numerical VOC concentration field
analysis from flooring material in a ventilated room
A. A. Akoua, Bernard Collignan, François Maupetit, Olivier Ramalho
To cite this version:
A. A. Akoua, Bernard Collignan, François Maupetit, Olivier Ramalho. Experimental and numeri-cal VOC concentration field analysis from flooring material in a ventilated room. 7th International Conference, Healthy Buildings 2003, Dec 2003, Singapore, Singapore. pp.370-375. �hal-00688516�
Ake Ahiman Akoua, Bernard Collignan*, François Maupetit, Olivier Ramalho
CSTB—Centre Scientifique et Technique du Bâtiment, Marne la Vallée, France
ABSTRACT
The aim of this study is to analyse the impact of volatile organic compounds emissions from a solid flooring material on the concentration field in a ventilated room. A field study has been conducted in the CSTB experimental house MARIA. Measurements were performed in a test room recently equipped with a flooring material made of pine wood and under controlled ventilation conditions. α-Pinene was selected as tracer from flooring VOC emissions. Velocity and temperature fields are measured in different points of the room. As the experiment is
conducted in a room of a real house, thermal conditions cannot be imposed. However, indoor wall surface temperatures are measured in order to control the stability of boundary conditions during the experiment.
α-Pinene concentrations were measured in the test room and in the extract flow. The emissions of the solid flooring material can be calculated from those measurements considering α-pinene as a non reactive compound and steady state conditions.
Experiments were conducted for different air flow rates controlled with a mechanical extraction placed on the door of the room.
Measured α-pinene concentrations and air velocities have been compared with steady state computional fluid dynamic (CFD) calculation fields. They show a good agreement.
We observed a relatively homogeneous VOC concentration field in the room except in the air flow supply and near the flooring surface where stratification of the tracer occurs.
INDEX TERMS
Indoor air quality; VOC; Ventilation efficency; Experiment; CFD simulation INTRODUCTION
We spend 90% of our time in enclosed spaces, so the indoor air quality becomes an important parameter, especially for our health. It is important to analyse the efficiency of ventilation system in comparison with indoor air quality.
This paper presents a study on the impact of volatile organic compounds (VOCs) emissions from a solid flooring material on a ventilated room indoor air quality. The study has been
conducted in a ventilated room of the CSTB experimental house MARIA (Riberon and O’Kelly, 2002) in order to represent a realistic configuration. The room has been equipped with a flooring material made of pine wood which emit a several VOC. The major identified VOC is α-pinene which can be considered as a good tracer of the flooring emissions.
Velocity, temperature and VOC tracer concentrations are measured in the room and in the extract flow. The emissions of the solid flooring material can be calculated from those measurements considering the VOC tracer as a non-reactive compound and steady state conditions.
Based on experimental measurements, steady state CFD calculations are performed. VOC tracer concentrations distribution and its impact on indoor air quality are analysed.
Ventilation 371 METHOD
The Experimental Set-up
Experimentations have been conducted in a room of the experimental house MARIA to study the impact of VOC emissions on the indoor air quality.
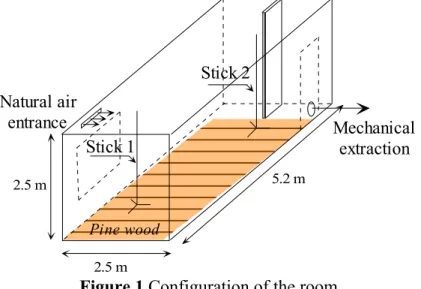
The room was equipped with a flooring material made of pine wood on July 29, 2002. Figure 1 shows the configuration of the room.
Natural air entrance Mechanical extraction Stick 1 Stick 2 2.5 m 5.2 m 2.5 m Pine wood
Figure 1 Configuration of the room
Ventilation rate is controlled with a mechanical extraction situated at the bottom of the door. The experimental measurements were carried on 30 July 2002 with 1 a.c.h. and 6 September 2002 with 0.5 a.c.h. The aim of the study is to analyse stationary contaminant transport. Because thermal conditions are not imposed, experimental measurements are carried out at the beginning of the morning to avoid great variation of temperature. The flow is supposed to be at the steady state when the stability of air velocity at the inlet and at the extraction is confirmed.
Wall temperature measurements are carried out using Pt 100 sensors which accuracy is ±1°C. Air velocity and temperature measurements are performed in the room using hot-wires probes type DANTEC situated on sticks 1 and 2. The accuracy of the thermoanemometrical sensors are ±0.01 m/s ± 3.5% of reading for velocity, and ±1°C for temperature (DANTEC 5203).
VOC concentrations are measured according to the ISO/DIS 16000-6.2 draft standard (ISO, 2002). VOC sampling is performed by pumping air through TENAX TA adsorbent tubes (Perkin Elmer) during 1 h. The accuracy of VOC measurements is estimated at ±10%. Details on the VOC concentrations measurement protocol can be found in Nicolas et al., (2003).
In order to be consistent with VOC measurements, the air temperature and air velocity measurements are averaged over 1 h.
VOC emissions of the flooring material vary with time, especially during the first few days after installation where decrease of emissions is generally observed (ECA/IAQ, 1997). Nevertheless, during 1 hour, variations are low and emissions can be considered as relatively constant.
Based on airflow rate Q and VOC tracer concentration at the mechanical extraction ( α-pinene outlet
C ),
the pine wood VOC tracer mass flow rate q in the room is evaluated as follows: α-pinene
outlet
q= Q C⋅ (1)
Each test is characterized by Reynolds number (Re), thermal Archimede number (ArT), solutal
Archimede number (ArC) (Bejan, 1985; Beghein, 1992; Collignan, 2002), which are defined as
1 2 I .( ) Re Q S ν − = (2)
where SI and ν are, respectively, thenatural air inlet area (m2) and the kinematic viscosity (m2/s).
T room inlet I T 2 I Ar ( / ) g T T S Q S β ⋅ ⋅ − ⋅ = (3) C I C 2 I Ar ( / ) q g S Q Q S β ⋅ ⋅ ⋅ = (4)
where Troom and Tinlet are, respectively, the averaged temperature of the room and the air inlet
temperature. βT and βC are, respectively, the thermal expansion coefficient (K–1) and the solutal expansion coefficient (m3/µg). g is the gravitational constant (m/s–2). The outdoor VOC tracer
concentration is small enough to be neglected in the last expression.
Table 1 Characteristics of the configurations of ventilations tested
Q (m3/h) a.c.h. q (µg/s) Tinlet (°C) Troom (°C) ArT ArC Re
32.5 1 1.15 25.6 28.5 0.02 1.8 × 10⁻⁸ 51.7
18.2 0.56 0.2 18.6 20.6 0.06 1.6 × 10⁻⁸ 28.9
Thermal Archimede values are small enough to assume the flow to be pseudo-isotherm. The value of solutal Archimede number enables to assume VOC tracer as a passive gaz which means that its transport does not affect the airflow field (Collignan, 2002).
CFD Calculations
Numerical calculations are carried out with CFD code (Fluent 6.0) and based on the ‘Finite Volume Method’. The flow is considered as three-dimensional, incompressible, turbulent and non-isothermal. The turbulence model used is the k–ε ‘realizable’ model with the near wall two-layer approach (Fluent, 2002; Theodosiu, 2001). The computational domain is divided into 270 570 hexahedral control volumes. Conservation equations of mass, momentum and energy as well as the transport equations of turbulent kinetic energy and dissipation rate are solved. In addition, an equation of species concentration conservation is solved to predict VOC tracer local mass fraction (mi’) distribution. It takes the following form (Theodosiu, 2000; Collignan, 2002):
t t ( ) (()) Sc i i i i i i i i m u m D S x x x ρν ρ ρ ′ ′ ′ ′ ∂ ∂ − ∂ + = ∂ ∂ ∂ (5)
where νt/ Sct is the ratio between turbulent cinematic viscosity and turbulent Schmidt number. Density of the mixture is:
0 ( , i) i i P T m m RT M ρ ′ ′ ′ =
∑
(6)Ventilation 373
Mi′ and mi′ represent, respectively, the molar mass and the mass fraction of the component i′ of
gaseous mixture: air–α-pinene. RESULTS
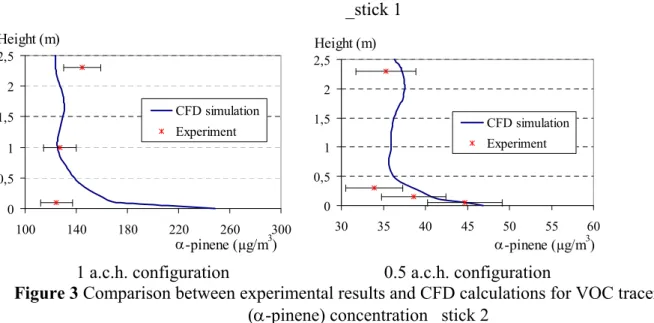
Figures 2 and 3 present comparison between experimental results and CFD calculations for velocity profiles and VΟC tracer concentration profiles, respectively, with airflow rate 1 and 0.5 a.c.h. Height (m) 0 0,5 1 1,5 2 2,5 0 0,1 0,2 0,3 0,4 0,5 0,6 0,7 velocity (m/s) CFD simulation Experiment height (m) 0 0,5 1 1,5 2 2,5 0 0,1 0,2 0,3 0,4 0,5 0,6 0,7 Velocity (m/s) CFD simulation Experiment
1 a.c.h. configuration 0.5 a.c.h. configuration
Figure 2 Comparison between experimental results and CFD calculations for velocity profiles _stick 1 Height (m) 0 0,5 1 1,5 2 2,5 100 140 180 220 260 300 α-pinene (µg/m3) CFD simulation Experiment Height (m) 0 0,5 1 1,5 2 2,5 30 35 40 45 50 55 60 α-pinene (µg/m3 ) CFD simulation Experiment
1 a.c.h. configuration 0.5 a.c.h. configuration
Figure 3 Comparison between experimental results and CFD calculations for VOC tracer (α-pinene) concentration _stick 2
Once this confrontation has been performed, the impact of VOC emissions on indoor air quality has been appreciated numerically. Contaminant removal effectiveness index εCP (Sandberg, 1981) is used to evaluate the ability of ventilation to extract the VOC tracer to the room. This index is defined as follows: P extraction C occupied zone C C ε = (7)
where Coccupied zone and Cextraction are, respectively, the average concentration of VOC tracer in an
occupied zone and concentration at the extraction.
The impact of VOC emissions from pine wood on the indoor air quality could be different for children and adults. Two occupied zones are defined for these two kinds of occupations:
− Occupied zone for child: 0 m < height < 0.5 m; − Occupied zone for adult: 0.5 m < height < 1.8 m.
Table 2 presents the values of contaminant removal effectiveness for these two zones and for the whole domain, for airflow rates 1 and 0.5 a.c.h. Greater is
P C
ε , better is the indoor air quality.
P C
ε equal to 1 corresponds to the perfect mixing distribution of VOC tracer. Table 2 Contaminant removal effectiveness
P C
ε
a.c.h. Child O.Z. Adult O.Z. All the room
1 1.1 1.2 1.2
0.5 1.0 1.1 1.1
DISCUSSION
CFD simulation prediction of velocity is in good agreement with experimental measurements (Figure 2) although the thermal conditions are not controlled in the experimental set-up. However, the experimental measurements are carried out at the beginning of the morning to avoid great variation of temperature. VOC tracer concentration field is also in relatively good agreement with experimental measurements.
In the first configuration (1 a.c.h.), a stratification of VOC tracer concentration is suggested by CFD simulation near the flooring surface. It is not observed with experimental measurement, which could be due to a lack of measurements in this area. In the second configuration (0.5 a.c.h.), the number of measurements has been increased in this area. For this case, the stratification has been observed experimentally and numerically. Thus, the CFD simulation is a good tool to carry out improvements to the experimental protocol.
More generally, a quite homogeneous VOC tracer concentration field is observed in the room for the two configurations except in the air flow supply and near the flooring surface where stratification of VOC tracer occurs.
Numerical analysis of concentration field with the contaminant removal effectiveness shows that the averaged concentration in the domain or in an occupied zone could be about 20% lower than the perfect mixing hypothesis prediction (Table 2).
Due to the position of pine wood on the floor, the impact of VOC tracer emissions on the indoor air quality is 10% more important for the child zone than for the adult zone. Indeed, slow air speeds close to the floor do not carry away VOC tracer in an efficient way towards the extraction. CONCLUSION AND IMPLICATIONS
The impact of VOC emission from a solid flooring material on the indoor air quality of a ventilated room is analysed in this study.
The ventilation rate is controlled with a mechanical extraction. Thermal conditions have not been imposed yet. However, the experimental measurements are carried out at the beginning of the morning to avoid large variation of temperature.
CFD simulation prediction of velocity and VOC tracer concentration fields is generally in quite good agreement with experimental measurements.
A stratification of VOC tracer near the flooring is noted. In the rest of the room, the VOC tracer concentration field is quite homogeneous.
Numerical analysis shows that the averaged concentration in the domain or in an occupied zone could be about 20% lower than the perfect mixing hypothesis prediction. It is also shown that the averaged concentration is 10% more important in a child zone than in an adult zone.
Ventilation 375 This paper shows the interest of CFD simulation to predict indoor air movements and pollutant concentration fields for a ventilated room with real environment.
ACKNOWLEDGEMENT
This study had been undertaken within a Ph.D study framework, supervised by Pr. F. Allard and C. Beghein from the ‘Laboratoire d’Etude des Phénomènes de Transferts appliqués au Bâtiment’ (LEPTAB) of La Rochelle, France.
REFERENCES
Beghein, C. (1992). Contribution à l’étude Numérique de la convection Naturelle Thermosolutale en Cavité. Application à la diffusion de polluants dans les Pièces d’Habitation. PhD Thesis, INSA de Lyon, n° d’ordre 92 ISAL101, p. 11.
Bejan, A. (1985). Mass and heat transfer by natural convection in a vertical cavity. International Journal of Heat and Fluid Flow 6, 149–159.
Collignan, B. and Akoua, A.A. (2002). Evaluation of ventilation system efficiency using CFD analysis. Proceedings of the 8th International Conference on Air Distribution in Rooms, Roomvent 2002. pp. 77–80.
DANTEC.5203. Low Velocity Flow Analyser. Publ. N° 5203 E.
ECA/IAQ (1997). European collaborative action—Indoor Air Quality. Report n°18. Evaluation of VOC Emissions from Building Products_Solid flooring Materials, p. 89.
Fluent (2002). Fluent 6 User’s Guide.
ISO (2002). Draft International Standard ISO/DIS 16000-6.2, 2002, Indoor Air—Part 6:
Determination of volatile organic compounds in indoor and chamber air by active sampling on TENAX TA sorbent, thermal desorption and gas chromatography using MSD/FID.
Nicolas, M., Ramalho, O. and Maupetit, F. (2003). Impact of ozone on indoor air quality: a preliminary field study. Healthy Buildings Conference 2003, Sigapore (in press).
Riberon, J. and O’Kelly, P. (2002). MARIA: an experimental tool at the service of indoor air quality in housing sector. Proceedings of Indoor Air 2002, pp. 191–195.
Sandberg, M. (1981). What is ventilation efficiency? Building and Environment 16 (2), 123–135.
Theodosiu, C. (2001). Modélisation des Systèmes Techniques dans le Domaine des Equipements des Bâtiments à l’aide des Codes de type CFD. PhD Thesis, INSA de Lyon, p. 161.
Theodosiu, C., Laporthe, S., Rusouaen, G. and Virgone, J. (2000). Experimental and numerical prediction of indoor air quality. Proceedings of the 7th International Conference on Air Distribution in Rooms, Roomvent 2000, pp. 95–100.