HAL Id: hal-01441876
https://hal.archives-ouvertes.fr/hal-01441876
Submitted on 20 Jan 2017
HAL is a multi-disciplinary open access
archive for the deposit and dissemination of
sci-entific research documents, whether they are
pub-lished or not. The documents may come from
teaching and research institutions in France or
abroad, or from public or private research centers.
L’archive ouverte pluridisciplinaire HAL, est
destinée au dépôt et à la diffusion de documents
scientifiques de niveau recherche, publiés ou non,
émanant des établissements d’enseignement et de
recherche français ou étrangers, des laboratoires
publics ou privés.
Fabrication and characterization of gas detection
microfluidic system
V Martini, S Bernardini, Marc Bendahan, Khalifa Aguir, P Perrier, I Graur
To cite this version:
V Martini, S Bernardini, Marc Bendahan, Khalifa Aguir, P Perrier, et al.. Fabrication and
character-ization of gas detection microfluidic system. Procedia Engineering, Elsevier, 2010, Eurosensor XXIV
Conference, 5, pp.1188-1191. �10.1016/j.proeng.2010.09.324�. �hal-01441876�
Procedia Engineering 00 (2009) 000–000
www.elsevier.com/locate/procedia
Proc. Eurosensors XXIV, September 5-8, 2010, Linz, Austria
Fabrication and Characterization of Gas detection Microfluidic
System
V. Martini
a, S. Bernardini
a*, M. Bendahan
a, K. Aguir
a,, P. Perrier
b, I. Graur
b.
a
Aix-Marseille Université, IM2NP-UMR CNRS 6242, Faculté de St Jérôme,service 152, 13397 cedex 20, Marseille, France b
Aix-Marseille Université, IUSTI-UMR CNRS 6595, Polytech, 5 rue Enrico Fermi, 13453 cedex 13, Marseille, France
Abstract
In this study a gas detection microfluidic system was realized. Firstly, microfluidic and thermal simulations were done to determine the microsystem dimensions. Heat distribution was then simulated. These results allowed us the best material choices suited for the application. The microsystem has been realized with conventional microelectronic processes and was characterized to evaluate the heater thermal stability and the temperature gradient inside the microsystem. Finally, the gas sensor is exposed to ammonia concentrations between 10 and 100 ppm at 473 K.
© 2009 Published by Elsevier Ltd.
keywords: microsystem, microfluidic, gas detection, thermal creep, ammonia, thin film metal oxide WO3
* Corresponding author. Tel.: +33 (0)4 91 28 91 55 ; fax: +33 (0)4 91 28 89 70.
E-mail address: [email protected]
c
2010 Published by Elsevier Ltd.
www.elsevier.com/locate/procedia
1877-7058 c 2010 Published by Elsevier Ltd.
doi:10.1016/j.proeng.2010.09.324
Open access under CC BY-NC-ND license.
2 Virginie Martini/ Procedia Engineering 00 (2010) 000–000 1. Introduction
Gas microsensor stability, such as selectivity and sensitivity, is one of the most studied properties [1, 2]. In fact, the gas sensor performances were monitored by these points. The pollutant analyses happen generally in a real atmosphere where it is often difficult to keep constant ambient gas parameters, such as temperature, volume and flow rate. But, these parameters must be controlled to obtain a reproducible analysis in different environmental conditions [3]. The sensor containment into microchannel allows us to improve the microsensor properties. The sensor heating needed for its performance may be used for the gas pumping inside microchannel.
The present study aims to fixe these parameters with a minimal space and energy. The microsystem design was studied to determine the better dimensions. Then the thermal repartition was simulated and measured after the microsystem fabrication. Detection tests were also performed to evaluate the detection performances of the gas microsensor used into the microsystem. Moreover, our microsystem may be use for several applications which demand a stable flow and a low electric consumption.
2. Microsystem design
In order to obtain the sensor function stability, a gas microsensor based WO3 and its heater were inserted at an
open end of the microchannel. The microsensor heating is needed to the gas detection since the sensitive layer is a metal oxide [4]. The thermal gradient along the microchannel created by this heating is used also for the gas transport inside the channel. The gas motion due to the thermal gradient is called thermal creep phenomenon. To study the thermal pumping behaviour (thermal creep) several simulations were realised. The simulations will allow us to choose the microsystem dimensions and the nature of the materials used. In fact these materials affect the temperature gradient along the microchannel which is very important for the thermal pumping generation.
1 cm 1 cm
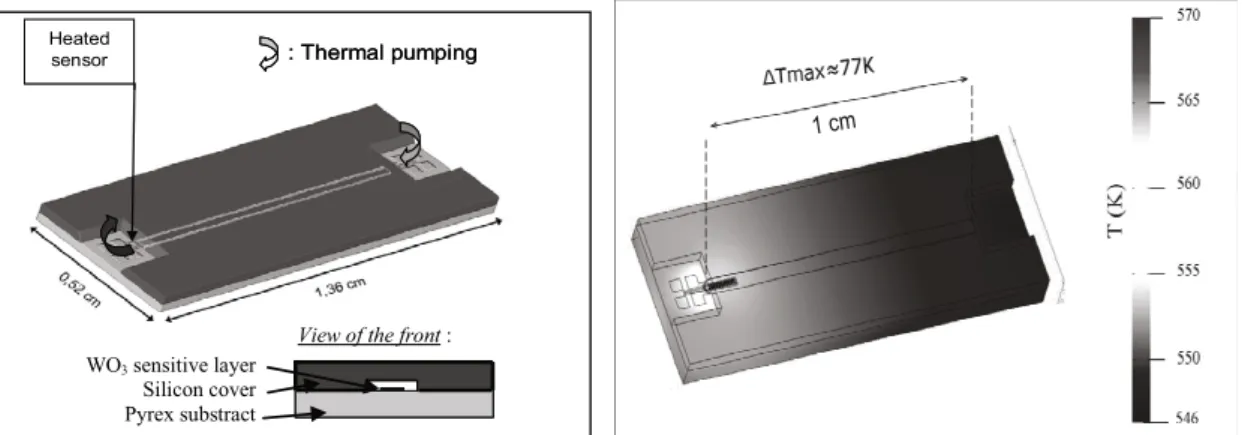
Fig. 1: (a) Microfluidic device design; (b) Thermal simulation of heat gradient in the microsystem for heater at 623 K: representation of heat range between 546 K and 570 K.
The thermal creep phenomenon was discovered by O. Reynolds in 1879. When two vessels, maintained by the equal pressures and different temperatures, are connected by a small channel, the gas inside this channel starts to creep from the cold side to the hot one (Fig. 1a). This effect becomes more important when the ratio between the molecular mean free path and the characteristic flow dimension increases. This non-dimensional ratio is called Knudsen number:
L Ȝ
Kn= , (1)
where Ȝ is the molecular mean free path and L is the characteristic flow dimension.
When we analyze the flow in the microchannel, the smallest of the three dimensions, the channel height H is chosen as a characteristic one. The mean free path of the molecule depends on the gas nature (via molecular mass), gas pressure, temperature and viscosity. We suppose that the sensor will work under atmospheric conditions, so for air (20 % O2 and 80 % N2) at room temperature the mean free path is of order of 10-7 – 10-8 m. If the channel height is
chosen equal to 10 μm, the Knudsen number will be of order of 10-3 – 10-2 [5]. This Knudsen number corresponds to
the slip flow regime and the thermal creep phenomenon becomes apparent.
View of the front side : : Thermal pumping Heated sensor View of the front side : : Thermal pumping Heated sensor WO3 sensitive layer Silicon cover Pyrex substract
View of the front :
The numerical simulations of the thermal creep flow was carried out in the slip regime basing on the Navier-Stokes equation [6] and over all flow regimes basing on the model kinetic equation in [7].
The microchannel width was determined to be equal to 500 μm to insert the microsensors inside the microchannel extremity. The length choice was relied to the temperature gradient desired value and the flow rate estimation. From this analysis and the numerical simulation results, we can estimate the mass flow rate of the thermal gradient driven flow through the rectangular channel of 10 μm height, of 500 μm width and of 1cm length as 3 10-12kg.s-1.
The dimensions were chosen to the microsystem fabrication but the temperature gradient is also an indispensable condition to the thermal pumping generation. To determine its profile, it had been thermally simulated using Comsol Multiphysics software to define the material best choices. They affect the heat distribution in the microsystem and particularly into the microchannel where the thermal creep phenomenon must be created.
Two materials were tested. The silicon which is well known in microelectronic technology and easily etched, and the Pyrex. Simulations results showed better Pyrex properties compared to silicon ones. Pyrex is the most advantageous material for the support fabrication due to its low thermal conductivity. However, the silicon was chosen for the microchannel fabrication because it can be more easily etched. Simulations indicated that a temperature gradient of 77 K can be created by fixing the heater at 623 K (Fig. 1b). This value is sufficient to create a pumping generation.
3. Microsystem realization and heater calibration
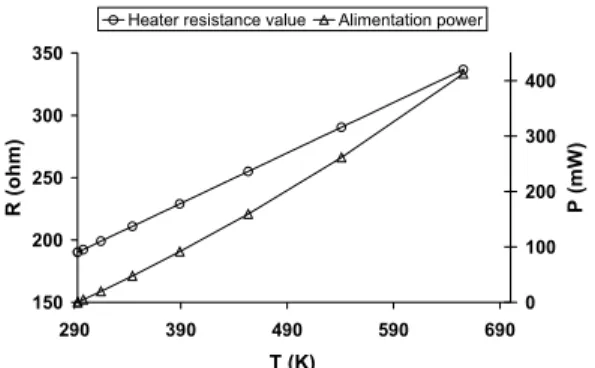
After these theoretical studies, the microsystem was fabricated using standard microelectronic technologies (Fig. 2). Then, heater sensor was calibrated in a thermostated chamber. The resistance value evolution is linear (Fig. 3). Thanks to this calibration curve where the temperature values obtained during the heating can be known from the resistance measurements.
0, 52 c m 150 200 250 300 350 290 390 490 590 690 T (K) R (ohm ) 0 100 200 300 400 P (mW)
Heater resistance value Alimentation power
Fig. 2: Final microsystem device Fig. 3: Micro heater calibration
4. Temperature gradient measurement
To valid our thermal simulation results show on Fig. 1b, temperature measurements were done on both two microchannel extremities. The first platinum resistance was powered and the opposed resistance was used like a temperature probe. The resistance variations in function of the power were noted. The differences between the resistance values of the two platinum resistances demonstrated a temperature gradient along the microsystem. To confirm and precise these results, temperature measurements along the microchannel with an Infrared camera were done. Infra Red results gave a temperature profile which is in good agreement with the profile found from the thermal simulations.
5. Microsystem response in presence of ammonia gas
Measurement and control systems for pollutant and toxic gas emissions gain increasing importance for a sustainable and ecologically responsible development. We have chosen ammonia (NH3) gas detection, because it is
one of the most important industrial chemicals, used as precursor of various nitrogen compounds (including fertilizers) and as refrigerant gas. As a consequence of its large toxicity, the acceptable ammonia concentration at the working place is 25 ppm for 8 hours exposure. A relevant ammonia chemical gas sensor must therefore detect ammonia concentrations below these thresholds. Gas detection was study first with the gas sensor alone, i.e. without
4 Virginie Martini/ Procedia Engineering 00 (2010) 000–000
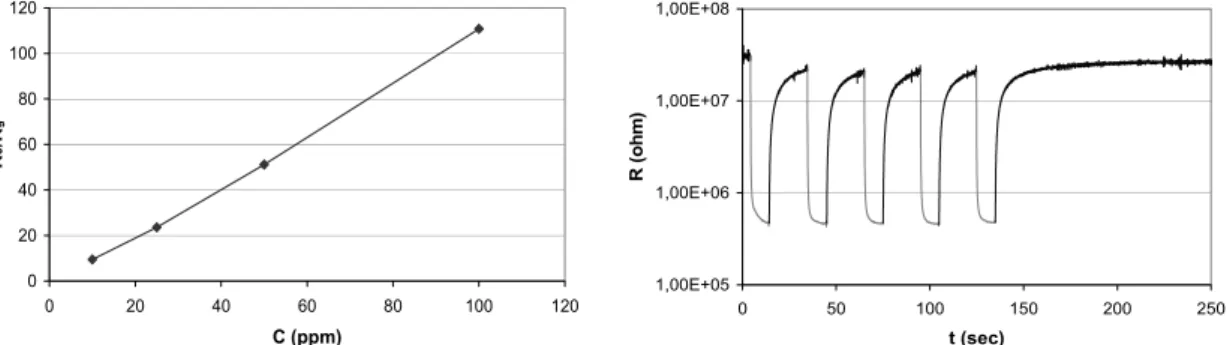
closing the microchannel. Working temperature was determined to obtain a good sensitivity and fast response. The gas sensor response presents an optimum detection temperature at 473 K. The microsystem is exposed to ammonia concentrations between 10 and 100 ppm. Figure 4a represents the normalized sensor response at different ammonia concentrations. The normalized response R0/Rg is defined as the sensor resistance ratio at various ammonia
concentrations (Rg) to that in synthetic air (R0). The sensor response even at the lowest concentration of 25 ppm
ammonia is well pronounced [1, 2]. NH3 detection below this threshold corresponds to the maximum level
authorized at the working place and a valuable ammonia sensor must clearly detect partial pressures significantly below that point. We observe on Fig. 4b a sensor resistance decrease in presence of ammonia. The changes upon gas exposure are reversible and reproducible to the ammonia concentration.
0 20 40 60 80 100 120 0 20 40 60 80 100 120 C (ppm) R 0 /R g 1,00E+05 1,00E+06 1,00E+07 1,00E+08 0 50 100 150 200 250 t (sec) R ( o hm)
Fig. 4: Gas detection without closing the microchannel: (a) Normalized response sensor with different NH3 concentrations: 10, 25, 50 and 100 ppm.; (b) Sensor response reproducibility to 50 ppm of ammonia at 473K.
6. Conclusion
The microfluidic and thermal studies allowed us to choose dimensions and materials for the microsystem fabrication. The heater calibration showed thermal stability. The thermal measurements confirmed the temperature gradient existence and therefore the thermal creep phenomenon. The gas detection tests indicated that the gas microsensor presents an important normalized response for the ammoniac detection and also a good reproducibility. Next studies will be dedicated to signal detection for lower gas concentrations and thermal pumping will be analyzed through microfluidic and gas detection.
Acknowledgements
The authors gratefully acknowledge this work for financial support in their research by the funding from “Region PACA - BDE n°648” and “Seres Environnement” company and from European Community's Seventh Framework Program (ITN - FP7/2007-2013) under grant agreement n° 215504
References
[1] V. Srivastava and K. Jain, Highly sensitive NH3 sensor using Pt catalyzed silica coating over WO3 thick films, Sensors and Actuators B, 133 (2008), p. 46-52.
[2] M. Stankova, X. Vilanova, J. Calderer, E. Llobet, J. Brezmes, I. Gràcia, C. Cané and X. Correig, Sensitivity and selectivity improvement of rf sputtered WO3 microhotplate gas sensors, Sensors and Actuators B, 113 (2006), p. 241-248.
[3] S-I. Ohira and K. Toda, Micro gas analyzers for environmental and medical applications, Analytica Chimica Acta, 619 (2008), p. 143-156. [4] M. Bendahan, R. Boulmani, J.L. Seguin and K. Aguir, Characterization of ozone sensors based on WO3 reactively sputtered films : influence
of O2 concentration in the sputtering gas, and working temperature, Sensors & Actuators, B 100 (2004), p. 320-324. [5] G.A. Bird, Molecular Gas Dynamics and the Direct Simulation of Gas Flows, Oxford Science Publications, (1994).
[6] J.G. Méolans and I.A. Graur, Thermal creep continuum modelling, European Journal of Mechanics B/Fluids, 27 (2008), p. 785-809. [7] I.A. Graur and F. Sharipov, Non-isothermal flow of rarefied gas through a long pipe with elliptic cross section, Journal of MicroFluidics and
NanoFluidics, 6(2) (2009), p. 267-275.