Université de Montréal
Differential effect of deletions and duplications on general intelligence and social responsiveness
Par
Petra Tamer
Département de neurosciences Faculté de médecine
Mémoire présenté en vue de l’obtention du grade de Maîtrise ès Sciences (Msc.) en neurosciences
Novembre 2019
Université de Montréal
Unité académique : département de neurosciences, Faculté de médecine
Ce mémoire intitulé:
Differential effect of deletions and duplications on general intelligence and social responsiveness
Présenté par Petra Tamer
A été évalué par un jury composé des personnes suivantes Alexis Beauchamp-Châtel Président-rapporteur Sébastien Jacquemont Directeur de recherche Sherif Karama Membre du jury
i RÉSUMÉ
Les délétions et les duplications délétères (Variations de nombre de copies, CNV) sont identifiés dans environ 11% des individus référés dans des cliniques du neurodéveloppement pédiatrique. Certains CNVs récurrents ont été formellement associés avec des troubles du neurodéveloppement, mais la majorité des CNVs sont non-récurrents et donc trop rares pour être évalués par des études d’association. Dans cette optique, nous avons récemment développé une nouvelle approche pour estimer l’effet des CNVs non-documentés sur le quotient intellectuel non-verbal (QINV) et nous visons étendre cette approche pour l’appliquer sur une mesure de traits autistiques.
Nous avons identifié les CNVs dans deux cohortes d’autisme du Simons Simplex Collection (SSC) et du MSSNG, dans leurs apparentés de premier-degré, dans une cohorte du neurodéveloppement et dans une population générale. Des modèles statistiques intégrant les scores des gènes inclus dans les CNVs ont été utilisés pour expliquer leur effet sur l’intelligence générale et sur la réciprocité sociale.
Les délétions et les duplications diminuent le QINV et l’effet des duplications est 3 fois inférieur à celui des délétions. L’effet différentiel est aussi observé pour la réciprocité sociale avec un ratio d’altération de 2:1 pour les délétions et les duplications et cet effet est principalement expliqué par le QINV. Les estimés de notre modèle pour l’intelligence générale et la réciprocité sociale concordent bien avec des observations déjà publiés.
Nos modèles entraînés sur des CNVs couvrant >4,500 gènes suggèrent que l’effet des CNVs sur la cognition et la réciprocité sociale est dû à leurs propriétés polygéniques. Ces modèles pourront aider dans l’interprétation des CNVs en clinique.
Mots-clés : Variations de nombre de copies, autisme, intelligence générale, QI, réciprocité sociale, SRS, modèle statistique, score génétique.
ii ABSTRACT
Deleterious deletions and duplications (copy number variations, CNVs) are identified in up to 11% of individuals referred to neurodevelopmental pediatric clinics. However, only few recurrent CNVs have been formally associated with neurodevelopmental disorders because the majority are too rare to perform individual association studies. We recently developed a new framework to estimate the effect size of undocumented CNVs on non-verbal intelligence quotient (NVIQ) and sought to extend this approach to another score measuring autistic traits. We identified CNVs in an autism sample from the Simons Simplex Collection (SSC) and MSSNG, in their first-degree relatives, in a neurodevelopmental cohort and in individuals from an unselected population. Statistical models integrating scores of the genes encompassed in the CNVs were used to explain their effect on general intelligence and on social responsiveness. Deletions and duplications decreased NVIQ and the effect of duplications was three-fold smaller than deletions. There was also a differential effect on social responsiveness: the ratio of the impairment conferred by deletions and duplications was 2:1 and this effect was mainly driven by NVIQ. Models estimates for general intelligence and social responsiveness were consistent with previously published observations.
Our models, trained on CNVs encompassing >4,500 genes, suggest highly polygenic properties of CNVs with respect to cognition and social responsiveness. These models will help interpreting CNVs identified in the clinic.
Keywords: Copy-number variants, autism, general intelligence, IQ, Social responsiveness, SRS, statistical models, genetic scores.
iii TABLE OF CONTENT RÉSUMÉ ... i ABSTRACT ... ii LIST OF TABLES ... v LIST OF FIGURES ... vi
LIST OF ABBREVIATIONS ... vii
DEDICATION ... ix
ACKNOWLEDGMENTS ...x
INTRODUCTION ... 1
Phenotypical heterogeneity of autism: ... 3
Specifiers of autism ... 3
Psychiatric comorbidities ... 4
Medical comorbidities ... 5
Genetic heterogeneity of autism ... 6
Copy-number variations ... 7
Single nucleotide variations ... 10
Prediction models ... 11
METHODOLOGY... 16
Cohorts ... 16
Autism cohorts ... 16
Neurodevelopment cohort of Sainte-Justine ... 16
Unselected cohort... 16
Genetic data - CNV detection, annotation and filtering ... 16
Genotyping and whole genome sequencing ... 16
CNV Calling ... 17
Filtering of microarrays ... 18
CNV coordinates ... 18
Concatenation of CNVs ... 18
CNV filtering ... 18
iv
Genetic analysis of pairwise relatedness and population stratification ... 19
Clinical assessments ... 21
NVIQ ... 21
Social Responsiveness Scale (SRS) ... 22
Statistical analyses ... 22
Effect of gene dosage on general intelligence in the neurodevelopment cohort of St-Justine ... 22
Correlation and concordance analysis of the meta-analysis model in the neurodevelopment cohort of St-Justine ... 23
Effect of gene dosage on social responsiveness ... 23
RESULTS ... 27
Effect of gene dosage on general intelligence in the neurodevelopment cohort of St-Justine ... 27
Correlation and concordance analysis of the meta-analysis model in the neurodevelopment cohort of St-Justine ... 28
Effect of gene dosage on social responsiveness ... 29
SRS raw score in the autism cohorts and the unselected population ... 29
SRS raw score in the neurodevelopment cohort of St-Justine ... 32
SRS categories in the autism cohorts and the unselected population ... 33
DISCUSSION ... 37
Effect of gene dosage on general intelligence ... 37
Effect of gene dosage on social responsiveness ... 38
Conclusion ... 39
v LIST OF TABLES
Table 1: Recurrent CNVs formally associated to ASD ... 9
Table 2: NVIQ available from the different cohorts ... 21
Table 3: Effect of gene dosage measured by pLI on NVIQ z-score in the neurodevelopment cohort of Saint-Justine ... 27 Table 4: Concordance and correlation between the loss of NVIQ estimated by the model and the real loss compared to parents ... 29 Table 5: Effect of gene dosage measured by pLI on SRS raw score in two autism cohorts and one unselected population ... 30 Table 6: Effect of gene dosage and NVIQ on SRS raw score in the neurodevelopment cohort of St-Justine ... 32 Table 7: Effect of gene dosage measured by pLI on SRS categories ... 34
vi LIST OF FIGURES
Figure 1: Representation of the phenotypical heterogeneity of ASD based on DSM-5 criteria for ASD ... 2 Figure 2: Prevalence of ASD reported by the Center for Disease Control and Prevention since 1975 (4) ... 2 Figure 3: Representation of the phenotypical heterogeneity of ASD based on DSM-5 criteria for ASD ... 4 Figure 4: The history of the genetics of autism from 1975 to 2015 ... 9 Figure 5:Concordance between loss of PIQ estimated by the first model (y-axis) and loss of PIQ measured by previously published studies (x-axis) for 15 recurrent CNVs ... 13 Figure 6: Methodological pipeline. ... 20 Figure 7: Effect of gene dosage on general intelligence in the neurodevelopment cohort of St-Justine ... 28 Figure 8: Effect of gene dosage on SRS raw score in the autism and unselected cohorts ... 31 Figure 9: Effect of gene dosage on SRS raw score in the neurodevelopment cohort of St-Justine ... 33 Figure 10: Effect of gene dosage on T-score of SRS in the pooled autism and general populations ... 35
vii LIST OF ABBREVIATIONS
ADDM: Autism and Developmental Disabilities Monitoring ADHD: Attention-deficit/hyperactivity disorder
ASD: Autism Spectrum Disorder BRCA1: Breast cancer 1
CGH: Comparative genomic hybridization CHRNA7: Cholinergic receptor nicotinic alpha 7 CI: Confidence interval
CNV: Copy number variants DAS: Differential ability scales
DSM-IV-TR: Diagnostic and Statistical manual of Mental Disorders - 4th version DSM-5: Diagnostic and Statistical manual of Mental Disorders - 5th version FISH: Fluorescent in situ hybridization
ICC: Intraclass correlation coefficient ID: Intellectual disability
IQ: Intelligence quotient Kb: Kilobase
LEITER-R: Leiter International Performance Scale – Revised MAF: minor allele frequency
MAPK3: Mitogen-activated protein kinase 3 Mb: Megabase
MSEL: Mullen Scales of Early Learning NLGN: Neuroligins
NDD : Neurodevelopmental disorder NRXN: Neurexin
NVIQ: Non-verbal intelligence quotient OR: Odds ratio
viii pLI: probability of loss-of-function intolerance
pLI DEL/DUP: Sum of pLI scores by individuals for deletions or for duplications RhoA: Ras homolog family member A
SD: Standard deviation
SHANK: SH3 and multiple ankyrin repeat domains SNP: Single nucleotide polymorphism
SNV: Single nucleotide variant SRS: Social Responsiveness Scale SSC: Simons Simplex Collection TAOK2: TAO kinase 2
WASI: Wechsler Abbreviated Scale of Intelligence WISC: Wechsler Intelligence Scale for Children
ix DEDICATION
x ACKNOWLEDGMENTS
I would like to give my most sincere thanks
To Dr. Jacquemont for giving me the opportunity to do my master’s in his multidisciplinary laboratory and for his continuous support. His dedication to research is definitely inspiring.
To all the students and employees in the laboratory. Every single person in the laboratory has somehow contributed to my progress and helped me through the process especially Miss Elise Douard, a PhD candidate, who supervised me since I started as a research intern. She invested a lot of her time and effort in training me. She was always there when I needed help and always answered my questions.
To Dr. Huguet, Dr. Schramm and Dr. Absa for their supervision and their availability.
To the research assistants Dr. Martin and Miss Nadine Younis who were managing the cohort of St-Justine and to all the students of the laboratory of Dr. Sarah Lippé who guided me during the neuropsychological assessments.
I would like to extend my acknowledgement,
To the Canadian Institutes of Health Research (CIHR) and to the department of neurosciences for the scholarships that supported me financially.
1 INTRODUCTION
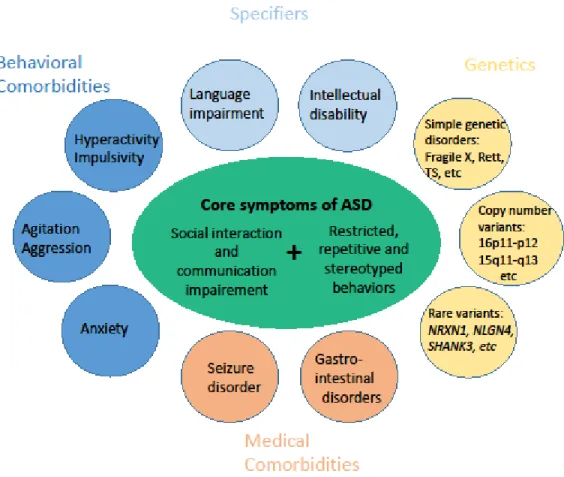
Autism spectrum disorder (ASD) is one of the many neurodevelopmental disorders described in the Diagnostic and Statistical manual of Mental Disorders (5th version) (DSM-5) (1). Constant changes and refinements have been made to the diagnosis of autism since the documented observations of Kanner in 1943 up until the publication of the DSM-5 in 2013 (1,2). This disorder is now widely accepted as complex, pervasive, heterogeneous with multiple aetiologies, sub-types and developmental trajectories (3). Nowadays, the diagnosis is based on the observation of the two domains of core symptoms: Deficits in social communication and interaction and stereotyped, restricted and repetitive behaviors or interests (1) (Figure 1). The prevalence of this disorder is in constant increase (Figure 2, Figure 4). According to a surveillance study done by the Autism and Developmental Disabilities Monitoring network (ADDM) in 2014 among children aged 8 years in 11 sites in the United States, the estimated prevalence of autism is 16.8 per 1000 (one in 59) (4). This prevalence is higher than previously reported estimates from the ADDM network and this is not solely due to the extension of the diagnostic criteria by the DSM-5 since there is an 86% overlap between the DSM-IV-TR (2002) and DSM-5 (2013) case counts (1,4,5).
The causes and mechanisms underlying ASD are still not fully known but several epidemiological studies have firmly established a genetic component underlying ASD with a heritability ranging from 50-90% (6–8) as well as a complex interaction between genetic and environmental factors (9,10). Furthermore the implementation of advanced technology for chromosomal microarray-based analysis in clinic has rapidly expanded the number of genes associated with ASD (e.g. SFARI genes) through the identification of deleterious Copy-Number Variants (CNVs) (11,12) (Figure 4). The unveiling of the genetic contribution to ASD could be an approach that would ultimately lead to developing specific molecular diagnostics and targeted therapeutics.
2
Figure 1: Representation of the phenotypical heterogeneity of ASD based on DSM-5 criteria for ASD.The core symptoms of ASD are represented in the center and represent the common features required to receive a diagnosis. Comorbidities spanning behavior, cognition and genetic disorders are represented around the periphery of the figure. Adapted from Veenstra-VanderWeele & Blakely (2012) (13).
Figure 2: Prevalence of ASD reported by the Center for Disease Control and Prevention since 1975 (4).
3 Phenotypical heterogeneity of autism:
The heterogeneity of the clinical presentation is a hallmark of autism (3). Different specifiers and many psychiatric and medical comorbidities are associated with this disorder.
Specifiers of autism
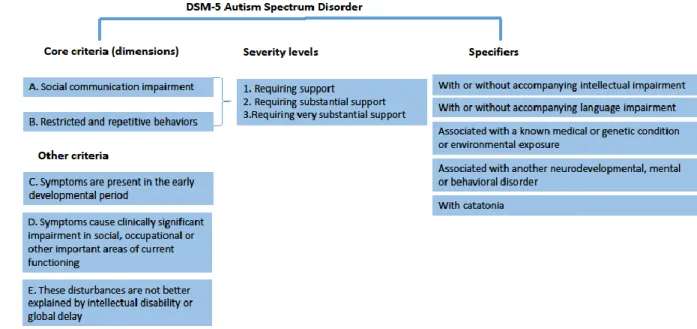
The DSM-5 focuses on a dimensional assessment to examine the core and associated features of ASD which led to the inclusion of “specifiers”. The specifiers are dimensions provided to describe the heterogeneity of the presentation of ASD and they indicate the presence of intellectual and/or language impairment as well as the severity level of the core ASD symptoms (14). Intellectual disability (ID) is a developmental disorder characterized by intellectual and adaptive functioning deficits (1). Studies published so far have reported highly variable rates of ID prevalence in ASD, ranging from 16.7% to 84% (15,16). However, some individuals with autism have above-average intelligence quotient (IQ) and high levels of academic and occupational functioning (17). Language impairment is also specifier of ASD with up to 76% of occurrence in children with autism (18–20). Thus, some children with ASD fail to acquire spoken language skills beyond a basic or minimal level, which may range from no spoken words to fewer than 20–30 words (21,22); about 30% of children with autism fall into this group (23). Within the group of children who are verbal, some have a notable language deficit, including difficulties with the understanding and use of grammar (24,25). Furthermore, the specifiers of autism include the recording of any known genetic or medical disorder and other co-occurring neurodevelopmental, mental, or behavioral disorder (Figure 3).
4
Figure 3: Representation of the phenotypical heterogeneity of ASD based on DSM-5 criteria for ASD. Adapted from Ousley& Cermak (2013) (26).
Psychiatric comorbidities
Neurodevelopmental and psychiatric comorbidities occur in up to 70% of children with autism and the most common are social anxiety disorder, oppositional defiant disorder and attention-deficit/hyperactivity disorder (ADHD) (27). The social anxiety disorder, also known as social phobia, occurs during specific social situations and leads to an avoidance reaction and constant fear that substantially affects social life, academic performance and professional success (28). This comorbidity is seen in approximately 29.2% of individuals with autism (29). The oppositional defiant disorder is a behavioral disorder that has a prevalence of 28.1% among autistic individuals (29). This disorder is characterized by uncooperative, defiant, negativistic and irritable behaviors toward parents, peers, teachers and other authority figures and often interferes with learning, school adjustment and with the child’s relationships with others (28). ADHD is outlined by symptoms of inattention, hyperactivity and impulsivity and it frequently co-occurs with ASD (30) with a prevalence ranging from 30% to 80% (31). Symptoms such as poor social skills, emotional dysregulation, and oppositional behavior were found in both diagnoses, but these may be qualitatively distinct.
5 Medical comorbidities
Some medical conditions are more frequently observed in individuals with autism compared to the general population. These conditions include epilepsy, gastrointestinal disorder, immune system abnormalities, sleep disorders and motor disorders (13).
A meta-analysis study shows that the prevalence of epilepsy among autistic individuals is 8% compared to 2-3% in the general population (32). This prevalence is of 21.4% among patients who have simultaneously autism and ID. Epilepsy is also more frequent among autistic children with poor verbal abilities, among those suffering from a neurological impairment such as cerebral palsy and among females (33,34). Individuals who have autism and epilepsy tend to have more severe impairments affecting their adaptive and social functioning domains and their fine and gross motor skills which leads to more challenging behaviors (35,36). This severity can be the result of either the physiological complications caused by the recurrent seizures or the manifestations of the genetic mutation underlying these two disorders. A systematic review reported that the prevalence of gastrointestinal disorders among individuals with autism ranges from 9 to 91% (37). The 11 studies included in this review, except for the study of Black et al. (38), agree on the fact that this prevalence is higher in the autistic population compared to the general population with symptoms including constipation, feeding issues/food selectivity and diarrhea (39). Patients with autism who have gastro-intestinal problems are at a higher risk of anxiety, sensory over-responsivity, irritability, social withdrawal and language regression (40–42).
A case-control study found that autoimmune diseases were diagnosed significantly more often among children with ASD than controls and psoriasis was the most frequently diagnosed autoimmune condition; it occurred over twice as often in cases than in controls (43). A different study reported that allergic manifestations were 5 times as prevalent in children with ASD than in controls (52% vs. 10%) (44). Other studies of biological markers of immune function in individuals with ASD have found neuroinflammation in brain tissues (45,46) and imbalances in cytokine/chemokine levels and other abnormalities (47).
6
Children with ASD are more likely to have sleep problems including dyssomnias and parasomnias (48). Dyssomnias include problems such as sleep onset delay, night awakenings (49), early morning awakening (50) and periodic limb movements (51). Parasomnias consist of problems such as sleep talking, sleep walking, sleep terrors and nightmares (52). These sleep problems intensify the symptoms of autism as some research identified that fewer hours of sleep per night predicted overall autism scores, social skills deficits and stereotypic behaviors (53).
Movement disorders have also been frequently identified in individuals with ASD, with ataxia (54) reported in a number of studies, as well as akinesia, dyskinesia, bradykinesia and catatonic-like symptoms (55) among others, with cerebellum and basal ganglia dysfunction being implicated (56).
Genetic heterogeneity of autism
The genetic architecture of autism is very complex. It involves a lot of variants with numerous characteristics such as size, frequency and inheritance. First, the size depends on the number of nucleotides altered which divides the variants into two classes: single nucleotide variants (SNV) and structural variants including the CNVs (57). Second, the frequency divides the genetic variants into four categories: A very common variant is a variant with the minor allele frequency (MAF) between 5 and 50% , a less common variant has a MAF between 1 and 5%, a rare variant has a MAF of less than 1% but still polymorphic in one or more major human populations, and a private variant is restricted to probands (the individual through whom a family with a genetic disorder is ascertained) and their immediate relatives (58). Third, the patterns of inheritance include autosomal recessive, autosomal dominant and X-linked through which the variant is transmitted from one parent to the descendant, whereas a de novo variant is only seen in the proband (59). These different characteristics determine the severity of the variants which leads to their clinical classification into benign, pathogenic or variant of uncertain significance defined by the American College of Medical Genetics (60).
7 Copy-number variations
In 2004, two landmark studies (61,62) have demonstrated that submicroscopic variations (<500 Kilobases (kb) in size - 1 Kb =1000 base pairs) are widespread in the human genome. These variations are known as CNVs and are defined as a genomic deletion or duplication of over 1000 base pairs. On average, each individual has more than 1000 CNVs in the genome accounting for 4 million base pairs of genomic difference and contributing to 0.1% of the genetic variation at the structural level (63).
Technological and methodological advances in genetics and genomics such as the Fluorescence in situ hybridization (FISH) and comparative genomic hybridization (CGH) have permitted the identification of pathogenic CNVs in 11% of individuals with autism but only 12 recurrent CNVs have been formally associated to ASD (Table 1) (64). Recurrent CNVs share a common size, show clustering of fixed breakpoints, and recur in multiple individuals (65). They are mainly caused by a non-allelic homologous recombination between two low-copy repeats. Low-copy repeats are “hotspots” meaning that they are unstable regions of the genome and are subject to high rates of structural mutation. On the other hand, non-recurrent CNVs have distinct breakpoints and different sizes and consequently are less common. The major mechanism underlying these CNVs is the non-homologous end-joining (65).
16p11.2 deletion
Since the frequency of recurrent CNVs allows the collection of large samples of carriers, many of them have been studied and characterized such as the 16p11.2 deletion.
The 16p11.2 deletion is a recurrent CNV between breakpoints 4 and 5 on the 16th chromosome (29.5–30.1 Megabases - 1 Megabase: 1 million base pairs) that encompasses 29 genes (66). It is associated with a broad range of neurodevelopmental and neuropsychiatric diagnoses including developmental delay, ID and autism (66). The overrepresentation of this deletion has been demonstrated in ASD cohorts with an odds ratio (OR) of 10 (64). This would translate into a risk for ASD of 15% based on the ASD population prevalence of 1.5%.
8
Many studies have attempted to quantify the effect size of this deletion on cognition and other phenotypes notably a study by Moreno-De-Luca et al. conducted on 56 probands with the de novo CNV and their non-carrier parents and siblings (66). When comparing the probands to their family members, they scored 1.7 standard-deviation (SD) lower in cognitive abilities, 2.2 SD in social behavior and 1.3 SD in neuromotor performance. Another study assessing phonology found that probands have a decrease of 2 SD which reflects their language impairments (67). Of note, these phenotypes are not specific to the deletion 16p11.2 but they are observed in other recurrent CNVs such as the duplication 1q21.1 (68).
Several studies have attempted to identify causative driver genes (altered by the CNV) of these above-mentioned neurodevelopmental phenotypes. Manipulations of mouse models found that TAOK2 heterozygous and knockout mice have gene dosage-dependent impairments in cognition, anxiety and social interaction (69). They also have dosage-dependent abnormalities in brain size and neural connectivity in multiple regions, deficits in cortical layering, dendrite and synapse formation, and reduced excitatory neurotransmission (69). The purported mechanism of synaptic development impairment could be that the loss of TAOK2 causes a reduction in the activation of RhoA implicated in the reorganization of the actin cytoskeleton and the regulation of the cell shape, attachment and motility (69,70) .
Other studies suggest that MAPK3 being the most topologically important hub in protein-protein interaction networks could be the driver gene in this CNV (71).
However, studies of individual genes do not always replicate across publications. This suggests that there is not one clear major candidate, but multiple genes within the 16p11.2 are responsible for the observed phenotype by additive effects or interactions (72).
9
Table 1: Recurrent CNVs formally associated to ASD.
Odds ratio in autism [95%CI]
Regions Deletions Duplications
1q21.1 3 [1-9] 5 [3-10] 3q29 19 [5-81] - 5q35 ∞ - 7q11.23 32 [2-517] 32 [10-112] 15q13.3 15 [5-42] - 16p11.2 (proximal) 14 [8-25] 14 [6-19] 17p11.2 - 32 [2-517] 17q12 97 [10-933] - 22q11.2 32 [9-112] -
95% CI: 95% Confidence interval. Table adapted from Sanders et al (2019) (64).
Figure 4: The history of the genetics of autism from 1975 to 2015.
The increase in the identified genes associated with ASD (SFARI) (11) is represented together with the prevalence of ASD reported by the Center for Disease Control and Prevention (4), the different versions of the Diagnostic
Statistical Manual (from DSM II to DSM 5.0) and the advance in genetics technology.From Huguet et al. (2016)
10 Single nucleotide variations
The identification of CNVs through microarrays and the implementation of new technologies such as the whole-exome and the whole-genome sequencing have led to a large and rapidly growing number of genes associated with autism susceptibility. It is now estimated that 400-1000 genes are associated with autism (74). These susceptibility genes contain thousands of variants in particular SNVs which are a substitution of one nucleotide. A SNV mutation can be synonymous or non-synonymous: a synonymous SNV does not alter the protein sequence while a non-synonymous SNV changes the protein either by changing the sequence of amino acids (missense mutation) or by changing an original amino acid to a stop codon which leads the protein coded by the gene to terminate prematurely (nonsense mutation).
Synaptic genes are highly penetrant for autism and this is based on recurrent findings of rare, de novo, damaging variants of these genes in probands (75). Neuroligins (NLGN), neurexin families (NRXN) and SH3 and multiple ankyrin repeat domains (SHANK) harbour some of the most consistently reported genetic abnormalities that are associated with autism (75). NRXNs and NLGNs are trans-synaptic cell-adhesion molecules that mediate essential signalling between presynaptic (NRXN) and postsynaptic (NLGN) specializations (76). Seven point mutations (including SNVs) in NRXN1, five missense mutations in NLGN4 and one missense mutation in NLGN3 were detected in patients with autism (76). In addition to the NRXN–NLGN complex, mutations in the gene encoding SHANK3- a molecular scaffolding protein in the postsynaptic density of excitatory synapses that binds indirectly to NLGNs- may also occur frequently in autism (77). An astounding 18 point mutations (among which 8 non-synonymous mutations) were detected in the SHANK3 gene in patients with autism, in addition to several cases containing CNVs that cover this gene (e.g. 22q deletion syndrome) (75,78,79). Mutations in synaptic genes are not specific to ASD but are also found in other neuropsychiatric disorders, such as schizophrenia (80). Interestingly, neuropsychiatric conditions share common features such as cognitive dysfunction, limited emotional expression and lack of social reciprocity
11
suggesting that synaptic dysfunction is the common pathway of these major, chronic neuropsychiatric illnesses (81).
Although rare de novo mutations in genes expressed in the brain are identified in approximately 5–14% of individuals with idiopathic autism (82,83), they only contribute to autism liability by 2.6% (7). Conversely, common variants which are shared with more than 5% of the human population contribute to this liability by almost 50% (7). This contribution is therefore important, but unfortunately the causative SNVs still remain unknown since they are numerous (>1000) and each is associated with a low risk. So far, the largest genome-wide association studies performed on <5000 families with autism were underpowered to identify a single SNV with genome-wide significance (73). The recruitment of larger cohorts of patients is required to identify these common variants that explain most of the genetic variance in autism.
Overall, the genetic architecture in autism varies substantially from a single penetrant mutation being enough to cause autism (NRXN1, SHANK3…) to an accumulation of over one thousand low-risk alleles (common variants) (3,84).
Prediction models
As mentioned before, CNVs are identified in 11% of autistic individuals but only 12 recurrent CNVs have been formally associated to autism (Table 1) (64) and since the majority of these CNVs are rare or even private, the possibility of studying them through association studies is ruled out. Therefore, their effect on neurodevelopment and cognition is poorly understood. In line with this, the research team of Pr. Jacquemont has recently published a new framework to estimate the effect of CNVs on general intelligence as measured by NVIQ (85) because 1) ID is one of the specifiers of autism and 2) the CNVs associated to autism have an impact on cognition. This framework corresponds to a statistical model trained on two cohorts of the general population where the majority of CNVs are benign. It consists of linear regressions including functional annotations of genes encompassed by the CNVs used to identify features that explain their association with IQ. Among the 10 functional annotation of genes, a stepwise
12
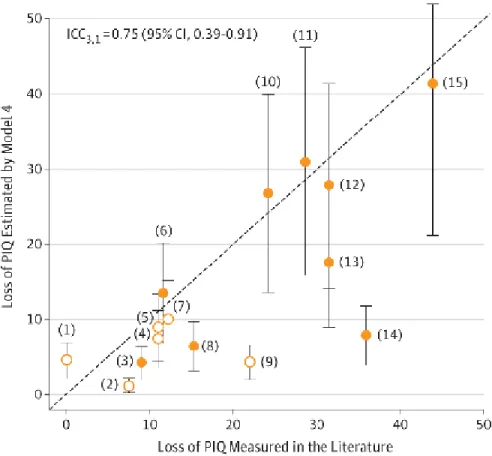
procedure identified that the probability of loss-of-function intolerance score (pLI) (86), which is a haploinsufficiency score, is what best explains the association of any deletion CNV with Non-verbal IQ (NVIQ). This score separates the genes tolerant to a loss-of-function (pLI≤ 0.1) from the genes that are intolerant to a loss-of-function (pLI≥0.9). Note that a pLI≥0.9 points to the genes that would have a significant impact on survival and reproduction (fitness) if altered by a heterozygous loss-of-function. However, not all genes associated with diseases have high scores of pLI (e.g. BRCA1 is associated to breast cancer but does not affect fertility and survival). This model was validated with a concordance analysis using published measures of 15 recurrent pathogenic CNVs. The estimates of the model were 75% (95% CI, 39-91%) concordant with the loss of IQ measured in published case-control studies (Figure 5). This means that the effect of deleterious CNVs can be precisely estimated using a model trained on mostly benign CNVs (with a low pLI score). In addition, the application of this model in autistic cohorts shows similar results to what was found in the general population (Douard et al., manuscript under review).
13
Figure 5: Concordance between loss of PIQ estimated by the first model (y-axis) and loss of PIQ measured by previously published studies (x-axis) for 15 recurrent CNVs. Each point corresponds to a known recurrent CNV: (1) 17p12_(HNPP), (2) 16p12.1, (3) 15q11.2, (4) 16p13.11, (5) 1q21.1 TAR, (6) 17q12, (7) 16p11.2 Distal (SH2B1), (8) 1q21.1 Distal (Class I), (9) 15q13.3 (BP4-BP5), (10) 16p11.2 proximal (BP4-BP5), (11) 22q11.2, (12) 7q11.23 (William-Beuren), (13) 3q29 (DLG1), (14) 8p23.1, and (15) 17p11.2 (Smith-Magenis). The diagonal dashed line represents exact concordance. When loss of IQ was not directly measured in a previous study, we derived the loss of IQ from the published OR measuring the enrichment of a CNV in the neurodevelopmental clinic (open circles). From Huguet et al. (2018) (85).
In the neurodevelopment clinic, CNVs are reported daily but the effect size of 90% of these CNVs on autism risk remains undocumented. And it is still unknown if the enrichment of these CNVs is related to the core symptoms or to the specifiers and comorbidities of autism.
We hypothesize that the effect of CNVs on autism risk and comorbidities follows a general principal and can be estimated using statistical models.
14
The general aim of this study is to quantify the effect of CNVs on general intelligence and on social responsiveness which is a domain impaired in autism.
The specific aims:
1) Replicate the model assessing the effect of CNVs on general intelligence in a cohort of heterogeneous neurodevelopmental disorders.
2) Validate the previous model through correlation and concordance analysis
3) Test the model on a measure associated to a core symptom of autism (social responsiveness) in different cohorts: cohorts of autism, an unselected population and in a cohort of heterogeneous neurodevelopmental disorders.
16 METHODOLOGY
Cohorts Autism cohorts
Two autism cohorts (Figure 6) were used: The Simons Simplex Collection (SSC) (87) , a cohort of 2,569 simplex families, including 2,074 quads (one proband, unaffected parents, one unaffected sibling) and 495 trios (one autistic proband and unaffected parents); and the MSSNG database (88), which was used as an independent replication cohort and includes 845 probands.
Neurodevelopment cohort of Sainte-Justine
This cohort is designed by the project of Brain Canada and it includes 106 families with at least one child carrying a large or a recurrent CNV and diagnosed with a neurodevelopmental disorder (autism, ADHD, ID…). All 282 participants were assessed with an IQ test (Table 2) and have filled the SRS and other questionnaires that are not used in this study (e.g. Children behavioral checklist, Conners Comprehensive Behavior Rating Scale…).
Unselected cohort
One community-based cohort was used: the IMAGEN (89) (Figure 6) which includes 1802 adolescents.
Genetic data - CNV detection, annotation and filtering Genotyping and whole genome sequencing
Genotyping data
CNV detections and standard filtering strategies were previously published (85). CNV calling was performed using the same pipeline for individuals from the SSC (87) and IMAGEN (89) to obtain a harmonized dataset.
In the IMAGEN cohort (89), 2,090 individuals were genotyped using a combination of the Illumina 610Kq (N probes=620,901; N arrays=708) and 660Wq (N probes=657,366; N arrays=1,385). The genotyping was performed at the Centre National de Genotypage (Paris,
17
France). In the SSC (87), 10,032 individuals were genotyped at Yale University using Illumina single nucleotide polymorphism (SNP) genotyping arrays 1Mv1, 1Mv3 Duo, or Omni2.5M.
Whole genome sequencing data
In the MSSNG database (88), 7,231 individuals were sequenced at multiple sites using Illumina sequencing HiSeq, HiSeq 2,500, or HiSeqX.
Next generation sequencing data were analysed using Broad Institute Genome Analysis Toolkit best practices (90).
CGH and FISH data
In the neurodevelopment cohort of Sainte-Justine, the detection of CNVs was done mainly by CGH. In some cases, FISH was done for family members to confirm the inheritance of the CNV carried by the proband (de novo or inherited) or to confirm if a sibling carries the same CNV as the proband. These genetic tests were performed in the laboratory of Pediatric Genetics at CHU Sainte-Justine (Montreal, Canada). The calling and filtering of CNVs were also completed by the same laboratory. All the CNVs of this cohort are variants of uncertain significance or pathogenic.
CNV Calling
CNVs from SSC and IMAGEN were called using PennCNV (91) and QuantiSNP (92) with the following parameters:
- Number of consecutive probes for CNV detection 3 - CNV size 1Kb
- Confidence scores 15.
Then, we merged detected CNVs from both algorithms with CNVision (82).
For MSSNG, read alignment data were used to compute CNV calling following the workflow of Trost et al. (2018) (93).
18 Filtering of microarrays
To ensure good quality of CNVs, we kept only microarrays without too much noise. For IMAGEN:
- Wave Factor < |0.05|
- Standard deviation of the Log-R-Ratio < 0.35 - Standard deviation of the B allele frequency < 0.08 - Call Rate > 0.99
For the SSC cohort: all microarrays detecting 200 CNVs were considered as noisy and were removed from the analysis.
CNV coordinates
The CNVs coordinates were updated from hg18 to hg19 using Illumina information and the liftover tool from the genome browser (https://genome.ucsc.edu/cgi-bin/hgLiftOver and
http://grch37.ensembl.org/Homo_sapiens/Tools/AssemblyConverter). Concatenation of CNVs
In a subsequent step, using an in-house algorithm (Pasteur, Paris, France) (85) followed by visual inspection (SnipPeep, http://snippeep.sourceforge.net), we stitched CNVs that appeared to be incorrectly split by the calling algorithms, and we removed any CNVs (size of 500 Kb and 100 SNPs) that spanned known large assembly gaps (greater than 150 Kb). CNV filtering
CNVs with the following criteria were selected for analysis: - Size ≥ 50 Kb
- Autosomal
- Unambiguous type: deletions or duplications
- Confidence score ≥ 30 with at least one of both detection algorithms
- Cross array criteria: CNVs overlapping 10 probes in each of the array technologies used in the study
19
- Additional filters were applied for CNVs which are not 40% overlapping with recurrent CNVs : overlap with segmental duplicates or centromeric regions < 50%
CNV annotation and scoring:
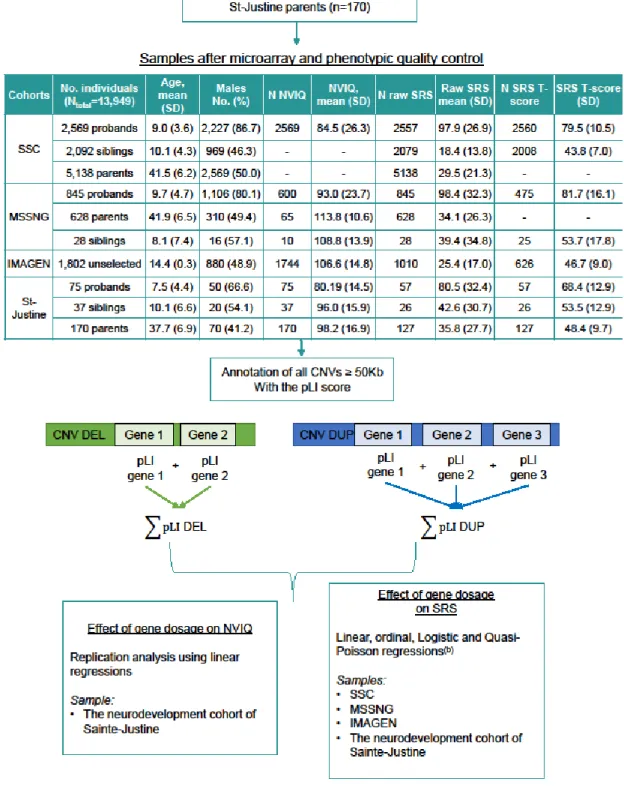
The genetic annotation was based on RefSeq genes (https://genome.ucsc.edu/) using ANNOVAR (94). Each gene was annotated using functional scores such that CNV scores are the sum of scores of genes with all isoforms fully contained in the CNV. If an individual carried more than one CNV, CNV scores for this individual were summed (Figure 6). The default value associated to a gene without available scores was 0. Functional annotations of CNVs were performed using a home-made R package grouping several information about genes included in the CNVs and obtained using RefSeq genes. Genes were annotated using different scores and transformations, but in this study, we were only interested in the pLI because the previous study identified this score as the best variable explaining CNVs effects (85).
Genetic analysis of pairwise relatedness and population stratification
Relatedness was computed using Huguet et al. (2018) methodology (85) in IMAGEN and SSC
cohorts. Ancestry was estimated using Admixture (95)
(http://www.genetics.ucla.edu/software/admixture) with reference populations from HapMap3 (96) allowing for 4 ancestry components (Africa, Asia, Europe and India). Results show a strong European ancestry component in both datasets with 1,630 individuals from IMAGEN and 9,799 individuals from the SSC being estimated to have more than 80% of European ancestry. We then performed a principal components analysis based on the variance-standardized relationship matrix. For the analysis including IMAGEN and SSC, we only used the first three components (C1-C3) as covariates.
20
Figure 6: Methodological pipeline.Microarray quality control and CNV selection and annotation were performed as previously published in Huguet et al. (2018) (85) (Methods); The model used and available data for each phenotype are detailed in the statistical analysis section of the methods. SSC: Simon Simplex Collection; CNV: copy number variants; SD: standard deviation; N.A.: Not applicable; NVIQ: non-verbal intelligence quotient; SRS: Social Responsiveness Scale.
21 Clinical assessments
NVIQ
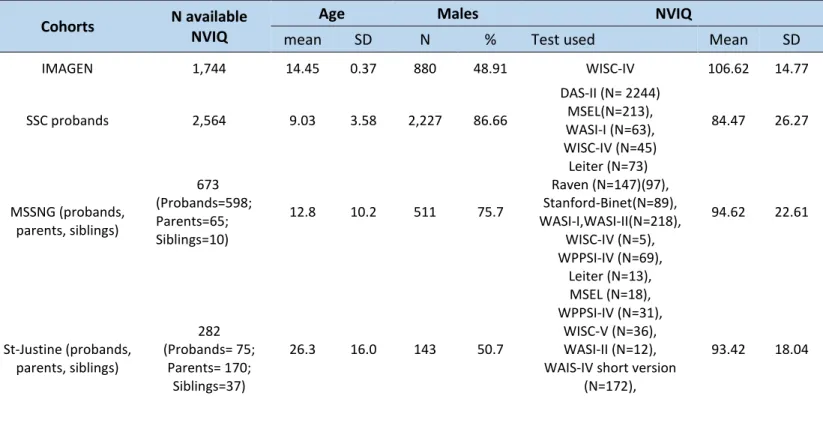
Intellectual abilities were measured using standardized tests according to the cognitive level of the participant (Table 2). We used NVIQ because individuals with autism or neurodevelopmental disorders are either non-verbal or have language impairment and consequently are not able to complete the verbal tasks in the cognitive tests. Then, the NVIQ was z-scored using the mean (mean=100) and the SD (SD=15) of the general population as follows: (NVIQ-100)/15. Norm-referenced standard scores (deviation IQ) were available for most of the participants (85.10%). However, for individuals from SSC who were not able to obtain a deviation IQ due to their age and/or developmental level, ratio IQ were derived by dividing mental age by chronological age and multiplying by 100. This was only done for the kids who underwent the Mullen Scale of Early Learning (MSEL) test. See Bishop et al., (2011) for more details concerning convergence between ratio and deviation IQ (98).
SD: Standard deviation; NVIQ: Non-verbal intelligence quotient; DAS-II: Differential Ability Scales - Second Edition (99); MSEL: Mullen Scale of Early Learning (100); WASI-I or II: Wechsler Abbreviated Scale of Intelligence – First
Cohorts N available
NVIQ
Age Males NVIQ
mean SD N % Test used Mean SD
IMAGEN 1,744 14.45 0.37 880 48.91 WISC-IV 106.62 14.77 SSC probands 2,564 9.03 3.58 2,227 86.66 DAS-II (N= 2244) MSEL(N=213), WASI-I (N=63), WISC-IV (N=45) 84.47 26.27 MSSNG (probands, parents, siblings) 673 (Probands=598; Parents=65; Siblings=10) 12.8 10.2 511 75.7 Leiter (N=73) Raven (N=147)(97), Stanford-Binet(N=89), WASI-I,WASI-II(N=218), WISC-IV (N=5), WPPSI-IV (N=69), 94.62 22.61 St-Justine (probands, parents, siblings) 282 (Probands= 75; Parents= 170; Siblings=37) 26.3 16.0 143 50.7 Leiter (N=13), MSEL (N=18), WPPSI-IV (N=31), WISC-V (N=36), WASI-II (N=12), WAIS-IV short version
(N=172),
93.42 18.04
22
or Second Edition (101,102); WISC-IV: Wechsler Intelligence Scale for Children, Fourth Edition (103); Leiter: Leiter international performance scale – Original and revised (104,105); WPPSI-IV: Wechsler Preschool and Primary Scale of Intelligence – Fourth Edition (106).
Social Responsiveness Scale (SRS)
For all the individuals from the neurodevelopment cohort of Sainte-Justine, SSC, MSSNG and for the unselected population from IMAGEN, severity of social deficits was ascertained with scores from the SRS (107,108). Parents completed the SRS – an extensively validated quantitative measure of characterizing traits and symptoms of autism– about their offspring. Parents also had the questionnaire SRS filled either by a self-report or by a relative or a spouse to evaluate their social responsiveness as well.
The SRS is a 65 items questionnaire rated on a 4-point Likert-type scale and it contains 5 treatment subscales: Social Awareness, Social Cognition, Social Communication, Social Motivation, and Restricted Interests and Repetitive Behavior (109). It generates a total raw score that serves as an index of severity of social deficits in the autism spectrum. Note that this score can be raw (not corrected) or a T-score (corrected for sex and the type of the questionnaire used (preschool-form, school-age form, adult form and adult self-report)). Higher scores on the SRS indicate greater severity of social impairment. In the SSC, probands have a mean of 97.9 (SD=26.9) for the total raw score which is much higher than the means of their parents (mean: 29.5 (SD=21.3)) and their unaffected siblings (mean: 18.4 (SD=13.8)) (Figure 6). Similar observations are seen in MSSNG and in the neurodevelopment cohort of Sainte-Justine (Figure 6). However, in the neurodevelopment cohort of Sainte-Justine, this mean is slightly lower for the probands (mean: 80.5 (SD=32.4)) since they don’t all have a diagnosis of autism (heterogeneous neurodevelopmental disorders) (See distribution of SRS raw score in Figure 8 and Figure 9 and distribution of SRS T-score in Figure 10).
Statistical analyses
Effect of gene dosage on general intelligence in the neurodevelopment cohort of St-Justine The model assessing the effect of CNVs on general intelligence applied in the unselected population sample (85), in ASD cohorts (Douard et al., manuscript under review) and in the
23
meta-analysis of 7 cohorts including unselected and autism populations (Huguet et al., manuscript in preparation) was also replicated in the neurodevelopment cohort of Sainte-Justine. It is a linear mixed-effect model, explaining the z-NVIQ according to total pLI measured for deletions and duplications. These analyses were performed with the function lmekin() from the R package "coxme" (110). The random effect takes into account a kinship matrix generated to model the genetic covariance between related individuals using the kinship() function from the R package "kinship2" (111).
This model could be written as:
NVIQ z-score ~ 𝜶𝑋+ 𝛾𝑍 + β₁ pLI DEL + β₂pLI DUP
where X represents the adjustments covariates (NVIQ test used and sex) and Z is the familial relatedness; pLI DUP/DEL: sum of pLI scores for deletions or for duplications. α, β₁, β2 and 𝛾 are respectively the vectors of coefficients for fixed and random effects.
Correlation and concordance analysis of the meta-analysis model in the neurodevelopment cohort of St-Justine
For this analysis, we calculated the correlation and concordance between the loss of NVIQ predicted by the model of the meta-analysis and the loss of NVIQ calculated by comparison to the biparental mean. This was performed only in the sample of probands of the neurodevelopment cohort of Sainte-Justine after separating them in two groups: probands with an inherited CNV and probands with a de novo CNV. The loss of NVIQ compared to the parents was calculated by subtracting the mean of the NVIQ z-score of the parents from the NVIQ z-score of the proband. The loss of NVIQ estimated by the model is calculated based on the sum of pLI for deletions and duplications of each individual.
Effect of gene dosage on social responsiveness SRS as a continuous variable
We used a linear mixed effect model to quantify the effect of gene dosage measured by pLI scores on the SRS total raw score after pooling SSC, MSSNG and Imagen. A kinship matrix was generated to model the genetic covariance between related individuals using the kinship()
24
function from the R package "kinship2" (111) and this covariance was used as a random effect in the model performed with the function lmekin() from the R package "coxme" (110). This model could be written as:
SRS raw score ~𝜶𝑋+ 𝛾𝑍 + β₁ pLI DEL + β₂ pLI DUP
where X represents the adjustments covariates (age, sex, NVIQ, ASD diagnosis) and Z is the familial relatedness; pLI DUP/DEL: the sum of pLI score for deletions or for duplications. α, β₁, β2 and 𝛾 are respectively the vectors of coefficients for fixed and random effects.
We further explored a potential effect of gene dosage on the SRS within the different groups (probands, unaffected siblings and parents, unselected population) separately using a linear regression (with the function lm ()) and adjusting for the abnormal distributions with a square root transformation of the SRS scores when necessary (Table 5).
Finally, we investigated the effect of gene dosage on SRS in the neurodevelopment cohort of Sainte-Justine. The aim of this analysis was to explore if there is a significant effect of gene dosage on social communication in a cohort with heterogeneous neurodevelopmental disorders and not only autism (Replication analysis). To do so, we used a Quasi-Poisson mixed-effect model fitted with the function glmmPQL() from the R package “MASS” (112).
This model could be written as: Y= Poisson (µ (X, Z), θ)
With log µ (X,Z)= 𝜶𝑋+ 𝛾𝑍 + β₁ pLI DEL + β₂ pLI DU
Where θ: overdispersion parameter P; and X represents thecovariates used in this model (age, sex and NVIQ). α, β₁, β2 and 𝛾 are respectively the vectors of coefficients for fixed and random effects.
SRS as a categorical variable
We also investigated the SRS scores based on the previously published T-score categorization (109) as follow:
25
- T-scores of 76 or higher: Clinically significant deficits in social functioning that interfere with interactions with others;
- 66 <T-scores< 75: Moderate, signaling some clinically significant social deficits; - 60 <T-scores< 65 : Mild to moderate deficits in social behavior;
- T-scores< 59: Indicate an individual probably does not have social difficulties indicative of a possible autism diagnosis.
A logistic regression was applied in this pooled dataset (autistic probands; unaffected siblings and unselected population) to investigate the effect of gene dosage on binary categories of the SRS: clinical (obtained after merging the moderate, mild and clinically significant categories) and normal (Table 7, Figure 10). This logistic regression model took into account the family relatedness as random factor using the MCMCglmm () function from the R package "MCMCglmm" (113).
An ordinal regression model was also performed on SRS coding for 4 different levels of social deficits (normal, moderate, mild and clinically significant) (Table 7, Figure 10). This model was applied using the function MCMCglmm () from the R package "MCMCglmm" (113).
This model could be written as:
LogP (Y>k)/P(Y<=k)) ~ 𝜶k𝑋+ 𝛾k𝑍+ β₁ pLI DEL + β₂ pLI DUP;
Where X represents the adjustment covariates used in this model (age, NVIQ and ASD diagnosis). α, β₁, β2 and 𝛾 are respectively the vectors of coefficients for fixed and random effects.
27 RESULTS
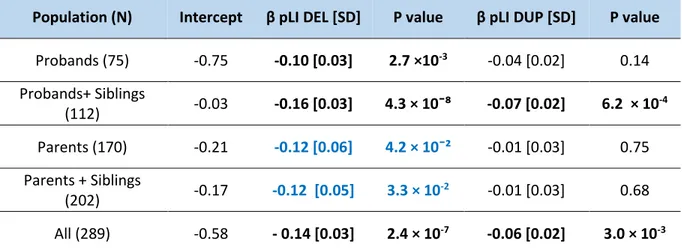
Effect of gene dosage on general intelligence in the neurodevelopment cohort of St-Justine In the neurodevelopment cohort of St-Justine, each point of pLI for deletions decreases z-scored NVIQ by 0.14 points (β=-0.14, SD=0.03, p=2.4×10⁻⁷) (equivalent to 2.09 points of NVIQ). These results are very similar to what has been found in the previous analyses conducted in unselected populations (β=-0.19) (85), in the autism cohort of SSC (β=-0.17) (Douard et al., manuscript under review) and in the meta-analysis combining unselected populations with autism cohorts (β=-0.19) (Huguet et al., manuscript in preparation).
On the other side, duplications have an effect size on z-scored NVIQ that’s 2-3 fold smaller than deletions and this effect size is the same in the different cohorts: in the neurodevelopment cohort of St-Justine (β=-0.06, SD=0.02, p=3×10⁻³ per one unit of pLI) (equivalent to a loss of 0.9 points of NVIQ), in SSC cohort (β=-0.06) (Douard et al., manuscript under review) and in the meta-analysis (β=-0.06) (Huguet et al., manuscript in preparation) (Table 3, Figure 7).
Table 3: Effect of gene dosage measured by pLI on NVIQ z-score in the neurodevelopment cohort of Saint-Justine..
SD: Standard deviation; Significant results are in bold black and borderline results are in bold blue.
Population (N) Intercept β pLI DEL [SD] P value β pLI DUP [SD] P value Probands (75) -0.75 -0.10 [0.03] 2.7 ×10⁻³ -0.04 [0.02] 0.14 Probands+ Siblings (112) -0.03 -0.16 [0.03] 4.3 × 10¯⁸ -0.07 [0.02] 6.2 × 10 -4 Parents (170) -0.21 -0.12 [0.06] 4.2 × 10¯² -0.01 [0.03] 0.75 Parents + Siblings (202) -0.17 -0.12 [0.05] 3.3 × 10 -2 -0.01 [0.03] 0.68 All (289) -0.58 - 0.14 [0.03] 2.4 × 10⁻⁷ -0.06 [0.02] 3.0 × 10⁻³
28
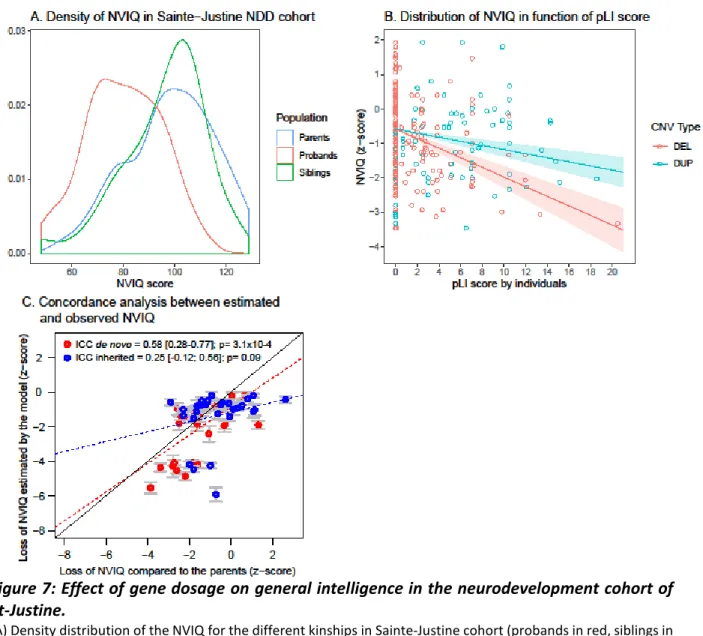
Figure 7: Effect of gene dosage on general intelligence in the neurodevelopment cohort of St-Justine.
(A) Density distribution of the NVIQ for the different kinships in Sainte-Justine cohort (probands in red, siblings in green, parents in blue). (B) Relationship between NVIQ (y-axis) and gene dosage measured by the pLI score (x-axis) (deletion: DEL in red, duplications: DUP in blue). (C) Concordance analysis between estimated loss of NVIQ computed in the meta-analysis (Huguet et al., manuscript in preparation) (y-axis) and observed loss of NVIQ in Sainte-Justine cohort (x-axis). Concordance for probands carriers of de novo CNVs are represented in red, and probands carriers of inherited CNVs are represented in blue. NDD: neurodevelopmental disorders; ICC: Intraclass correlation coefficient.
Correlation and concordance analysis of the meta-analysis model in the neurodevelopment cohort of St-Justine
In the sample of probands with a de novo CNV (N=30), the concordance, measured by intraclass correlation coefficient (ICC) between the loss of NVIQ z-score estimated by the model of the meta-analysis and the loss of NVIQ z-score observed by comparison to the parents is of 0.58
29
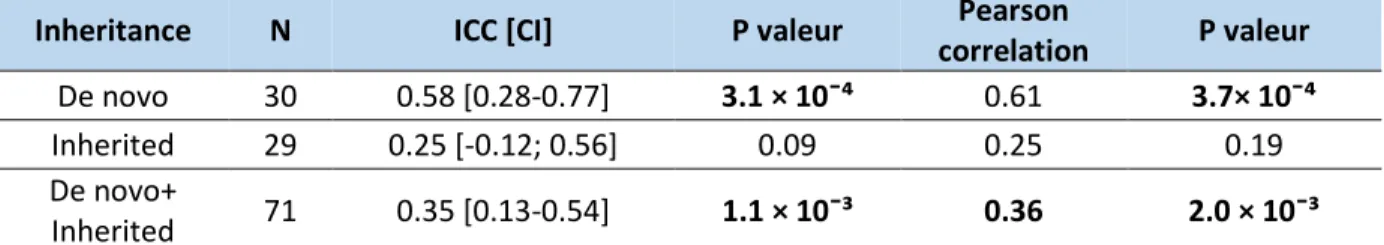
(95% CI: 0.28 to 0.77; p= 3.11×10⁻⁴) and the Pearson correlation is of 0.61 (p=3.71×10⁻⁴). However, in the sample of probands with an inherited CNV (N=29), the concordance (ICC= 0.25 (95% CI: -0.12 to 0.56)) and the Pearson correlation (0.25) are lower and not significant (p>.05). In the pooled sample (Inherited + de novo CNVs) (N=71), the concordance is of 0.35 (95% CI: 0.13 to 0.54; p=1.13 × 10¯³) and the Pearson correlation is of 0.36 (p=2×10⁻³) (Table 4, Figure 7C).
Table 4: Concordance and correlation between the loss of NVIQ estimated by the model and the real loss compared to parents.
ICC: Intraclass correlation coefficient; CI: Confidence interval. Significant results are in bold.
Effect of gene dosage on social responsiveness
SRS raw score in the autism cohorts and the unselected population
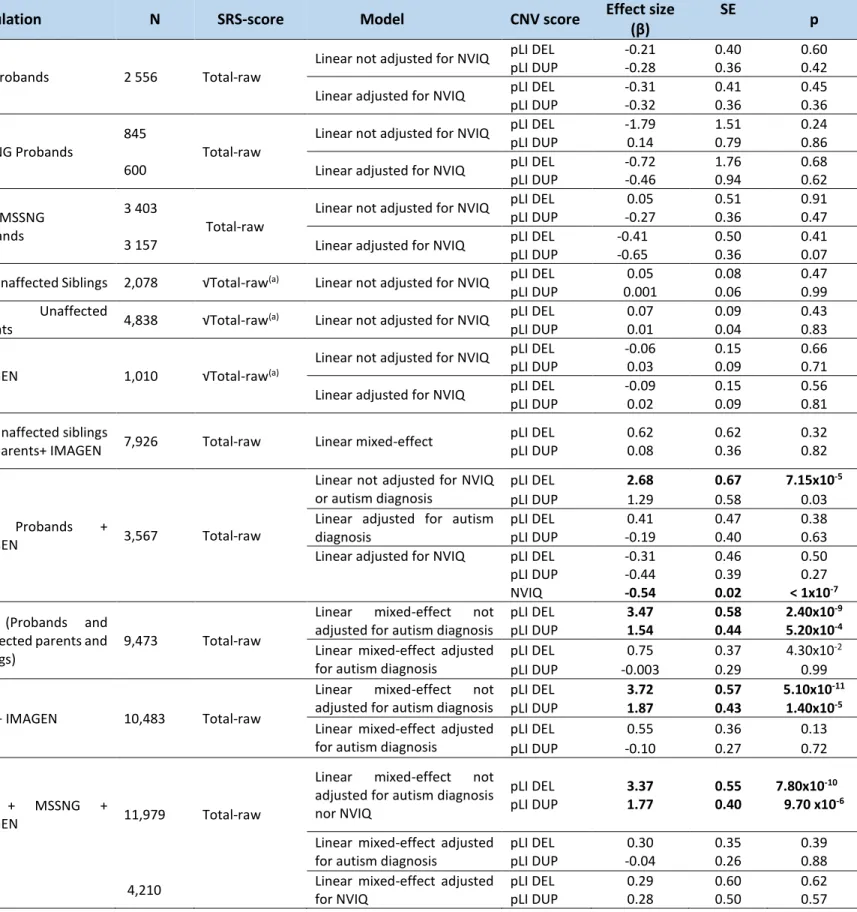
The pLI significantly increases the SRS raw score, with a 2:1 effect size ratio for deletions and duplications in the pooled SSC, MSSNG and IMAGEN dataset (deletions: β=3.37 points of raw SRS score per unit of pLI, SD=0.55, p= 7.8×10⁻¹⁰; duplications: β=1.77 points of raw SRS score per unit of pLI, SD=0.40, p=9.7×10⁻⁶). This effect of gene dosage on SRS is mainly accounted for by the NVIQ and the autism diagnosis (Table 5, Figure 8). Similar results were also observed when these analyses were done in the SSC cohort (deletions: β=3.47 points of raw SRS score per unit of pLI, SD=0.58, p= 2.4×10⁻⁹; duplications: β=1.54 points of raw SRS score per unit of pLI, SD=0.44, p=5.2×10⁻⁴) and in a pooled sample of SSC and IMAGEN (deletions: β=3.72 points of raw SRS score per unit of pLI, SD=0.57, p= 5.1×10⁻¹¹; duplications: β=1.87 points of raw SRS score per unit of pLI, SD=0.43, p=1.4×10⁻⁵) (Table 5). However, once we adjust for the autism diagnosis, the effect of pLI on SRS disappears (Table 5)
Inheritance N ICC [CI] P valeur Pearson
correlation P valeur De novo 30 0.58 [0.28-0.77] 3.1 × 10¯⁴ 0.61 3.7× 10¯⁴
Inherited 29 0.25 [-0.12; 0.56] 0.09 0.25 0.19
De novo+
30
Table 5: Effect of gene dosage measured by pLI on SRS raw score in two autism cohorts and IMAGEN.
SD: Standard deviation; NVIQ: Non-verbal intelligence quotient; DEL: deletion; DUP: duplication; pLI: probability of being Loss-of-function Intolerant; pLI DEL/pLI DUP: pLI score for deletions or for duplications; √Total-raw: square root transformation of the total SRS raw. All models used were adjusted for age, sex and ancestry. Models take into account family as random-effect when including
related individuals (see methodology section). (a)Square root transformation of the total SRS raw score was performed to adjust for
the non-Gaussian distribution or bimodality of SRS distribution (Figure 8). Significant results are in bold.
Population N SRS-score Model CNV score Effect size
(β)
SE
p
SSC Probands 2 556 Total-raw
Linear not adjusted for NVIQ pLI DEL -0.21 0.40 0.60
pLI DUP -0.28 0.36 0.42
Linear adjusted for NVIQ pLI DEL -0.31 0.41 0.45
pLI DUP -0.32 0.36 0.36
MSSNG Probands
845 600
Total-raw
Linear not adjusted for NVIQ pLI DEL pLI DUP -1.79 0.14 1.51 0.79 0.24 0.86
Linear adjusted for NVIQ pLI DEL
pLI DUP -0.72 -0.46 1.76 0.94 0.68 0.62 SSC+ MSSNG Probands 3 403 3 157 Total-raw
Linear not adjusted for NVIQ pLI DEL
pLI DUP 0.05 -0.27 0.51 0.36 0.91 0.47
Linear adjusted for NVIQ pLI DEL
pLI DUP -0.41 -0.65 0.50 0.36 0.41 0.07
SSC Unaffected Siblings 2,078 √Total-raw(a) Linear not adjusted for NVIQ pLI DEL 0.05 0.08 0.47
pLI DUP 0.001 0.06 0.99
SSC Unaffected
Parents 4,838 √Total-raw(a) Linear not adjusted for NVIQ
pLI DEL 0.07 0.09 0.43
pLI DUP 0.01 0.04 0.83
IMAGEN 1,010 √Total-raw(a)
Linear not adjusted for NVIQ pLI DEL -0.06 0.15 0.66
pLI DUP 0.03 0.09 0.71
Linear adjusted for NVIQ pLI DEL -0.09 0.15 0.56
pLI DUP 0.02 0.09 0.81
SSC Unaffected siblings
and parents+ IMAGEN 7,926 Total-raw Linear mixed-effect
pLI DEL pLI DUP 0.62 0.08 0.62 0.36 0.32 0.82 SSC Probands + IMAGEN 3,567 Total-raw
Linear not adjusted for NVIQ or autism diagnosis
pLI DEL 2.68 0.67 7.15x10⁻⁵
pLI DUP 1.29 0.58 0.03
Linear adjusted for autism diagnosis
pLI DEL 0.41 0.47 0.38
pLI DUP -0.19 0.40 0.63
Linear adjusted for NVIQ pLI DEL
pLI DUP NVIQ -0.31 -0.44 -0.54 0.46 0.39 0.02 0.50 0.27 < 1x10⁻⁷ SSC (Probands and
unaffected parents and siblings)
9,473 Total-raw
Linear mixed-effect not
adjusted for autism diagnosis
pLI DEL 3.47 0.58 2.40x10⁻⁹
pLI DUP 1.54 0.44 5.20x10⁻⁴
Linear mixed-effect adjusted for autism diagnosis
pLI DEL 0.75 0.37 4.30x10⁻²
pLI DUP -0.003 0.29 0.99
SSC + IMAGEN 10,483 Total-raw
Linear mixed-effect not
adjusted for autism diagnosis
pLI DEL 3.72 0.57 5.10x10⁻¹¹
pLI DUP 1.87 0.43 1.40x10⁻⁵
Linear mixed-effect adjusted for autism diagnosis
pLI DEL 0.55 0.36 0.13
pLI DUP -0.10 0.27 0.72
SSC + MSSNG +
IMAGEN 11,979 Total-raw
Linear mixed-effect not
adjusted for autism diagnosis nor NVIQ pLI DEL pLI DUP 3.37 1.77 0.55 0.40 7.80x10⁻¹⁰ 9.70 x10⁻⁶
Linear mixed-effect adjusted for autism diagnosis
pLI DEL pLI DUP 0.30 -0.04 0.35 0.26 0.39 0.88
4,210 Linear mixed-effect adjusted
for NVIQ pLI DEL pLI DUP 0.29 0.28 0.60 0.50 0.62 0.57
31
Figure 8: Effect of gene dosage on SRS raw score in the autism and unselected cohorts.
(A) Density distribution of the raw score of SRS in function of the cohort and kinship (SSC probands in pink, SSC siblings in dark green, SSC parents in violet, MSSNG probands in red, MSSNG siblings in light green, MSSNG parents in light blue, IMAGEN in brown). (B) Effect size of a unit of pLI on raw score of SRS (y-axis) for deletions (DEL, red) or duplications (DUP, blue) in function of the covariates used (x-axis), in the pooled dataset (SSC + MSSNG + IMAGEN). Effects were measured with and without adjustment for the diagnosis of autism or the NVIQ. The Y-axis represents the estimated effect of pLI on the SRS raw score. (C) Linear relationship between raw score of SRS (y-axis) and gene dosage measured by pLI for deletions (x axis). Individuals with a diagnosis of ASD are represented in black and unaffected individuals are in grey. (D) Linear relationship between raw score of SRS (y-axis) and gene dosage measured by pLI for duplications (x (y-axis). Individuals with a diagnosis of ASD are represented in black and unaffected individuals are in grey.
32
SRS raw score in the neurodevelopment cohort of St-Justine
The relationship between gene dosage and SRS raw score (deletion: OR=1.05, 95% CI=1.02-1.08, p=1.5×10⁻³; duplication: OR=1.05, 95% CI=1.02-1.07, p=5.3×10⁻⁵) estimated by a Quasi-Poisson model translates into a gain of 3.0 points of SRS per one unit of pLI for deletions and a gain of 2.7 points of SRS per one unit of pLI for duplications. And since this model is a non-linear model, this also translates into an increase of a mean of 38.1 and 33.9 points of SRS for a deletion or a duplication encompassing 10 units of pLI, respectively (Table 6, Figure 9). This effect of deletions and duplications on SRS remains significant after adjusting for NVIQ (deletion: OR=1.04, 95% CI=1.02-1.06, p=2.3×10⁻²; duplication: OR=1.05, 95% CI=1.01-1.08, p=3.0×10⁻³) and it translates into an increase of a mean of 3.8 and 4.3 points of SRS for a deletion or a duplication encompassing one unit of pLI respectively.
Table 6: Effect of gene dosage and NVIQ on SRS raw score in the neurodevelopment cohort of St-Justine.
OR: Odds ratio; DEL: deletions; DUP: Duplications; 95% CI: 95% confidence interval; NVIQ: Non-verbal intelligence quotient. Significant results are in bold and borderline results are in bold blue.
Population (N) OR DEL 95% CI P value OR DUP 95% CI P value OR NVIQ 95% CI P value NDD cohort (195) 1.05 1.02-1.08 1.54×10¯3 1.05 1.02-1.07 5.33 ×10¯⁵ 0.99 0.99 0.03
33
Figure 9: Effect of gene dosage on SRS raw score in the neurodevelopment cohort of St-Justine. (A) Density distribution of SRS raw score for the different kinships (probands in red, siblings in green, parents in blue). (B) Effect size of pLI (x-axis) on raw score of SRS (y-axis) for deletions (DEL, red) or duplications (DUP, blue) in Sainte-Justine cohort. The Y-axis represents the estimated effect of pLI on the SRS raw score using a quasi-poisson regression model. NDD: Neurodevelopmental disorders.
SRS categories in the autism cohorts and the unselected population
In the pooled dataset of SSC, MSSNG and IMAGEN, the ordinal regression performed on the 4 categories of SRS (normal, mild, moderate and clinically significant) shows that an increase of pLI for deletions or duplications increase the risk of being in a category with higher deficits in social functioning (deletions: OR= 1.15; 95% CI, 1.07-1.23; p< 1.0×10⁻³; duplications: OR= 1.10; 95% CI, 1.04-1.16; p< 1.0×10⁻³). This effect disappears once we adjust for the presence of an autism diagnosis or for NVIQ (Table 7, Figure 10). Similar results were obtained when using a pooled sample of SSC and IMAGEN (deletions: OR= 1.32; 95% CI, 1.12-1.60; p< 1.0×10⁻³; duplications: OR= 1.18; 95% CI, 1.04-1.35; p< 1.0×10⁻³) (Table 7).
The logistic regression performed on 2 categories of SRS (normal vs clinical) in the pooled dataset (SSC, MSSNG and IMAGEN) also shows that increasing the pLI leads to a higher probability of having social deficits that are clinically significant (deletions: OR= 1.21; 95% CI,
34
1.12-1.31; p< 1.0×10⁻³; duplications: OR= 1.13; 95% CI, 1.07-1.21; p< 1.0×10⁻³) and adjustments with the NVIQ or with the autism diagnosis make the effect of gene dosage on SRS insignificant. Similar results were obtained in the pooled dataset of SSC and IMAGEN (deletions: OR= 1.22; 95% CI, 1.12-1.34; p< 1.0×10⁻³; duplications: OR= 1.14; 95% CI, 1.06-1.23; p< 1.0×10⁻³) (Table7, Figure 10).
Table 7: Effect of gene dosage measured by pLI on SRS categories.
SD: Standard deviation; NVIQ: Non-verbal intelligence quotient; DEL: deletion; DUP: duplication; pLI: probability of being Loss-of-function Intolerant; pLI DEL/pLI DUP: pLI score for deletions or for duplications. All logistic or ordinal regression models used were adjusted for age. Models take into account family as random-effect when including related individuals (Methods). (a) Based on the previously published T-score categorization (109)
(Methods). Significant results are in bold.
Population N SRS-score Model CNV score
Effect size (OR) SD p SSC Probands+ Unaffected siblings+ IMAGEN 5,188 SRS categories (normal, clinical) (a)
Logistic regression not adjusted pLI DEL pLI DUP 1.22 1.14 1.12-1.34 1.06-1.23 <1.0 x10⁻³ <1.0 x10⁻³ Logistic regression
adjusted for autism
diagnosis pLI DEL pLI DUP 0.93 0.98 0.83- 1.05 0.88-1.05 0.22 0.69 SSC Probands+ Unaffected siblings+ IMAGEN 5,188 SRS categories (normal, moderate, mild, clinically significant) (a)
Ordinal not adjusted pLI DEL
pLI DUP 1.32 1.18 1.12- 1.60 1.04-1.35 <1.0 x10⁻³ <1.0 x10⁻³
Ordinal adjusted for
autism diagnosis pLI DEL pLI DUP 1.04 0.99 0.97-1.13 0.94-1.05 0.35 0.87 SSC and MSSNG Probands+ Unaffected siblings+ IMAGEN 5,688 SRS categories (normal, clinical) (a)
Logistic regression not adjusted pLI DEL pLI DUP 1.21 1.13 1.12-1.31 1.07-1.21 <1.0 x10⁻³ <1.0 x10⁻³ Logistic regression
adjusted for autism
diagnosis pLI DEL pLI DUP 0.94 0.97 0.86-1.06 0.87-1.08 0.41 0.61 3,523 Logistic regression
adjusted for NVIQ
pLI DEL pLI DUP 1.03 1.03 0.97-1.15 0.99-1.08 0.73 0.41 SSC and MSSNG Probands+ Unaffected siblings+ IMAGEN 5,688 SRS categories (normal, moderate, mild, clinically significant) (a)
Ordinal not adjusted pLI DEL
pLI DUP 1.15 1.10 1.07-1.23 1.04-1.16 <1.0 x10⁻³ 1.0 x10⁻³
Ordinal adjusted for
autism diagnosis pLI DEL pLI DUP 1.02 1.00 0.96-1.09 0.99-1.05 0.53 0.89
3,523 Ordinal adjusted for NVIQ pLI DEL
pLI DUP 1.00 1.01 0.95-1.06 0.96-1.06 0.90 0.55
35
Figure 10: Effect of gene dosage on T-score of SRS in the pooled autism and general populations. (A) Density distribution of the T-score of SRS in function of the cohort and kinship (SSC probands in pink, SSC siblings in dark green, MSSNG probands in red, MSSNG siblings in light green, IMAGEN in brown). (B) Effect size of pLI on categories of SRS (y-axis) for deletions (DEL, red) or duplications (DUP, blue) in function of the covariates used (x-axis), in the pooled dataset (SSC + MSSNG + IMAGEN). The Y-axis represents the estimated OR for the clinical category conferred by one unit of pLI. Effects-size were measured as an OR by ordinal regressions on 4 categories (normal, mild, moderate, clinical) or by logistic regressions on binary categorical SRS (clinical and normal). These analyses were done with and without adjustment for the diagnosis of autism or the NVIQ.