R E S E A R C H
Open Access
Aggressive incidents inside a Montreal barroom
involving patrons, barmaids and bouncers: A
micro level examination of routine activity theory
Steve Geoffrion
1*, Josette Sader
2, Frederic Ouellet
2and Remi Boivin
2Abstract
Objectives: This article further examines the phenomenon of aggression inside barrooms by relying on the “bouncer-ethnographer” methodology. The objective is to investigate variations in aggression through time and space according to the role and routine of the target in a Montreal barroom. Thus, it provides an examination of routine activity theory at the micro level: the barroom.
Methods: For a period of 258 nights of observation in a Canadian barroom, bouncers completed reports on each intervention and provided specific information regarding what happened, when and where within the venue. In addition, the bouncer-ethnographer compiled field observations and interviews with bar personnel in order to identify aggression hotspots and“rush hours” for three types of actors within barrooms: (a) bouncers, (b) barmaids and (c) patrons.
Findings: Three different patterns emerged for shifting hotspots of aggression depending on the target. As the night progresses, aggressive incidents between patrons, towards barmaids and towards bouncers have specific hotspots and rush hours influenced by the specific routine of the target inside the barroom.
Implications: The current findings enrich those of previous work by pointing to the relevance of not only examining the environmental characteristics of the barroom, but also the role of the target of aggression. Crime opportunities follow routine activities, even within a specific location on a micro level. Routine activity theory is thus relevant in this context, because as actors in differing roles follow differing routines, as do their patterns of victimization.
Keywords: Aggressive incidents; Barroom; Routine activity; Bouncer-ethnographer; Aggressive incidents inside a Montreal barroom involving patrons; Barmaids and bouncers: A micro level examination of routine activity theory It is a well-known fact that aggression is commonplace in
licensed drinking premises such as barrooms (Burrows et al. 2001; Graham et al. 2012; Leonard et al. 2002; Pernanen 1991). Macintyre and Homel (1997) were among the first to examine the contribution of the en-vironmental features of venues in the occurrence of ag-gression within barrooms. Building on that study and that of Graham et al. (2012), this paper further exam-ines the phenomenon of barroom aggression by expanding upon the results of Geoffrion et al. (2014). It also relies on the“bouncer-ethnographer” methodology of Winlow et al. (2001), a research design in which
bouncers collect data regarding their interventions and their environment.
Roberts (2009) conducted a literature review on the features of certain barroom environments as they affect aggressive behaviours and found major variations in crime risk within and near establishments licensed to sell or serve alcohol. Thus, aggressive incidents may re-flect environmental features specific to different bar-rooms (Graham and Homel 2012) such as dancing (Graham et al. 1980; Quigley et al. 2003; Graham et al. 2006), pool tables (Graham et al. 1980; Quigley et al. 2003; Graham et al. 2006), inconvenient access to serv-ing bars (Homel et al. 1997), entrance queues (Graham et al. 2006), and substantial and conflicting patron movements (Graham et al. 1980).
* Correspondence:s.geoffrion@umontreal.ca
1School of psychoeducation, Université de Montréal, 90 Marie-Victorin, Montreal H2V 2S9, Canada
Full list of author information is available at the end of the article
© 2015 Geoffrion et al.; licensee Springer. This is an Open Access article distributed under the terms of the Creative Commons Attribution License (http://creativecommons.org/licenses/by/4.0), which permits unrestricted use, distribution, and reproduction in any medium, provided the original work is properly credited.
With these environmental features in mind, the concen-tration of crime risk by place and time is particularly im-portant for studying aggression within barrooms. Graham et al. (2012) found that barroom environments contained hotspots for aggression. In their sample of Toronto night-clubs, 20.0% of all aggressive incidents were witnessed on the dance floors, 11.5% near the dance floors, 15.7% near the serving bars, 13.1% in the table areas, 6.2% in areas of movement, and 4.5% near entrances.
Inspired by environmental criminology, Geoffrion et al. (2014) utilized routine activity theory in order to examine problem incidents inside a barroom. With the use of systematic observation from bouncer-ethnographers, they found that incidents were unevenly distributed in space and time, producing “rush hours” and internal hotspots. On the time level, the number of interventions progressively increased as it got later. Thus, the majority of interventions in this barroom oc-curred between midnight and 3:00, with a climax be-tween 2:00 and 2:29. In addition, hotspots were identified, with over 60% of all interventions occurring in four locations: the bars, the restrooms, the dance floor and the area around the dance floor. In this bar-room, these four locations were adjacent to each other and peripheral to the dance floor, thus representing a “carousing zone”. “Shifting hotspots” of were also evident; bouncer interventions moved from the entrance door and tables early on in the night towards the‘carousing zone’ as the night progressed. Thus, it was demonstrated that rou-tine activity theory is perrou-tinent in the examination of the occurrence of aggressive incidents within a barroom. The current paper furthers this examination, with the goal of assessing whether shifting hotspots are influenced by the role-specific routine of the target of aggression. Based on Sherman et al. (1989), shifting hotspot in the context of this study is defined as the shift trough time and space of locations with extremely high rates of crime.
Routine activity theory, which posits that routines influ-ence the occurrinflu-ence of misbehaviour (Cohen and Felson 1979), has traditionally been applied on a macro level of analysis. However, this theory has been demonstrated as being useful in the analysis of victimization on a micro level, such as inside a barroom (Geoffrion et al. 2014). Since all actors do not share the same routine in a barroom context, it is expected that the spatial-time distribution of their victimization will also differ. Thus, even within a single location, routine activity theory can contribute to the understanding of specific victimization patterns of different actors.
In terms of prevention strategies, research examining barroom aggression through time and space has import-ant implications. In this vein, Homel et al. (1992) argued that focusing intervention on barroom environmental factors is the most promising strategy to control or
prevent aggression. Research has revealed that aggressive incidents are more frequent in bars with long queuing lines (Graham et al. 2004), in crowded and small venues (Graham et al. 2006), in bars where bouncers/security staff are too few, aggressive or poorly trained (Quigley et al. 2003), and in premises where alcohol is served with little consideration for the client’s level of intoxication (Buka and Birdthistle 1999; Gliksman et al. 1993; Stockwell 2001). An efficient closing procedure is also crucial, as the number of people remaining after closing time is asso-ciated with the frequency and severity of aggressive acts (Graham et al. 2006). The importance of effective man-agement is thus highlighted. The current study can contribute to the refinement of prevention strategies by specifying hotspots and“rush hours” of aggression accor-ding to the different routines of actors in the barroom.
Besides the work of Macintyre and Homel (1997), Graham et al. (2006; 2012) and Geoffrion et al. (2014), few studies have examined hotspots and“rush hours” inside li-censed drinking premises. Even fewer have addressed this phenomenon in relation to the role-related routines of the target of the aggression. Considering that the role of each actor corresponds to specific behaviours, the current study contributes to the understanding of role-specific patterns of victimization on a micro level.
The current study
The present study aims to explore the distribution of ag-gression in a single Montreal barroom through space and time by reporting on systematic observation completed over the course of a year. More specifically, the objective is to understand variations in aggression through time and location within a single night according to the routine of the target. Based on an ethnographic study of a club in downtown Montreal, this paper identifies aggression hot-spots and “rush hours” for three types of targets within barrooms: (a) bouncers, (b) barmaids and (c) patrons. Consequently, in addition to examining routine activity theory on a micro level, findings could reveal the existence of high-risk moments and locations for bar personnel and patrons and may guide role-specific prevention strategies. Method
Data collection
This study relies on systematic observation as instructed by Reiss’s work (Reiss 1968; Reiss 1971; Mastrofski et al. 1998; 1971; 1968) and on a “bouncer-ethnographer” strategy as put forward by Calvey 2000, Winlow et al. 2001 and Monahagan 2004. Studies that have utilized bouncer-ethnographers or “covert methodology” have demonstrated that this design provides an in-depth under-standing of what really happens in clubs while revealing facts that would not otherwise be distinguishable for out-siders or through official data (Hobbs 2003; Hobbs et al.
2002; Lister et al. 2000; Monahagan 2004; Winlow et al. 2001). The co-author acting as a“bouncer ethnographer” was an employee of the nightclub during data collection. He had been employed at this club for four years and was a member of the security staff when he convinced the club managers to allow systematic observations of bouncer in-terventions. Thus, the present study compiles ethno-graphic observations within a single club over the course of almost a year, with details regarding specific incident locations and timing. The data was collected between April 2006 and April 2007 on all nights except Monday and Wednesday.
Prior to data collection, all staff members (n = 47) were instructed of the future research and accepted to partici-pate in this study. Bouncers were to complete a report of their intervention immediately following its occurrence at the cashier box next to the entrance door. The security team counted 12 bouncers who had an average of five years of experience. Five bouncers were on duty each night, with the exception of Tuesdays when there were seven. The barroom’s management tried to maintain the ratio of one bouncer per 100 patrons. The staff members, under the guidance of the bouncer-ethnographer, created a grid to facilitate intervention reporting. In the context of this study, pertinent details were the time and location of the intervention. Bouncers also had the opportunity to provide qualitative details about their intervention.
Thus, for 258 nights of observation, bouncers completed reports regarding each intervention immediately after its occurrence and provided specific information on what happened, as well as when and where within the club. This protocol included a discussion with a non-participant staff member in order to properly code the security event and to diminish personal bias. They had to agree on the motive that triggered the intervention. The bouncer-ethnographer was present on 249 of the 258 observed nights. Bouncers performed 789 interventions during the year under study. Of these, 225 were related to aggression committed by patrons towards bouncers, barmaids or other patrons.
The researchers also supplemented their observations with semi-structured interviews with 10 out of 14 bouncers that worked during the assessed year. The ques-tions focused on the context of intervention and the tech-niques used to handle patrons, but also on aggression patterns and concentration as the night progresses. In this way, bouncers provided their opinions about their club’s hotspots and“rush hours” while putting forth explanations for these patterns.
The barroom
Located near two universities, this nightclub mostly serves student patrons aged between 18 and 23 years old and is well known in the local media for its “cheap
booze”. In business for over 40 years, the student-culture reputation of the club also attracts many young tourists from all over the city. Although this barroom was open seven days a week, this study focuses only on the five evenings where the dance hall was available to patrons. Each club night had its specific theme coupled with drinking specials, which remained the same throughout the year. In terms of music, Tuesday was retro, Thursday to Saturday was Top 40 and Sunday was French music only. The club was open from 20:00 to 3:00 and had a legal capacity of 475 patrons (for more details about this barroom, see Geoffrion et al., 2014). Measures
Bouncer interventions for aggression were the outcome variable for this study. When bouncers were instructed about the research protocol, intervention was defined as any action completed in the purpose of maintaining secur-ity in the club. Thus, it included simple warnings, tech-niques used to deter behaviour such as intimidation, and expulsion of the patron. Of the 225 aggressive incidents handled by bouncers, 91.6% (n = 206) resulted in the expul-sion of the patron. The mean number of bouncer interven-tions per night was 0.9, with a standard deviation of 1.2. The distribution of interventions per night was skewed to the right, with no aggression on 128 nights while, on two occasions, 7 aggressive incidents occurred on a single night. When bouncers were instructed about research proto-col, aggression was defined as any verbal, physical or sexual behaviour that threatens the safety of the victim. Verbal threats accounted for 3.1% of all recorded inci-dents, while physical behaviour represented 88.0% and sexual behaviour 8.9%. All of these incidents were initi-ated by patrons and 96% of them were started by male patrons. Even though studies have suggested that bouncers sometimes are the first perpetrator, we only focus on aggression committed by patrons in the present study. All these types of aggression were regrouped and classified in three categories based on the identity of the target: (a) aggression towards bouncers, (b) aggression to-wards barmaidsand (c) aggression between patrons. Bouncer intervention locations
The barroom has four different levels: the entrance door (ground level), the lounge (1stlevel), the main floor (2nd level) and the balcony (3rdlevel). Bouncers identified 24 different locations where interventions began and these locations were recoded into ten different categories: bars (near the serving bars), restrooms, around the dance floor, the dance floor, the entrance door (queuing), areas of movement (aisles, stairs), the balcony, shady areas (low lights), the lounge and outside the barroom. Figure 1 illustrates these locations on the floor plan of the nightclub.
Bouncer intervention times
Bouncers also noted the time when the interventions began. Even though legal closing time in the province of Quebec is 3:00, patrons were slowly expelled in order to give them time to finish their last drink. Most of the time, music was shut off around 3:10. The latest inter-vention for aggression during the panel year occurred at 3:20 while the earliest was at 20:30.
Analysis
Since this nightclub has multiple features that influence its routine activities and that each actor within a bar-room has his own specific role-related routine, sen-sitivity analysis will allow us to verify the strength of incident patterns (e.g. hotspots and “rush hours”) through aggregates of the sum depending on the identity of the target. Thus, it disaggregates routine according to the role of the actor. Field observations and interviews with bouncers will further illustrate the quantitative data and support our interpretations by providing details regarding the situational contingencies of aggressive incidents.
Results
Table 1 describes the locations of all aggressive incidents as well as aggression according to the target. With the aggregate of aggression, the most frequent locations for
bouncer interventions were respectively: bars, the dance floor, the area around the dance floor and the entrance door (equal), movement areas, the balcony, shady areas, movement area, the lounge, restrooms and the balcony. Interventions disaggregated according to the target dem-onstrate different scenarios. When aggression occurred between patrons, the dance floor appeared as the most frequent location, followed by bars and the area around the dance floor. For aggression towards barmaids, the three most frequent locations respectively were bars, the area around the dance floor and shady areas. As for ag-gression towards bouncers, the main location was the entrance door followed by bars and movement areas.
Ethnographic observations provide contextual details about these different scenarios according to the target of aggression. The dance floor and its surrounding area as well as bars are the most crowded locations in the bar-room and involve the most interactions between pa-trons. The bars of this particular barroom had rather slow service during the year of observation. Patrons often had to “fight” their way into being served. They would push one another to get access to the bar and order their beverage. During the interviews, bouncers provided their views on this slow service.“Since tips are split equally among all bar personnel in this club, bar-maids are not in a hurry to serve patrons and maximize their personal tips for the night. They then prefer to talk Figure 1 Schematic map of three different levels of a Montreal nightclub. Source: Geoffrion et al. 2014.
with clients and drink with them to have a good time. Consequently, the service is shitty and patrons get frus-trated. We are recognized in the barroom scene to have cheap booze, but a long time to get it”. On the dance floor and its surrounding areas, observation notes are similar: the density and movement in this area increased snagging between patrons, which triggered fights. In addition, based on field notes, fights in these locations occurred more often when men outnumbered women on the dance floor. All bouncers were unanimous on this aspect,“guys fight on the dance floor because they com-pete for the few women who may be available”.
The main location of aggression targeting barmaids was the bars. Even though they are separated from their clients by a counter, participant-observations revealed that this distance did not deter intoxicated patrons from pulling barmaids by their arms or hair in order to get served or to kiss them. The second most dangerous lo-cation for barmaids was the area around the dance floor. Every night, one of the barmaids acted as a waitress. Only serving on the main floor, her “serving path” was located around the dance floor. In parallel to this loca-tion, shady areas are the third location where barmaids get assaulted most often. Participant-observations re-vealed that sometimes, the waitressing barmaid had to venture into shady areas in order to find patrons that had previously ordered drinks in her “serving path” but had moved while she went to get the drinks.
The most frequent location for aggression towards bouncers was the entrance door. As explained by one bouncer, “refusing access to the venue to a patron is sometimes riskier than expulsing a patron, especially when it is refusing access to a group of young males in
front of the queuing line”. Another bouncer who was mainly assigned to controlling the queuing line on busy nights reported that “drinking in the line and pre-drinking” were ingredients for altercations with bouncers at the entrance door. Participant-observations confirmed this report. When in line, patrons often drank hard li-quor that they camouflaged in water bottles. Already in-toxicated at the door, they easily became frustrated when access was refused. Next, the bars represented the second most risky location for aggression towards bouncers. As patrons got frustrated by poor service and often harassed the barmaids, bouncers were often called to intervene at this location. Consequently, they were exposed to crowded and frustrated patrons. The third lo-cation was the movement area, which corresponds to the “surveillance path” of the bouncers. Even though they are supposed to walk through the entire the venue, observations and interviews confirmed that bouncers walked through the movement area most often, while taking a static place in other locations in order to moni-tor the venue from different angles. Thus, walking through a crowd of patrons in the movement area made it more likely for bouncers to interact with clients.
As shown in Table 2, bouncer interventions for aggres-sion were unequally distributed over time. We observed that the number of interventions increased as it got later, with a climax between 2:00 and 2:59. However, a drop in interventions can be observed from 3:00 to closing time. Aggregates for aggression between patrons followed the same time pattern with an even more accentuated cli-max between 2:00 and 2:29 (42.2%). As for aggression towards barmaids and bouncers, the climax and the subsequent drop in aggression was reached an hour Table 1 Location of bouncer interventions for aggression within a Montreal nightclub, April 27, 2006 to April 24, 2007
Location within the club (1) (2) (3) (4) (5)
Interventions at this location
Percentage at this location
Between patrons Towards barmaids Towards bouncers
Percentage at this location
A - Entrance door 27 12.1 4.4 9.7 31.6
B - Lounge 13 5.8 5.9 6.5 5.3
C - Bar 52 23.3 23.0 29.0 21.1
D - Around dance floor 27 12.1 11.9 22.6 7.0
E - Dance floor 49 22.0 33.3 3.2 5.3 F - Balcony 7 3.1 3.0 3.2 3.5 G - Restrooms 12 5.4 7.4 3.2 1.8 H - Movement area 16 7.2 2.2 9.7 17.5 I - Shady areas 20 9.0 8.9 12.9 7.0 Total % — 100.0 100.0 100.0 100.1 Base N 223 223 135 31 57
earlier. Furthermore, the proportion of aggression to-wards bouncers and barmaids between 3:00 and 3:30 was slightly higher than for aggression between pa-trons. Participant-observations for this period of time revealed that highly intoxicated patrons who were flirt-ing with barmaids durflirt-ing the night reacted aggressively to the barroom closing and the kiss goodbye from the barmaids, who had put a sudden stop to the seduction game. As for aggression towards bouncers, all bouncer interviews revealed that highly intoxicated patrons reacted very badly to their“get out of the bar, it is closing time” interventions.
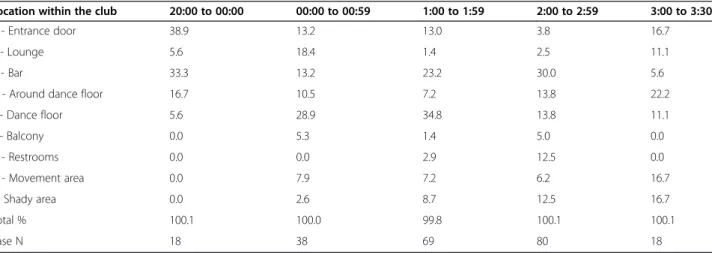
Table 3 represents the interaction of time and space variables. From 20:00 to midnight, 38.9% of the 18 ag-gressive incidents reported occurred at the entrance door, 33.3% at bars and 16.7% around the dance floor. The remaining 11% were located in the lounge and on the dance floor. Participant-observations supported this result: most people enter the venue, buy their drinks and start to gather around the dance floor. From 00:00 to 0:59 the dance floor became the location with the most
aggression (28.9%) while the lounge (18.4%), the en-trance door (13.2%), the bars (13.2%) and the area around the dance floor (10.5%) were also conducive to aggression. From 1:00 to 1:59, the dance floor was still the main location for aggression (34.8%) followed by the bars (23.2%) and the entrance door (13.0%). From 2:00 to 2:59, the main location shifted to the bars (30.0%). However, the dance floor and its surroundings also encompassed 27.6% of the aggression during this period of time. In fact, at this hour, the highly crowded dance floor had expanded to the area around it, and thus must be interpreted as a single location. Meanwhile, aggres-sion started to occur more often in the restrooms (12.5%) and in shady areas (12.5%). From 3:00 to closing time, aggressive incidents were scattered all around the nightclub as people were getting pushed by bouncers to exit the venue. As the night progressed, results show an increase of aggression in shady areas.
Table 4 shows the interaction of time and space vari-ables disaggregated according to the target of the aggres-sion. For aggression between patrons, the location with Table 2 Time of bouncer interventions for aggression within a Montreal nightclub, April 27, 2006 to April 24, 2007
Location within the club (1) (2) (3) (4) (5)
Interventions at this time Percentage at this time Between patrons Towards barmaids Towards bouncers Percentage at this time
Before midnight 19 8.4 5.9 12.9 11.9 00:00 to 00:59 38 16.9 18.5 12.9 15.3 1:00 to 1:59 69 30.7 28.1 32.3 35.6 2:00 to 2:59 81 36.0 42.2 29.0 25.4 3:00 to 3:30 (closing time) 18 8.0 5.2 12.9 11.9 Total % 100.0 99.9 100.0 100.1 Base N 225 225 135 31 59
Percentages do not always add to 100.0 due to rounding error.
Table 3 Percentage distribution of location of bouncer interventions through time in a Montreal nightclub, April 27, 2006 to April 24, 2007
Location within the club 20:00 to 00:00 00:00 to 00:59 1:00 to 1:59 2:00 to 2:59 3:00 to 3:30
A - Entrance door 38.9 13.2 13.0 3.8 16.7
B - Lounge 5.6 18.4 1.4 2.5 11.1
C - Bar 33.3 13.2 23.2 30.0 5.6
D - Around dance floor 16.7 10.5 7.2 13.8 22.2
E - Dance floor 5.6 28.9 34.8 13.8 11.1 F - Balcony 0.0 5.3 1.4 5.0 0.0 G - Restrooms 0.0 0.0 2.9 12.5 0.0 H - Movement area 0.0 7.9 7.2 6.2 16.7 I - Shady area 0.0 2.6 8.7 12.5 16.7 Total % 100.1 100.0 99.8 100.1 100.1 Base N 18 38 69 80 18
Table 4 Percentage distribution of location of bouncer interventions through time in a Montreal nightclub according to the role of the target, April 27, 2006 to April 24, 2007
Patrons Barmaids Bouncers
Location within the club 8:00 to11:59 12:00 to 12:59 1:00 to 1:59 2:00 to 2:59 3:00 to 3:30 8:00 to 11:59 12:00 to 12:59 1:00 to 1:59 2:00 to 2:59 3:00 to 3:30 8:00 to 11:59 12:00 to 12:59 1:00 to 1:59 2:00 to 2:59 3:00 to 3:30 A - Entrance door 12.5 8.0 7.9 0.0 0.0 0.0 0.0 10. 22. 0.0 100. 33.3 23. 7.1 42. B - Lounge 12.5 16.0 2.6 3.5 0.0 0.0 0.0 00.0 20.0 50. 00.0 33.3 80.0 0.0 90.0 C - Bar 37.5 12.0 21. 29. 0.0 75.0 50.0 10. 22. 025. 0.0 0.0 33. 35. 0.0 D - Around df 25.0 8.0 17.9 812. 28. 25.0 25.0 020. 222. 025. 0.0 11.1 30.0 714. 14. E - Dance floor 12.5 44.0 52. 319. 628. 0.0 0.0 010. 20.0 00.0 0.0 0.0 14. 30.0 30.0 F - Balcony 0.0 8.0 60.0 33.5 60.0 0.0 0.0 010. 0.0 0.0 0.0 0.0 30.0 14. 0.0 G - Restrooms 0.0 0.0 5.3 14. 0.0 0.0 0.0 00.0 11. 0.0 0.0 0.0 0.0 37.1 0.0 H– Move area 0.0 4.0 0.0 03.5 0.0 0.0 0.0 20. 111. 0.0 0.0 22.2 14. 14. 42. I - Shady area 0.0 0.0 2.6 14.0 42.9 0.0 25.0 020.0 111.1 0.0 0.0 0.0 314.3 37.1 90.0 Base N 8 25 38 57 7 4 4 10 9 4 6 9 21 14 7
Percentages do not always add to 100.0 due to rounding error, df = dance floor.
Crime Science (2015) 4:9 Page 7 of 10
the most frequent incidents moved from the bars at the beginning of the night until midnight (37.5%), to the dance floors from midnight to 2:00 (44.0% and 52.6%), back to the bars until closing time (29.8%) and then to shady areas as people were exiting the venue. Nevertheless, from 3:00 to 3:30, the dance floor and its surroundings encompassed 49.2% of the aggression between patrons. Participant-observations reported that, as the night pro-gressed, patrons converged towards the dance floor and its proximity, going back and forth to the bars. At 3:00, as the bars were closing and the lights were turning on, the remaining patrons all crowded on the dance floor or around it making their last attempt at seduction or getting sick in shady areas.
As for aggression towards barmaids, the main loca-tions were the bars from opening hour to 1:00 (75.0% and 50.0%), then scattered all around the venue from 1:00 to 3:00 to finally concentrate at the lounge (50.0%). As mentioned, participants-observations noted that after 1:00, the waitressing barmaid had to search for her cli-ents further than her “serving” path and had to venture into different areas. However, bouncers reported in interview that, “during their break, barmaids often go drink, chat and dance with patrons. Sometimes they see things and try to intervene. When they do, they often get assaulted”. As for the concentration of incidents in the lounge, bouncers explained that at closing time, bar-maids invited patrons with whom they had flirted to the lounge, which became a private section, and it often turned bad.
The only location for aggression towards bouncers be-fore midnight was the entrance door (100.0%). From midnight to 1:00, the entrance door and the lounge were the main locations (33.0% for both). From 1:00 to 3:00, the bars became the main location for aggression to-wards bouncers (33.3% and 35.7%). From 3:00 to 3:30, the movement area and the entrance door were the loca-tions with the most aggression.
Discussion
The objective of the current paper was to examine varia-tions in aggression through time and space according to the role of the target in a Montreal barroom. In fact, bouncer interventions disaggregated according to the target of the aggression demonstrate distinct scenarios that differ from the aggregate of all targets, thus expand-ing upon the work of Geoffrion et al. (2014). In fact, as demonstrated by Geoffrion et al. (2014), when interven-tions for aggressive incidents are aggregated, they follow the movement of the crowd as the night progresses. Be-ginning at the entrance and table areas, later moving into the“carousing” zone (bars, dance floor and its prox-imity), hotspots for interventions seem to corresponds to the changing densities of different locations at
different times. However, when examining shifting hot-spots according to the target, three different patterns emerge for aggression between patrons, towards bar-maids and towards bouncers.
For incidents occurring between patrons, aggression moves from the bars at the beginning of the night until midnight, to the dance floors from midnight to 2:00, back to the bars until closing time, and then to shady areas as people are exiting the venue. As reported through participant-observation, service was rather slow at the bars of this particular barroom and patrons would often push one another to get access to the bar and order their beverage. This result complements previous findings (Graham et al. 2004; Graham et al. 2012), which reported that aggression at the serving bar is linked to poorly coordinated staff, which may result in frustrations and long queuing lines. Thus, situational prevention strat-egies at the serving bar might include ensuring a sufficient number of barmaids with better training (Graham et al. 2012) in order to reduce aggression between patrons at this location. Also, aggression on the dance floor may be related to crowding in that area, which suggests the need to improve the design and supervision of dance floors (Graham et al. 2012). The incidence of aggression in shady areas after closing time implies that an efficient closing procedure is also important as the number of people remaining in the venue is associated with the frequency of aggressive acts (Graham et al. 2006). Alternatively, im-proving the lighting in these areas may also be effective in reducing the incidence of aggression (Homel, Carvolth, Hauritz, McIlwain, & Teague, 2004).
When the targets of aggression are the barmaids, inci-dents mainly occur at the bars from opening hour to 1:00, then scatter all around the venue from 1:00 to 3:00, to fi-nally converge in the lounge after closing time. Just as slow service at the bar was related to aggression between patrons, it may also contribute to aggressive incidents to-wards barmaids. Thus, ensuring that the bar service runs smoothly may be a strategy for increasing the safety of staff members. In addition, participants-observations noted that the waitressing barmaid often ventured beyond her“serving” path, and interviews revealed that barmaids sometimes drank and danced with patrons. Similarly, in-terviews suggested that the concentration of aggression in the lounge was related to barmaids inviting patrons with whom they had flirted to the area after closing time. Con-sidering these circumstances, aggression may occur when serving staff has poor professional boundaries and is overly familiar with patrons (Graham et al. 2012). Thus, a possible strategy for the prevention of aggression towards barmaids is professional training and awareness of the im-portance of boundaries. Also, they should avoid searching for patrons that have moved from their“ordering location” and simply return the drink to the bar.
When bouncers are the targets of aggression, incidents occur at the entrance door before midnight, then shift from the bars from 1:00 to 3:00 to the movement area and the entrance door from 3:00 to 3:30. Interviews and participant-observations revealed that patrons were often already intoxicated by the time they reached the entrance door and were easily frustrated when access to the barroom was refused, thus leading to aggression. Since “drinking in the line” was observed, bouncers could forbid this practice and refuse access to these pa-trons. To prevent escalation of aggression towards the bouncer, this prohibition could be advertised at the en-trance door and recall the provincial law forbidding the consumption of alcohol in the streets. Regarding the next hotspot at the bars, previously discussed problems in terms of slow service affected the incidence of aggres-sion towards bouncers, as they were often called to intervene. Finally, the movement area, which corre-sponds to the bouncer “surveillance path”, was a com-mon location for aggression towards bouncers. Walking through a crowd of patrons in the movement area made it more likely for bouncers to interact with clients. This finding is in line with the work of Graham et al. (2012), who found that areas of movement were among the most frequent locations for aggression. Prevention strat-egies should pay greater attention to the layout and design of the venue in order to reduce movement (Graham et al. 2012). An efficient closing procedure also seems important for the reduction of aggression in the movement area and near the entrance door after closing time.
Overall, these findings raise questions regarding the ap-plication of routine activities theory to a barroom setting. First, results demonstrate that guardians in this context are also victims. Since previous research has indicated that bouncers have a role in initiating and exacerbating alterca-tions (Graham et al., 2005; Wells, Graham, & West, 1998; Homel et al., 1992), future research should investigate how prior victimization of the guardian may intensify his use of physical force in the management of his next inter-vention. Findings also suggested that the role of the target is significantly associated with his or her pattern of victimization. However, other factors must be considered when assessing the risk of victimization in a festive setting such as that of intoxication. Indeed, ethnographic observa-tion revealed that intoxicated aggressors were not even aware of the identity of their victim, realizing that they had hit a bouncer or another patron only after expulsion. In parallel, findings of the present study exposed some of the strengths and limitations of the bouncer-ethnographer method in examining routine activities theory. On one side, it provides contextual and dynamic information of micro-situations that are harder to measure with quantita-tive instruments. On the other hand, this method does not account for aggressive incidents that occurred in the
absence of a guardian, as the guardians were the ones pro-viding the data. In addition, the motivation of the offender was not assessed from his or her perspective.
Study limitation
The results of the current paper should be considered in light of their limitations. First, the findings are idio-syncratic since they are based on a case study thus restricting their generalizability. Even though this barroom may share similarities with others, proposed prevention strategies should be investigated in other clubs in light of their specific features (e.g. clientele, opening hours, loca-tions, etc.). Second, the actual number of aggressive inci-dents in this barroom was likely underestimated, as the measure depended on reports of aggressive behaviours and the bouncers’ ability to detect them. In addition, as the bouncers collected data while they were working, cer-tain issues could not be addressed and various variables could not be controlled for. However, the extended period under study along with the ethnographic methodology and the interviews with bouncers contribute to the rich-ness of the obtained findings. Finally, the bias of using bouncers to collect data also represents a limitation, as they may have failed to report some aggressive incidents committed or instigated by staff (Graham et al. 2005; Wells et al. 1998). Nevertheless, bouncers likely provided more insight than would have outside observers (Calvey 2000; Lister et al. 2000; Monahagan 2004; Hobbs et al. 2002; Hobbs 2003; Winlow et al. 2001).
Conclusion
The current findings enrich those of previous work (Boivin et al. 2014; Geoffrion et al. 2014; Graham et al. 2012) by pointing to the relevance of not only examining the environmental characteristics of the barroom, but also the role of the target of aggression. Crime opportunities follow routine activities (Cohen and Felson 1979), even within a specific location on a micro level (Geoffrion et al. 2014). Routine activity theory is thus relevant in this context, because as actors in differing roles follow differing routines, as do their patterns of victimization. Therefore, even within a micro level environment, prevention strategies should be adapted to individual role-specific routines instead of the aggregate of aggressive incidents through time and space, in order to adequately reduce the incidence of aggression.
Future studies examining barroom aggression should not only consider the environmental characteristics of the venue, but also the roles of different targets. As such, situational prevention strategies should be tailored for each of the targets of aggression in order to address their differ-ing routines and vulnerabilities. Such specific strategies can also be extrapolated to other violent environments, such as prisons, in order to understand the experiences of all actors and prevent their victimization in these spheres.
Competing Interest
The authors declare that they have no competing interests.
Author details
1School of psychoeducation, Université de Montréal, 90 Marie-Victorin, Montreal H2V 2S9, Canada.2School of criminology, Université de Montréal, 3150 Jean-Brillant, Montreal H3T 1N8, Canada.
Received: 15 January 2015 Accepted: 13 April 2015
References
Boivin, R, Geoffrion, S, Ouellet, F, & Felson, M. (2014). Nightly variation of disorder in a Canadian nightclub. Journal of Substance Use, 19(1–2), 188–193 Buka, SL, & Birdthistle, IJ. (1999). Long-term effects of a community-wide alcohol
server training intervention. Journal of Studies on Alcohol, 60, 27–36. Burrows, J, Anderson, S, Bamfield, J, Hopkins, M, & Ingram, D. (2001). Crime
against business in Scotland. Edinburg, Scotland: The Scottish Executive Central Research Unit.
Calvey, D. (2000). Getting on the door and staying there: A covert participant observational study of bouncers. In G Lee-Treweek & S Linkogle (Eds.), Danger in the field: Risk and ethics in social research (pp. 43–60). New York: Psychology Press.
Cohen, LE, & Felson, M. (1979). Social change and crime trends: A routine activity approach. American Sociological Review, 44(4), 588–608.
Geoffrion, S, Felson, M, Boivin, R, & Ouellet, F. (2014). Systematic observation of barroom incidents in a large Montreal venue. Security Journal.
doi:10.1057/sj.2014.47.
Graham, K, Bernards, S, Osgood, DW, Homel, R, & Purcell, J. (2005). Guardians and handlers: The role of bar staff in preventing and managing aggression. Addiction, 100(6), 755–766.
Graham, K, Bernards, S, Osgood, DW, & Wells, S. (2006). Bad nights or bad bars? Multi-level analysis of environmental predictors of aggression in late-night large-capacity bars and clubs. Addiction, 101, 1569–1580.
Graham, K, Bernards, S, Osgood, DW, & Wells, S. (2012).‘Hotspots’ for aggression in licensed drinking venues. Drug and Alcohol Review, 31, 377–384. Graham, K, & Homel, R. (2012). Raising the bar. New York: Willan.
Graham, K, La Rocque, L, Yetman, R, Ross, TJ, & Guistra, E. (1980). Aggression and barroom environments. Journal of Studies on Alcohol and Drugs, 41(3), 277. Graham, K, Osgood, DW, Zibrowski, E, Purcell, J, Gliksman, L, Leonard, K, et al. (2004).
The effect of the Safer Bars programme on physical aggression in bars: Results of a randomized controlled trial. Drugs & Alcohol Review, 23, 31–41. Gliksman, L, Single, E, McKenzie, D, Douglas, R, Brunet, S, & Moffat, K. (1993). The
role of alcohol providers in prevention: An evaluation of a server intervention programme. Addiction, 88, 1189–1197.
Hobbs, D (Ed.). (2003). Bouncers: Violence and governance in the night-time economy. New York: Oxford University Press.
Hobbs, D, Hadfield, PS, Lister, S, & Winlow, S. (2002).‘Dore Lore’: The art and economics of intimidation. British Journal of Criminology, 42(2), 352–370. Homel, R, Carvolth, R, Hauritz, M, McIlwain, G, & Teague, R. (2004). Making
licensed venues safer for patrons: what environmental factors should be the focus of interventions? Drug and Alcohol review, 23(1), 19–29.
Homel, R, Tomsen, S, & Thommeny, J. (1992). Public drinking and violence: Not just an alcohol problem. Journal of Drug Issues, 22(3), 679–697.
Homel, R, Hauritz, M, Wortley, R, McIlwain, G, & Carvolth, R. (1997). Preventing alcohol-related crime through community action: The surfers paradise safety action project. In R Homel (Ed.), Policing for prevention: Reducing crime, public intoxication and injury (pp. 35–90). Monsey, NY: Criminal Justice Press. Leonard, KE, Quigley, BM, & Collins, RL. (2002). Physical aggression in the lives of
young adults: Prevalence, location, and severity among college and community samples. Journal of Interpersonal Violence, 17, 533–550. Lister, S, Hobbs, D, Hall, S, & Winlow, S. (2000). Violence in the night-time;
bouncers: The reporting, recording and prosecution of assaults. Policing and Society: An International Journal, 10(4), 383–402.
Macintyre, S, & Homel, R. (1997). Danger on the dance floor: A study of interior design, crowding and aggression in nightclubs. In R Homel (Ed.), Policing for prevention: Reducing crime, public intoxication and injury (pp. 91–113). Monsey, NY: Criminal Justice Press.
Mastrofski, SD, Parks, RB, Reiss, AJ, Worden, RE, DeJong, C, Snipes, JB, et al. (1998). Systematic observation of public police: Applying flied research methods to policy issues. Washington, DC: National Institute of Justice.
Monahagan, LF. (2004). Doorwork and legal risk: Observations from an embodied ethnography. Social and Legal Studies, 13(4), 453–480.
Pernanen, K. (1991). Alcohol in human violence. New York: The Guilford Press. Quigley, BM, Leonard, KE, & Collins, RL. (2003). Characteristics of violent bars and
bar patrons. Journal of Studies on Alcohol, 64, 765–772.
Reiss, AJ. (1968). Stuff and nonsense about social surveys and observation. In H Becker, B Geer, D Riesman, and R Weiss (eds.), Institutions and the Person (pp. 351–367). Chicago: Aldine.
Reiss, AJ. (1971). Systematic observation of natural social phenomena. Sociological Methodology, 3, 3–33.
Roberts, JC. (2009). Bouncers and barroom aggression: A review of the research. Aggression and Violent Behavior, 14(1), 59–68.
Sherman, LW, Gartin, PR, & Buerger, ME. (1989). Hot spots of predatory crime: Routine activities and the criminology of place. Criminology, 27, 27–56. Stockwell, T. (2001). Responsible alcohol service: Lessons from evaluations of
server training and policing initiatives. Drug & Alcohol Review, 20, 257–265. Wells, S, Graham, K, & West, P. (1998).‘The good, the bad, and the ugly’:
Responses by security staff to aggressive incidents in public drinking settings. Journal of Drug Issues, 28, 817–836.
Winlow, S, Hobbs, D, Lister, S, & Hadfield, P. (2001). Get ready to duck: Bouncers and the realities of ethnographic research on violent groups. British Journal of Criminology, 41(3), 536–548.
Submit your manuscript to a
journal and benefi t from:
7 Convenient online submission 7 Rigorous peer review
7 Immediate publication on acceptance 7 Open access: articles freely available online 7 High visibility within the fi eld
7 Retaining the copyright to your article