Université de Sherbrooke
Régulation du rôle potentiellement oncogénique de p21Cip1/Waf1 par SOCS1 dans le foie
Par Mehdi Yeganeh Programme d’immunologie
Thèse présentée à la Faculté de médecine et des sciences de la santé en vue de l’obtention du grade de philosophiae doctor (Ph.D.) en immunologie
Sherbrooke, Québec, Canada Janvier 2015
Membres du jury d’évaluation :
Professeur Subburaj Ilangumaran, Programme d’immunologie Université de Sherbrooke
Professeure Sheela Ramanathan, Programme d’immunologie Université de Sherbrooke
Professeur Marek Rola-Pleszczynski, Programme d’immunologie Université de Sherbrooke
Professeur Claude Asselin, Programme de biologie cellulaire Université de Sherbrooke
Professeure Nathalie Grandvaux, département de biochimie et médecine moléculaire Université de Montréal
Résumé
Régulation du role potentiellement oncogénique de p21Cip1/Waf1 par SOCS1 dans le foie
Par Mehdi Yeganeh Programme d’immunologie
Thèse présentée à la Faculté de médecine et des sciences de la santé en vue de l’obtention du diplôme de philosophiae doctor (Ph.D.) en immunologie Faculté de médecine et des sciences de la santé, Université de Sherbrooke,
Sherbrooke, Québec, Canada, J1H 5N4
Le “Suppressor of cytokine signaling -1” (SOCS1) est une protéine de 24 kD qui fonctionne principalement comme un régulateur négatif des voies de signalisation intracellulaires. SOCS1 inhibe l’axe JAK-STAT et induit l’ubiquitylation et la dégradation de certaines protéines cibles. L’expression de SOCS1 est diminuée par l’hyperméthylation de son promoteur dans plus de 65% des cas de carcinome hépatocellulaire. Les souris déficientes en SOCS1 ne survivent que trois semaines après la naissance à cause d’une hyperinflammation induite par IFN-. Afin d’étudier le rôle anti tumoral de SOCS1 dans le foie, nous avons utilisé les souris Socs1-/-Ifng-/-, Ifng-/- et
les souris de type sauvage. Nous avons démontré que le taux de la régénération du foie après une hépatectomie partielle était augmenté chez les souris déficientes en SOCS1. De plus, les souris Socs1-/-Ifng-/- étaient plus susceptibles pour le
développement des nodules hépatiques suite à un traitement avec diethylnitrosamine (DEN). Par contre, les souris déficientes en IFN- ont démontré une résistance contre le cancer du foie. Néanmoins, au contraire de nos attentes préliminaires, nous n’avons pas observé une augmentation des taux sériques d’IL-6. Pourtant, la prolifération compensatoire et la synthèse de l’ADN étaient élevées chez les souris SOCS1 KO. Afin d’expliquer cette observation, nous avons étudié l’activation de p53. Nous n’avons pas trouvé une réponse differente de stabilisation ni de phosphorylation de p53 (Ser15) après traitement au cisplatin (in vitro) ou DEN (in vivo). Par contre, nous avons observé que l’expression du gène Cdkn1a était élevée chez les hépatocytes déficients en SOCS1. De plus, l’expression ectopique de SOCS1 pouvait supprimer l’expression de p21 chez les cellules HepG2 traitées au cisplatin. Nous avons aussi constaté que la stabilité de p21 était augmentée chez les hépatocytes primaires déficients en SOCS1. En effet, SOCS1 induisait l’ubiquitylation et la dégradation de p21. SOCS1 pouvait interagir avec p21 par son domaine SH2. De plus, SOCS1 pouvait contrôler la localisation cytoplasmique de p21 en régulant l’activité d’AKT. Bien que p21 soit connu comme un inhibiteur du cycle cellulaire, il peut également participer à l’assemblage des complexes CDK4-Cyclin D. Nous avons démontré que l’expression de p21 et des cyclines de type D était augmentée chez les souris déficientes en SOCS1 après l’hépatectomie partielle. En diminuant l’expression de p21 par shRNA, nous avons empêché la réponse proliférative des hépatocytes SOCS1 KO. Finalement, nous avons trouvé que l’expression élevée de p21 chez les hépatocytes déficients en SOCS1 rendait les cellules plus résistantes contre l’apoptose. En conclusion, nos résultats suggèrent que SOCS1 protège contre le cancer du foie par la régulation des activités oncogéniques de p21.
Mots clés : SOCS1, p21, cycle cellulaire, apoptose, ubiquitylation, cancer du foie, inflammation.
Summary
Regulation of the potentially oncogenic role of p21 by SOCS1 in the liver By Mehdi Yeganeh
Program of immunology
Thesis presented at the Faculty of medicine and health sciences for the obtention of Doctor degree diploma philosophiae doctor (Ph.D.) in immunology
Faculty of medicine and health sciences, University of Sherbrooke, Sherbrooke, Québec, Canada, J1H 5N4
Suppressor of cytokine signaling -1 (SOCS1) is an inducible 24 kD protein that principally acts as a negative regulator of different intracellular signaling pathways. SOCS1 exerts its regulatory feedback by blocking the JAK-STAT axis and inducing ubiquitylation and subsequent proteasomal degradation of target proteins. The gene coding for Socs1 has a CpG-rich promoter and can be methylated by methyltransferases. SOCS1 is silenced due to hypermethylation of its promoter in almost 65% of hepatocellular carcinoma cases. SOCS1 deficient mice cannot survive more than three weeks of age because of enhanced IFN- induced inflammation. To better understand the tumor suppressor role of SOCS1 in the liver we used Socs1-/-Ifng -
/-, while Ifng-/- and wild type mice served as controls. We found that SOCS1 deficient mice showed accelerated liver regeneration following standard partial hepatectomy (PH). Moreover, Socs1 null mice were susceptible to development of hepatic nodules after treatment with diethylnitrosamine (DEN). Interestingly, the IFN- deficient mice showed reduced number of liver tumors. In contrast to our preliminary expectations, we did not observe elevated IL-6 serum levels in SOCS1 deficient mice compared to the controls. Nevertheless, loss of SOCS1 was associated with increased compensatory proliferation and DNA synthesis after PH and DEN treatment. To find an explanation for the increased tumorigeneis in the SOCS1 deficient liver, we examined the activation of p53 and its target genes. Although we observed neither a variable phosphorylation (Ser15), nor an impaired stabilization of p53 after cisplatin (in vitro) or DEN treatment (in vivo), Cdkn1a expression was increased in the absence of SOCS1. We also found that ectopic expression of SOCS1 could suppress the mRNA levels of p21 in HepG2 cells treated with cisplatin. In addition, we found that loss of SOCS1 increased p21 stability in hepatocytes and that SOCS1 could induce p21 ubiquitylation and subsequent proteasomal degradation. We showed that SOCS1 could bind directly to p21 via its SH2 domain. Furthermore, in SOCS1 deficient hepatocytes, p21 was retained in the cytosol in an AKT dependent fashion. While classically known as a cell cycle inhibitor, p21 can promote the assembly and kinase activity of CDK4-cyclin D complexes. We showed that D-type cyclins and p21 levels were increased in the liver of SOCS1 deficient mice following PH. Suppression of p21 by transient shRNA transfection in SOCS1 deficient primary hepatocytes could reverse their increased proliferative response to mitogens. Finally, we found that increased p21 expression in SOCS1 deficient hepatocytes renders them resistant to apoptosis. In conclusion, our findings suggest that SOCS1 protects against liver cancer via inhibiting the oncogenic potential of p21.
Keywords:
SOCS1, p21, cell cycle, apoptosis, ubiquitylation, liver cancer, inflammation.Table of Contents:
Résumé ... ii
Summary ... iii
Table of Contents: ... iv
List of Tables ... vii
List of Figures... viii
List of Abbreviations ... xi
1. Chapter I: Introduction ... 1
1.1. Liver histology ... 3
1.2. Cellular origin of primary liver cancers ... 3
1.3. Epidemiology of hepatocellular carcinoma ... 5
1.4. Diagnosis of liver cancer ... 6
1.5. Management of liver cancer ... 7
1.6. Pathophysiology and risk factors of HCC ... 9
1.6.1. Inflammation and liver cancer ... 9
1.6.2. Alcohol and HCC ... 11
1.6.3. Hepatic viral infection and HCC ... 12
1.6.4. Metabolic syndrome and liver cancer ... 14
1.6.5. Alimentary toxins and liver cancer ... 15
1.6.6. Genetics and epigenetics of liver cancer ... 16
1.7. Suppressor of Cytokine Signaling family ... 19
1.7.1. Functional domains of SOCS proteins ... 19
1.7.2. Mechanisms of action of SOCS proteins ... 20
1.7.3. The role of SOCS proteins in human diseases ... 25
1.7.4. Loss of SOCS1 in cancer ... 31
1.8. The cell cycle ... 33
1.8.1. Regulation of the cell cycle ... 34
1.8.2. The CIP/KIP Family ... 36
1.8.2.1 Discovery of p21 ... 37
1.8.2.2. Functional domains and motifs of p21 ... 37
1.8.2.3. Regulation of CDKN1A transcription ... 38
1.8.2.4. Regulation of gene transcription by p21 ... 40
1.8.2.5. Post-transcriptional Regulation of p21 ... 41
1.8.2.6. Post-translational Regulation of p21 ... 42
1.8.2.6.1. Ubiquitylation of p21 ... 42
1.8.2.6.2. Phosphorylation of p21 ... 45
1.8.3. Cell cycle regulation by p21 ... 48
1.8.3.1. Regulation of S progression by p21 ... 48
1.8.3.2. Regulation of G1 progression by p21 ... 49
1.8.3.3. Regulation of G2/M progression by p21 ... 51
1.8.4. The status of p21 in human cancer ... 51
1.8.4.1. Low p21 expression in human cancers ... 52
1.8.4.2. High p21 expression in human cancers ... 52
1.9. The thesis outline ... 54
2. Chapter II: Materials and Methods ... 56
2.1. Mice ... 57
2.2. Partial hepatectomy ... 57
2.3. ALT / AST measurement and ELISA ... 58
2.4. Isolation of primary hepatocytes ... 58
2.5. Cell lines and plasmids ... 59
2.7. Lysate preparation, immunoprecipitation and western blot ... 60
2.8. GST-Pull down ... 61
2.9. Radiolabeled thymidine incorporation assay ... 62
2.10. Immunofluorescence microscopy ... 62
2.11. Immunohistochemistry ... 63
2.12. Evaluation of liver fibrosis ... 63
2.13. TUNEL staining of apoptotic cells ... 63
2.14. Quantitative PCR ... 64
2.15. Statistical Analysis ... 64
3. Chapter III: Anti-tumor role of SOCS1 in the liver is not related to its anti-inflammatory functions. ... 65
3.1. Introduction ... 66
3.2. Results ... 67
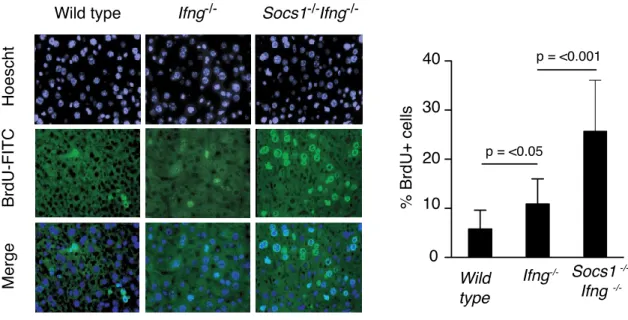
3.2.1. SOCS1 deficient mice show accelerated liver regeneration and DNA ... 67
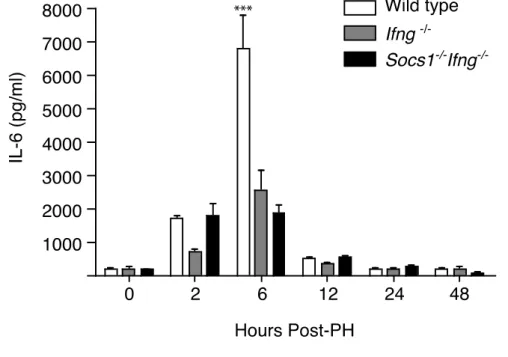
synthesis after partial hepatectomy. 3.2.2. Loss of SOCS1 in mouse is not associated with increased IL-6 availability or . 70 IL-6 signaling in hepatocytes. 3.2.3. SOCS1 deficiency enhances DEN-induced liver cancer. ... 73
3.2.4. Loss of SOCS1 does not increase serum IL-6 in response to DEN. ... 75
3.2.5. Loss of SOCS1 does not affect RelA/p65 phosphorylation and TNF- ... 78
signaling pathway in primary hepatocytes. 3.3. Conclusion ... 79
4. Chapter IV: SOCS1 regulates p21 Expression, stability and ... 80
sub-cellular localization. 4.1. Introduction ... 81
4.2. Results ... 82
4.2.1. Cisplatin treatment induces Socs1 mRNA in hepatocytes. ... 82
4.2.2. SOCS1 regulates genotoxic stress-induced p21 in hepatocytes. ... 83
4.2.3. SOCS1 regulates genotoxicity-induced p21 in the liver. ... 87
4.2.4. SOCS1 regulates p21 stability. ... 90
4.2.5. SOCS1 regulates p21 sub-cellular localization. ... 95
4.3. Conclusion ... 98
5. Chapter V: SOCS1 regulates the oncogenic activities of p21. ... 99
5.1. Introduction ... 100
5.2. Results ... 101
5.2.1. Loss of SOCS1 accelerates S phase entry in hepatocytes. ... 101
5.2.2. Loss of SOCS1 prevents apoptosis in hepatocytes. ... 106
5.3. Conclusion ... 111
6. Chapter VI: Discussion. ... 113
6.1. Introduction ... 114
6.2. SOCS1 regulates liver regeneration. ... 115
6.3. SOCS1 protects against liver cancer. ... 116
6.4. SOCS1 protects against liver fibrosis. ... 116
6.5. SOCS1 regulates p21 mRNA levels, protein stability and sub-cellular localization 117 6.5.1. SOCS1 regulates p21 mRNA levels. ... 117
6.5.2. SOCS1 promotes proteasomal degradation of p21. ... 119
6.5.3. SOCS1 prevents cytosolic localization of p21. ... 121
6.6. Paradoxical nature of p21 in HCC formation ... 121
6.6.1. p21 expression in human samples of HCC ... 122
6.6.2. Investigations on the role of p21 in cancer in murine models ... 123
6.6.3.1. The role of p21 in Alcohol-associated liver diseases ... 126
6.6.3.2.The role of p21 in viral hepatitis-associated HCC ... 126
6.6.3.3.The role of p21 in toxin-associated liver diseases ... 129
6.6.3.4. The role of p21 in liver fibrosis ... 129
6.7. The oncogenic roles of p21 ... 129
6.7.1. Paradoxical effects of p21 on cell cycle progression and DNA synthesis ... 129
6.7.2. Regulation of p21 anti-apoptotic effects by SOCS1 ... 131
6.7.2.1.The effects of p21 on chemotherapeutic treatments ... 133
6.7.3. p21 on cell migration and metastasis ... 134
6.8. Final remarks and outlook ... 136
Acknowledgments ... 139
List of Tables
Table 1.1. Different cell types in the liver ... 4 Table 1.2. Protein targets for SOCS family ... 25 Table 1.3. The list of currently known phospho-residues on human p21 ... 45 Sequence
List of Figures
Figure 1.1. Schema of liver regeneration chronology following ... 11
partial hepatectomy Figure 1.2. Functional domains of SOCS proteins ... 21
Figure 1.3. Negative regulation of JAK-STAT pathway by SOCS proteins ... 22
Figure 1.4. SOCS1 suppresses IFN- signaling pathway. ... 23
Figure 1.5. Schematic representation of Elongin-Cullin-Socs (ECS)-E3 ... 24
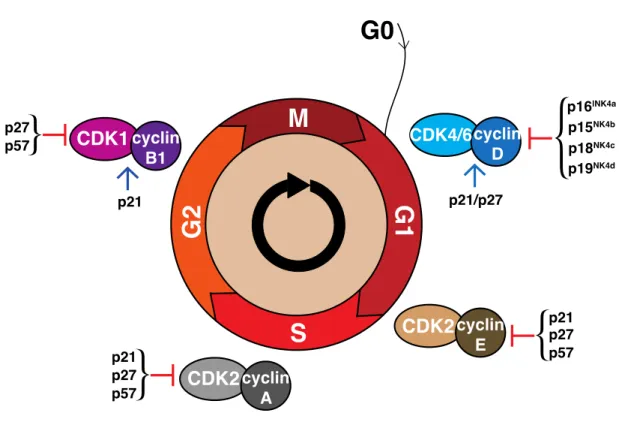
ubiquitin ligase Figure 1.6. The schematic representation of cell cycle ... 35
Figure 1.7. Structural domains and motifs of p21 ... 36
Figure 1.8. Schematic representation of p21 promoter response elements ... 39
Figure 2.1. Isolation of primary hepatocytes ... 59
Figure. 3.2.1.A: Expression of SOCS1 transcripts during liver ... 67
regeneration in mouse. Figure. 3.2.1.B: SOCS1 deficient mice show accelerated liver regeneration. ... 68
Figure. 3.2.1.C: SOCS1 deficient livers show increased DNA synthesis ... 69
post-partial hepatectomy Figure. 3.2.2.A: Serum IL-6 levels after partial hepatectomy ... 70
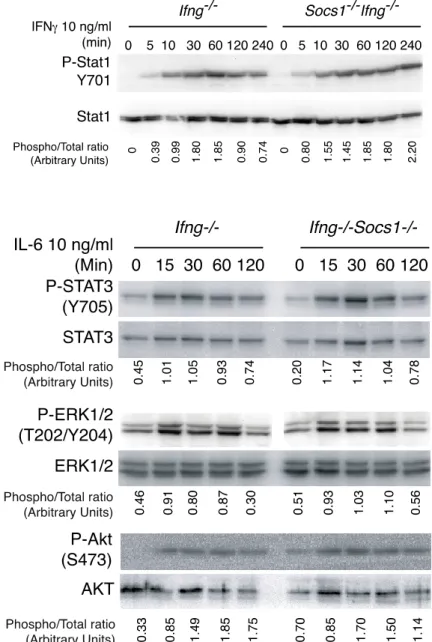
Figure. 3.2.2.B: Phosphorylation of STAT3 in the liver following ... 71
partial hepatectomy Figure. 3.2.2.C: SOCS3 expression is increased in the liver of ... 71
SOCS1 deficient mice. Figure. 3.2.2.D: SOCS1 does not regulate IL-6 signaling in mouse ... 72
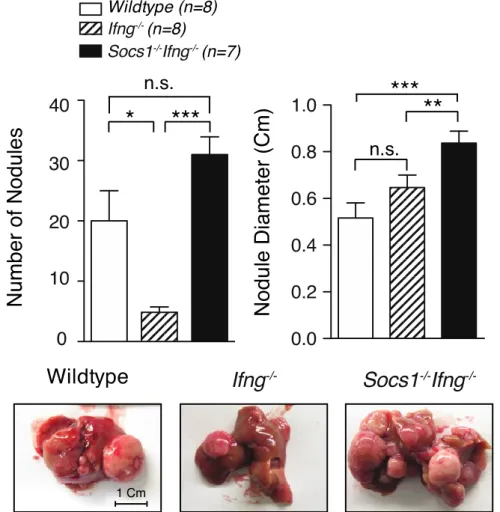
primary hepatocytes. Figure. 3.2.3.A: Loss of SOCS1 increases susceptibility to DEN-induced ... 73
liver tumors. Figure. 3.2.3.B: Loss of SOCS1 increases fibrotic changes of the liver. ... 74
Figure. 3.2.4.A: Loss of SOCS1 does not affect DEN induced IL-6 levels in serum. 75 Figure. 3.2.4.B: Loss of SOCS1 does not affect DEN induced STAT1 ... 76
and STAT3 phosphorylation. Figure. 3.2.4.C: SOCS1 deficient mice show increased compensatory ... 77
liver regeneration after liver injury. Figure. 3.2.5: SOCS1 does not regulate TNF- signaling pathway in mouse ... 78
primary hepatocytes. Figure 4.2.1. Cisplatin induces Socs1 mRNA in mouse primary hepatocytes ... 82
Figure 4.2.2.A Cisplatin induces higher levels of p21 in Socs1 null primary ... 83 hepatocytes.
Figure 4.2.2.B: Ionizing irradiation induces higher levels of p21 in ... 84
Socs1 null primary hepatocytes. Figure 4.2.2.C: Cisplatin-induced Cdkn1a mRNA expression is increased ... 85
in the absence of Socs1. Figure 4.2.2.D: Ectopic SOCS1 suppresses p21 expression in ... 86
cisplatin-treated HepG2 cells. Figure 4.2.2.E: SOCS1 suppresses Cdkn1a mRNA levels in cisplatin-treated ... 87
HepG2 cells. Figure 4.2.3.A: Loss of SOCS1 increases p21 levels in the ... 88
liver after DEN treatment. Figure 4.2.3.B: Basal level of p21 transcripts is decreased in ... 89
SOCS1 deficient mice. Figure 4.2.3.C: Loss of SOCS1 enhances genotoxicity-induced p21 ... 89
expression in the liver. Figure 4.2.4.A: Synchronized SOCS1 deficient primary hepatocytes show ... 90
increased p21 levels. Figure 4.2.4.B: SOCS1 suppresses p21 levels in a dose dependent manner. ... 91
Figure 4.2.4.C: Loss of SOCS1 increases the half-life of p21. ... 91
Figure 4.2.4.D: SOCS1 co-immunoprecipitates with p21 ... 92
Figure 4.2.4.E: SOCS1 requires SH2 domain for an efficient ... 93
interaction with p21. Figure 4.2.4.F: SOCS1 induces p21 ubiquitylation and proteasome degradation 94 Figure 4.2.4.G: Lys48 specific ubiquitin increases p21 polyubiquitylation. ... 95
Figure 4.2.5.A: Loss of SOCS1 is associated with cytoplasmic expression ... 96
of p21 in hepatocytes after DEN treatment. Figure 4.2.5.B: Loss of SOCS1 enhances cytosolic p21 in mouse hepatocytes. .... 97
Figure 4.2.5.C: SOCS1 suppressed p21 cytosolic shift via of AKT regulation. ... 97
Figure 5.2.1.A: Expression of p21 is increased in the liver of SOCS1 ... 102
deficient mice. Figure 5.2.1.B : Loss of SOCS1 increases Cdkn1a expression. ... 103
Figure 5.2.1.C: SOCS1 deficient hepatocytes show accelerated S phase entry. .. 104
Figure 5.2.1.D. Increased p21 levels in SOCS1 deficient hepatocytes ... 105
accelerate S phase entry. Figure 5.2.2.A: Freshly isolated SOCS1 deficient primary hepatocytes ... 106
show increased apoptosis. Figure 5.2.2.B: Synchronized SOCS1 deficient hepatocytes resist apoptosis. ... 107
hepatocytes.
Figure 5.2.2.D : SOCS1 protects against liver damage in mice. ... 109 Figure 5.2.2.E : Concanavalin-A induced liver damage is IFN- dependent. ... 111 Figure 6.5.1: Socs3 mRNA levels are increased in the liver of SOCS1 ... 119 deficient mice.
Figure 6.6.1: p21 expression is increased in HCC. ... 123 Figure 6.7.3.A: Regulation of RhoA–ROCK–LIMK–cofilin pathway by ... 135 CIP/KIP family.
List of abbreviations
ALD Alcohol-related liver disease
AFB1 Aflatoxin B1
A1AT Alpha-1 antitrypsin
AFP Alpha-fetoprotein
AASLD American Association for the Study of Liver Diseases ATCC American Type Culture Collection
BCLC Barcelona-Clinic Liver Cancer BFGF Basic fibroblast growth factor
BrdU Bromodeoxyuridine
C/EBP CCAAT/enhancer binding protein CIP CDK interacting protein
CDK Cyclin dependent protein kinases CKI Cyclin dependent kinase inhibitors
CISH Cytokine-induced SH2 domain containing protein
DEN Diethylnitrosamine
EGF Epidermal growth factor
ESS Extended SH2 Subdomain
FGF Fibroblast growth factor
FAO Food and Agricultural Organization FAH Fumarylacetoacetate hydrolase G-CSF Granulocyte colony stimulating factor
GM-CSF Granulocyte-macrophage colony stimulating factor
HFE Hemochromatosis gene
HBV Hepatitis B virus
HCV Hepatitis C virus
HCC Hepatocellular carcinoma
HGF Hepatocyte growth factor
HPLC High-performance liquid chromatography
HDAC Histone deacetylase
HMBS hydroxymethylbilane synthase
IARC International agency for research in cancer IRS Insulin receptor substrate
KIR Kinase inhibitor region
LR Liver regeneration
lLSEC Liver sinusoidal endothelia cells
LINE1 Long interspersed nucleotide elements 1 MESLD Model-for-end-stage-liver-disease
MEF Mouse embryonic fibroblast
MM Multiple myeloma
Mal MyD88-adapter-like
NAFLD Non-alcoholic fatty liver disease
NPC Non-parenchymal cells
NLS Nuclear localization signal
OTA Ochratoxin A
PAS Periodic acid-Schiff
PMA Phorbol ester
PI3K Phosphotidylinositol 3-kinase PDGF Platelet derived growth factor RAF Rapidly accelerated fibrosarcoma ROS Reactive oxygen species
RTK Receptor tyrosine kinases
Rb Retinoblastoma protein
IAP Retroviral intracesternal A particles
ROCK Rho-associated kinase
Rbx RING-finger-domain-only protein
STAT Signal transducer and activator of transcription SnoN Ski-related novel protein N
SMAD Small 'mothers against' decapentaplegic
SH2 Src Homology 2
SRS Substrate recognition subunits SOCS Suppressor of cytokine signaling
SHARP Sorafenib HCC Assessment Randomized Protocol SLE Systemic lupus erythematous
TBP TATA-box binding protein
TSL Thymic stromal lymphopoietin
TSH Thyroid stimulating hormone
TARE Transarterial radioembolization TACE Transarterial chemoembolization TGF- Transforming growth factor-alpha TGF- Transforming growth factor-beta
TNM Tumor-Node-Metastasis
TUNEL Terminal deoxynucleotidyl transferase dUTP nick end labeling VEGF Vascular endothelial growth factor
WAF1 Wild-type p53 activated-fragment 1
CHAPTER I
ancer is the outcome of altered cellular behavior due to impaired regulation of molecular pathways. The “neoplastic” cells often preserve constitutive mitogenic signaling, evade cell death, bypass suppressor mechanisms, overcome replicative senescence, spread and invade other organs via systemic circulation and promote angiogenesis (Hanahan and Weinberg, 2011). Understanding the regulatory machineries that prevent these fatal consequences of imbalanced cellular homeostasis would provide insight into the complex nature of carcinogenesis and would eventually help us develop novel therapeutic strategies.
The extensive worldwide research endeavors have led us to a better perspective of the intracellular events that might render a healthy cell neoplastic. As a result, there has been significant progress in diagnosis, treatment and even prevention for at least certain types of tumors (Kachuri et al., 2013). However, for certain other cancers, the progress has been limited and the outlook has not changed for a long time. Indeed, cancer is still a leading cause of death (Mathers et al., 2009). This unfortunate picture is partly due to the complexity of cell events and the multifactorial nature of molecular pathways. There are still many obscure corners in cancer research that are particularly challenging.
Liver cancer is one such malignancy for which a global consensus about the therapeutic approaches is still controversial and effective interventions are not available. Moreover, hepatologists are still desperately looking for some practical and early diagnosis tools for liver cancer (Chaiteerakij et al., 2013). The aim of the current research was to provide a better explanation for molecular predisposition to liver cancer. In this PhD thesis, I have investigated how a small adaptor protein called
Suppressor of Cytokine Signaling-1 (SOCS1), whose expression is suppressed in the
majority of liver cancer patients, regulates neoplastic transformation of liver cells, particularly hepatocytes. The findings presented in this thesis have important implications for development of better treatment methods for liver cancer.
1.1. Liver histology
The liver is the biggest gland in mammalians and plays a central role in diverse metabolic functions (Michalopoulos and DeFrances, 1997; Fausto et al., 2006). Liver is the main organ for producing many plasma proteins and carbohydrates, storage of minerals and vitamins and detoxifying toxins that enter portal vein circulation (Arias, 2009). The cells that constitute the liver can be classified into two main groups of epithelial cells and mesanchymal cells (Table 1.1). More than 90% of the liver parenchyma consists of hepatocytes (Papoulas and Theocharis, 2009). Cholangiocytes are epithelial cells that line the intra-hepatic and extra-hepatic biliary duct system. Moreover, cholangiocytes are responsible for modification of the bile produced by hepatocytes (O'Hara et al., 2013). Kupffer cells are the liver resident macrophages and play important roles in hepatic homeostasis and host defense (Naito et al., 2004). Hepatic stellate cells (HSC) are derived from bone marrow and serve as the origin of liver myofibroblasts, store retinoids and produce hepatocyte growth factor (HGF) (Friedman, 2008). Liver myofibroblasts are the main fibrogenic effector cells and are absent in the healthy liver. However, upon liver damage, they arise from hepatic stellate cells and portal mesenchymal cells to produce extracellular matrix and collagen (Lemoinne et al., 2013). Liver sinusoidal endothelial cells (LSEC) line the sinusoids and differ from the endothelium of big vessels in lacking basement membrane and containing the fenestrae structures (De Leeuw et al., 1990). Moreover, a subset of LSECs are derived from bone marrow and, in parallel with HSCs, function as a main source of HGF (DeLeve, 2013). Cancer can originate from all of these cell types, but hepatocellular carcinoma (HCC) is the most frequent type of liver cancer (El-Serag, 2012). Throughout this thesis, by “liver cancer” we refer to HCC unless specified otherwise.
1.2. Cellular origin of primary liver cancers
Even though mature hepatocytes are traditionally believed to be the origin of HCC, recent advances in our knowledge of liver regeneration has modified this view (Papoulas and Theocharis, 2009; Lo and Ng, 2013). The bone marrow derived stem cells and hepatocyte progenitor cells, especially when mature hepatocytes are not capable to proliferate efficiently, could differentiate into hepatocytes and participate
in liver regeneration, (Fausto, 2004). Both mature differentiated hepatocytes and progenitor cells could give rise to tumor. Notably, hepatocytes that are derived from progenitor cells are more susceptible to the oncogenic transformation (Papoulas and Theocharis, 2009).
Epithelial Cells
Hepatocytes Cholangiocytes
Hepatic progenitor cells
Intermediate Hepatocyte like cells
Mesenchymal cells
Kupffer sells
Hepatic stellate cells Myofibroblasts Endothelial cells Table 1.1. Different cell types in the liver
Liver cells can be classified into epithelial and mesenchymal cells.
As an example, hepatoblastoma, the most frequent pediatric liver tumor, contains both epithelial and mesenchymal components. The mesenchymal part of the tumor consists of teratotic tissues such as cartilage, bone, endocrine and neural structures (Kim et al., 2001). It is, therefore, believed that the precursor cells in hepatoblastoma are the pluripotent progenitor cells (Ruck and Xiao, 2002; Fiegel et al., 2004). Hepatocellular adenoma is a benign tumor of liver that is seen exclusively in women who have been taking estrogen contraceptives for a prolonged period (Rooks
et al., 1979). Nevertheless, hepatocyte progenitor cells are detectable in the dysplastic
foci of hepatocellular adenomas and are thought to be responsible for possible malignant transformations (Libbrecht et al., 2001).
In addition to progenitor cells, stem cells have also been studied as the origin of cancer in the liver (Ma et al., 2007). Recently, it has been suggested that the highly fatal cholangiocarcinoma could be derived from both stem cells and hepatic progenitor cells, but not mature cholangiocytes (Asayama et al., 2002; Kim et al., 2004). This notion is supported by the finding of mixed hepatocyte and biliary structures in some forms of primary liver tumors, suggesting a pluripotent origin (Steinberg et al., 1994;
Lee et al., 1997; Lo and Ng, 2013). In rodents, hepatocyte progenitor cells have been shown to participate in development of HCC (Tsao and Grisham, 1987; Sell, 2002).
Therefore, it has been proposed that HCC is the outcome of either perturbations of stem cell maturation or re-gaining the self-renewing capacity by the previously differentiated cells (Papoulas and Theocharis, 2009). In agreement with this theory, carcinomatous hepatocytes are known to express markers of progenitor cells (Libbrecht and Roskams, 2002; Durnez et al., 2006).
1.3. Epidemiology of hepatocellular carcinoma
HCC is the fifth most common cancer among men and seventh most common cancer among women (El-Serag, 2012). Sub-Saharan Africa and Eastern Asia are the HCC high-incidence regions (> 20 per 100,000) whereas Europe, America, and Oceania have lower numbers of affected patients. Nevertheless, the current trend of HCC incidence declines in the Far East while it is intriguingly increasing in the western world (El-Serag, 2012). The recent report of the Advisory Committee on Canadian Cancer Statistics shows that the five-year survival rate of liver cancer has improved from 8 to 20% between 1992 and 2007; however, both incidence and mortality rate of liver cancer has been increasing in Canada (Kachuri et al., 2013). The age-period-cohort analysis of liver cancer data from the Canadian Cancer Registry Database and the Canadian Vital Statistics Death Database has shown that the incidence of HCC has raised from 2.6 and 1.5 per 100 000 in 1972-74 to 6.5 and 2.2 per 100 000 in 2004-06 in men and women, respectively. Meanwhile, the mortality rate has increased from 3.3 and 2 per 100 000 in 1972-74 to 6 and 2.6 per 100 000 in 2004-06 among men and women, respectively (Jiang et al., 2011). This report has been independently confirmed by Statistics Canada (Ellison and Wilkins, 2012).
HCC is a growing cancer issue in other industrialized countries as well. A German registry has recently reported the HCC trends that are quite similar to the Canadian counterparts (Weinmann et al., 2013). In the United States, HCC statistics have shown similar trends (Zhu, 2013). The latest evaluations confirmed that the incidence rate of HCC in the United States has tripled between 1975 and 2005 (Altekruse et al., 2009; El-Serag, 2011) and, in contrast to many other cancers, HCC-related mortality is increasing (Jemal et al., 2009). Part of this rise in HCC incidence is due to HCV infection
that is highly associated with liver inflammation and cancer. Almost 30-50% of American patients with HCC are infected with HCV (Zhu, 2013). In Asia, however, HBV infection has a greater impact on HCC prevalence and HBV vaccination programs have been beneficial to prevent HCC in Asian populations (Chang et al., 1997). On the other hand, the increasing number of patients with metabolic syndromes and diabetes contributes to the increased rate of HCC incidence (Siegel and Zhu, 2009). Specially, individuals affected by obesity and type-2 diabetes have twice the risk for HCC compared to healthy populations (Calle et al., 2003; El-Serag, 2004; El-Serag et al., 2006). Finally, the immigrants from Asia and Africa also constitute a substantial fraction of HCC cases in North America (Zhu, 2013).
1.4. Diagnosis of liver cancer
Hepatocellular carcinoma, characteristically, has an indolent progression and many patients present at advanced and inoperable stages (Zhu, 2013). Therefore, several studies have suggested performing a cost-effective screening in high-risk populations in order to make a timely diagnosis. Early diagnosis of HCC is quite essential to choose the most appropriate treatment protocol. However, it still remains a clinical challenge for physicians (Bruix and Sherman, 2011; Page et al., 2014).
Although Serum Alpha-fetoprotein (AFP) level has been used as a biomarker for HCC, recent studies indicate that AFP lacks sufficient sensitivity and specificity to be considered as a powerful screening tool at the early stages of HCC (Singal et al., 2009; Lok et al., 2010; Bruix and Sherman, 2011). The new guideline of the American Association for the Study of Liver Diseases (AASLD) stresses on the repetitive use of ultrasound examination in 6-month intervals as a highly reliable method for surveillance of high-risk patients (Bruix and Sherman, 2011). The ultimate diagnosis of HCC is made by a dynamic contrast-enhanced liver imaging and biopsy (Bruix and Sherman, 2011). Pathologic diagnosis of HCC requires expertise to estimate the real grading of the tumor. Staining for glypican-3, heat shock protein-70 and glutamine synthetase is helpful and positivity for any two markers confirms the diagnosis of HCC (Neoplasia, 2009).
1.5. Management of liver cancer
The management strategy for HCC depends on the staging of the cancer (Page et
al., 2014). The classical tumor-node-metastasis (TMN) system is not as useful for liver
cancer as in other types of cancer (Pons et al., 2005). Therefore, many alternative staging systems have been developed (Yan and Yan, 2003; Pons et al., 2005), among which, the Barcelona-Clinic Liver Cancer (BCLC) system is widely accepted and utilized in management as well as in therapeutic trials (Forner et al., 2010).
The current therapies for HCC could be divided into three major categories: (i) curative, (ii) palliative and (iii), systemic therapies (Bruix and Sherman, 2011). The curative treatments include surgical resection and liver transplantation (Bruix and Sherman, 2011). These interventions are applicable to small solitary liver nodules. The perioperative mortality of HCC resection is high and only patients with a good health condition and at early stages might profit from surgery (Parikh et al., 2003; Asiyanbola
et al., 2008). Liver transplantation can be considered as the first choice of treatment in
well-selected patients and the five-year survival is 70% with less than 15% chance of recurrence (Mazzaferro et al., 1996). Adoptive immunotherapy has been used as a post-operative adjuvant therapy for HCC and several cohorts have been shown to benefit from this intervention with improved survival and decreased recurrence rate (Zhong et al., 2012). Transplantation is the only treatment that cures the underlying liver disease along with HCC and there is a tendency among liver surgeons to expand the selection criteria for candidate patients (DuBay et al., 2011; Page et al., 2014). However, a main restriction for liver transplantation is the shortage of liver donors (Zhu, 2013).
In advanced stages of HCC when liver transplantation or surgical resection is not helpful, locoregional ablation of tumors is the main choice of treatment. Tumor ablation may be carried out by using high energy sources (radiofrequency or microwave), percutaneous ethanol injection, transarterial radioembolization (TARE)/chemoembolization (TACE) and drug-eluting beads (Page et al., 2014). The trans-arterial interventions rely on the fact that the hepatic artery supplies the tumor and catheterization allows to directly deliver the chemotherapeutic agents (cisplatin, doxorubicin, mitomycin C) or the radioisotope (yttrium-90) to the tumor cells (Brown
et al., 2009; Sangro et al., 2012).
In end-stage HCC, local treatments or surgical resection might not be appropriate and systemic chemotherapy is indicated by employing cytotoxic agents as cisplatin, interferon-alpha, doxorubicin and 5-fluorouracil (Page et al., 2014). Despite some early promising reports, unluckily, the phase III trials did not show any improvement in the survival of patients treated with either solo or combined systemic cytotoxic regiments (Leung and Johnson, 2001; Yeo et al., 2005). Therefore, currently, no guideline approves the cytotoxic agents as a part of standard therapy, but only in clinical trials (Page et al., 2014). On the other hand, having a better understanding of the molecular basis of HCC, multiple kinase inhibitors have been introduced. Sorafenib, is a mutiple kinase inhibitor that switches off many signaling pathways recognized in the pathology of liver cancer, including RAF (rapidly accelerated fibrosarcoma) proto-oncogenes, vascular endothelial growth factor (VEGF) receptor, platelet derived growth factor (PDGF) receptor and c-Kit (Adnane et al., 2006; Wilhelm et al., 2006). Sorafenib has been shown to be beneficial in HCC patients in two different international phase III placebo-controlled trials. The Sorafenib HCC Assessment Randomized Protocol (SHARP) showed that Sorafenib improved the overall survival from 7.9 months (placebo group) to 10.7 months in more than 600 patients. Sorafenib also increased the progression-free time by up to 3 months (Llovet et al., 2008). Additionally, in another phase III trial in the Asia-Pacific region, Sorafenib improved the overall survival from 4.2 months in placebo group to 6.5 months in the trial group (Cheng et al., 2009). CALGB80802 is an ongoing phase III randomized trial to compare the benefits of systemic Sorafenib alone or in combination with doxorubicin in advanced HCC cases (Zhu, 2013); this trial follows an earlier phase II trial that had confirmed the survival improvement among patients under combination therapy with doxorubicin and Sorafenib compared to doxorubicin single therapy (Abou-Alfa et al., 2010). Due to the efficacy and manageable toxicity of Sorafenib, it is now considered as the first line treatment for HCC cases who cannot undergo other treatments (Bruix and Sherman, 2011).
1.6. Pathophysiology and risk factors of HCC
Liver cancer is distinguishable among all types of malignancies by having distinct and well-known environmental and molecular risk factors. A challenge in HCC treatment is its late clinical presentation (Zhu, 2013). The possibility of identifying high-risk populations using a sensitive and specific screening biomarker early in the course of HCC would be enormously valuable. The major risk factors of liver cancer include alcohol consumption, viral hepatitis, food toxins, metabolic syndrome and certain genetic defects. It is globally believed that most of these risk factors promote liver cancer through an inflammatory process. Here, I will first discuss the inflammatory basis of HCC and then review the main risk factors of liver cancer in more detail.
1.6.1. Inflammation and liver cancer
Several studies indicate that liver cancer is the outcome of chronic inflammatory responses within the liver towards hazardous environmental stimuli (Ramakrishna et
al., 2013). Moreover, other risk factors of HCC such as viral hepatitis and obesity also
promote inflammation in the liver. In a healthy liver, over 90% of hepatocytes are in quiescence and are not responsive to growth factors (Zimmermann, 2004). However, in response to pro-inflammatory cytokines, namely TNF- -6, hepatocytes are “primed” to enter the cell cycle (Fausto et al., 1995; Streetz et al., 2000; Wuestefeld et
al., 2003; Jia, 2011; Kuraishy et al., 2011). The main sources of inflammatory cytokines
in the liver are the non-parenchymal cells (NPC), including Kupffer cells and hepatic stellate cells. NPCs are activated by particles released from necrotic or apoptotic hepatocytes following liver damage, to produce and secrete inflammatory cytokines such as TNF- and IL-6 (Zimmermann, 2004). Priming by these inflammatory cytokines is the first step that enables undamaged hepatocytes to undergo cell division.
Partial hepatectomy (PH) is a powerful experimental tool to examine proliferation of hepatocytes in vivo by observing the regeneration rate of the liver following surgical removal of two-third of the hepatic mass in rodents (Higgins, 1931; Yokoyama et al., 1953). The magical regenerative capacity of the liver has been known since ancient times. In Greek mythology, Prometheus angered Zeus, the Father of Gods
and Men, for stealing fire and giving it to mankind as a gift. Punished by Zeus,
Prometheus was sentenced to be chained to a cliff where everyday an eagle came to rip out his liver and the remnants grew back overnight to be ripped again by the eagle the next day; luckily, he was unchained eventually by Heracles (Krishna and Hillman, 1970)! In reality, however, complete liver regeneration (LR) following hepatectomy takes almost a year in healthy human subjects (Chen et al., 1991). In mice, LR after a standard partial hepatectomy lasts seven to ten days (Yokoyama et al., 1953).
The physiological “compensatory proliferation” has evolved to restore the vital functions of lost parts of the liver. The importance of the inflammatory response for this regenerative process has been demonstrated in IL-6 deficient mice that suffer a massive liver necrosis after PH. LR can be, however, restored by administering a single dose of recombinant IL-6 prior to surgery (Cressman et al., 1996). The process of LR can be studied in three steps: (a) priming, (b) proliferation and (c) termination (Figure 1.1) (Zimmermann, 2004). As mentioned above, during the priming phase quiescent hepatocytes enter the G1 phase of the cell cycle and become responsive to growth factors. Most growth factors that promote liver regeneration belong to the family of Receptor Tyrosine Kinases (RTK). These growth factors include HGF, epidermal growth factor (EGF), transforming growth factor-alpha (TGF-), VEGF and fibroblast growth factor (FGF) (Jia, 2011). In fact, a minimal basal activity of EGF receptor (EGFR) is required to maintain the functions of the healthy liver at the steady state (Skarpen et
al., 2005; Natarajan et al., 2007). Loss of EGFR and c-Met (the EGF and HGF receptors)
is associated with impaired LR (Natarajan et al., 2007; Ishikawa et al., 2012; Thorgeirsson, 2012). Once the liver regains its initial mass and functionality, the process of regeneration is terminated. The mechanisms that sense liver restoration remain mysterious to hepatologists. However, it is believed that the major players for termination of LR are transforming growth factor-beta (TGF-) and activins (Zimmermann, 2004; Jia, 2011). The rats lacking TGF- receptor II show an extensive LR (Nakamura et al., 2000). Moreover, the expression of activin A and its receptor, follistatin, are decreased during the proliferation phase and come to normal levels only at 72 hours after PH (Date et al., 2000). On the other hand, Ski and Ski-related novel
protein N (SnoN) transcription repressors neutralize the TGF- signaling during DNA synthesis (Macias-Silva et al., 2002).
The inflammation-induced compensatory proliferation is a key event during early stages of HCC development (Teufelhofer et al., 2005; Naugler et al., 2007; Sakurai et
al., 2008; Park et al., 2010; Kuraishy et al., 2011). For example, it has been shown that
the gender disparity for HCC in male mice was due to a higher levels of IL-6 related to sex hormones and that IL-6 deficient mice were resistant to diethylnitrosamine (DEN)-induced HCC (Naugler et al., 2007). Similarly, tissue-specific deletion of IKK- or p38 in hepatocytes accelerated compensatory regeneration due to increased liver damage in response to DEN (Sakurai et al., 2008). The IL-1/IL-6 axis played a critical role and blockade of this axis led to reduced LR (Sakurai et al., 2008).
Figure 1.1. Schema of liver regeneration following partial hepatectomy
Early after partial hepatectomy (PH), inflammatory cytokines are induced (red curve) to prime the hepatocytes. The primed hepatocytes start proliferating under influence of growth factors (green curve). When the liver mass is sufficiently restored, the proliferation phase is suppressed via activation of TGF- (blue curve). The indicated time periods are relative of PH termination.
1.6.2. Alcohol and HCC
Alcohol ingestion is a known risk factor for liver damage (Cardin et al., 2002). Alcoholic hepatitis has some specific microscopic features such as intracellular hyaline inclusions (Mallory bodies), neutrophil infiltration, hepatocyte necrosis and fatty degeneration (Jensen and Gluud, 1994; Jensen and Gluud, 1994; de la et al., 2001). The pathologic consequence of excessive ethanol intake is mainly due to the oxidative
damage (Moriya et al., 2001). The oxidative stress is an outcome of the formation of CYP2E1 variant of cytochrome P450 by ethanol (Kessova and Cederbaum, 2003). CYP2E1 is a generator of effective reactive radicals. CYP2E1 also facilitates generation of acetaldehyde and lipid preoxidation (Kessova and Cederbaum, 2003). The co-incidence of alcoholism and HCV infection can synergistically increase the risk of HCC development (Cooksley, 1996; Moriya et al., 2001; Morgan et al., 2003). In mice, chronic ethanol ingestion causes fatty liver degeneration and cirrhosis, which are, at molecular scale, attributed to hypoxia, toxic metabolites, DNA acetaldehyde adducts and induction of CYP2E1 (de la et al., 2001; Niemela, 2001).
1.6.3. Hepatic viral infection and HCC
Chronic infection with hepatitis B virus (HBV) or hepatitis C virus (HCV) is associated with cirrhosis and fibrosis, preceding HCC development (Shlomai et al., 2014). Notably, the geographical distribution of HBV and HCV prevalence coincides with HCC incidence rates (Poorolajal et al., 2010; Mittal and El-Serag, 2013) and continuous surveillance for HCC is recommended in patients with viral hepatitis (Bruix and Sherman, 2011). However, our understanding of the underlying mechanisms that predisposes these patients to HCC is not lucid.
HBV is a DNA virus of Hepadnaviridae family and can be transmitted by blood products, sexual contact and pregnancy (Ganem and Varmus, 1987; Dandri and Locarnini, 2012). Young children and infant are more prone to development of chronic hepatitis compared to adults. Sodium taurocholate co-transporting polypeptide 1 (NTCP1), a bile acid pump, is a known receptor for HBV (Yan et al., 2012). HBV genome encodes surface proteins that make the envelope (env), polymerase (pol) with reverse transcriptase activity, X protein needed for viral replication and the core protein that constructs the neucleocapsid of the virus (Yan et al., 2012). In hepatocytes, the viral DNA translocates to the nucleus where it forms a covalently closed circular DNA (cccDNA) (Levrero et al., 2009). This step requires transcription factors that are abundant in hepatocytes.
HBV infection is associated with a 10 to 100-fold increase in HCC risk (Nguyen et
al., 2009). Global prevention of HBV infection led to reduced HCC incidence in Asia
damage or fibrosis (Shlomai et al., 2014). Currently, HBV infection is treated with recombinant IFN-2 or inhibitors of reverse transcriptase (Chang et al., 2010; Gordon
et al., 2013; Tujios and Lee, 2013). Some researchers suggest that HBV induced HCC is
dependent on an immune-mediated mechanism. The transgenic mice for HBV protein that were adoptively transferred with HBV specific cytotoxic T cells, developed HCC (Chisari, 1995). However, this finding is contradicted by the fact that in most HBV carriers the extent of liver damage and fibrosis is minimal. In human adults, cytotoxic T cells are capable to recognize the infected hepatocytes and eradicate them, leading to 95% of cure of acute HBV infection (Thimme et al., 2003). Indeed, 5% of patients with chronic HBV infection get cleared from HBV annually (Shlomai et al., 2014).
HCV is an RNA virus of Flaviviridae family (Houghton, 2009). HCV genome encodes a core protein, two envelope proteins and seven non-structural proteins (Washburn et al., 2011). HCV can be transmitted via unsafe sexual contact and contaminated blood-derived products (Perz et al., 2006). Strict quality control of blood products resulted in lower HCV-related incidence of HCC (Tanaka et al., 2008). HCV infection is chronic in 50 to 80% of cases with a high risk of liver fibrosis (Shlomai et al., 2014). HCV needs the liver specific micro RNA miR-122 for viral replication and clearance of miR-122 in HCV infected patients is associated with decreased viral load (Janssen et al., 2013). It is generally accepted that HCV-associated inflammation can significantly contribute to the devolvement of HCC (Luedde and Schwabe, 2011; Weber et al., 2011). However, eradication of HCV in advanced liver fibrosis is associated with decreased incidence of HCC, indicating that the inflammatory theory does not explain all the findings (Yu et al., 2006; Cardoso et al., 2010; Morgan et al., 2010). In agreement with this notion, studies on transgenic mice expressing HCV proteins have shown some direct effect of HCV on several intra-hypatocyte signalling pathways (Washburn et al., 2011). For example, viral proteins can directly induce NF-kB pathway and induce type I interferons and IL-6 (Yu et al., 2012). The core protein of HCV can localize to mitochondria and inhibit electron transfer, resulting in generation of reactive oxygen species (ROS) (Korenaga et al., 2005). Moreover, the non-structural 5B protein can induce proteasomal degradation of retinoblastoma protein (Rb) and accelerate S phase entry (for cell cycle concepts see below) (Munakata et al., 2005).
Furthermore, interaction of HCV proteins and p53 can protect against apoptosis (Deng
et al., 2006).
1.6.4. Metabolic syndrome and liver cancer
Metabolic syndrome consists of obesity, diabetes mellitus (DM) and insulin resistance, and can lead to HCC development (El-Serag et al., 2006; Wang et al., 2012). Specially, in western countries, where HBV and HCV infection is not endemic as in Asia, non-alcoholic fatty liver disease (NAFLD) has been implicated as an important risk factor for HCC (Calle et al., 2003). The oncogenic consequences of metabolic syndrome are attributed to insulin and insulin-like growth factor-1 (IGF-1) signaling and the obesity-related chronic inflammation status (Giovannucci et al., 2010). The increasing number of patients with metabolic syndrome, obesity and NAFLD in the United States has raised concerns about liver cancer outbreak as a potential complication (Charlton
et al., 2011; Welzel et al., 2011; Baffy et al., 2012). Accordingly, anti-diabetic
medications have been shown to have beneficial effects against cancer. Metformin, the most widely used medication for treatment of diabetes, provides anti-neoplastic effects through both insulin dependent and independent mechanisms (Gallagher and LeRoith, 2011). In fact, the rate of cancer incidence is considerably lower among diabetic patients on metformin (Decensi et al., 2010; Noto et al., 2012; Soranna et al., 2012). It is noteworthy that the odds for developing HCC is lower in diabetic patient who receive metformin (Hassan et al., 2010; Singh et al., 2013). Additionally, diabetic patients treated with thiazolidinediones, (pioglitazone and rosiglitazone) are less frequently affected by primary liver cancer. Interestingly, rosiglitazone, and not pioglitazone, could also protect against colorectal cancer (Chang et al., 2012). Contrarily, diabetic patients who receive insulinogenic medications like sulfonylureas are prone to development of cancer in general (Bowker et al., 2006; Chang et al., 2012) and HCC in particular (Hassan et al., 2010). Meanwhile, these reports should be interpreted carefully as there exists other studies showing no significant improvements for HCC risk in patients who receive anti-diabetic medicines (Singh et
al., 2013). The possible biases are the co-incidence of other risk factors for HCC.
Notably, the anti-HCC effects of metformin are more prominent among western populations rather than in Asians (Singh et al., 2013).
In mice, both dietary and genetic-based obesity was associated with increased risk to developing HCC. Liver carcinogeneis in obese mice was associated with increased hepatic inflammation through IL-6 and TNF- signaling pathways (Park et al., 2010).
1.6.5. Alimentary toxins and liver cancer
Aflatoxins are produced by Aspergillus flavus and Aspergillus parasiticus that can colonize various food products such as milk, nuts, oilseeds and maize (Strosnider et al., 2006). There are different types of aflatoxins and all of them have carcinogenic activity (Magnussen and Parsi, 2013). However, aflatoxin B1 is the most potent one and is classified as a group A carcinogen by the World Heath Organization (WHO) (Lopez et
al., 2002). The threat of aflatoxin intoxication could be accentuated by a recent report
of Reuters about aflatoxin contamination of corn grain in the United States in 2012 (Magnussen and Parsi, 2013). While chronic dietary exposure to aflatoxin is associated with cancer, acute intoxication of aflatoxin may also cause life endangering consequences (Magnussen and Parsi, 2013).
Aflatoxin has mutagenesis activity and aflatoxicosis has been shown to be associated with a 249G>T base substitution on Trp53 gene coding for the tumor suppressor protein p53 (Hsu et al., 1991; Soini et al., 1996). Moreover, aflatoxin has been shown to induce chromosomal aberrations and DNA damage (Moudgil et al., 2013). The coincidental exposure to aflatoxin and HBV can synergically increase the risk of HCC development by about 30 times (Groopman et al., 2008; Liu and Wu, 2010). Similarly, some reports suggest the synergic effect of HCV and aflatoxin on HCC pathogenesis (Kuang et al., 2005; Kirk et al., 2006; Wild and Montesano, 2009). Given the serious consequences of aflatoxins, many countries follow the strict regulatory programs developed by the WHO and Food and Agricultural Organization (FAO) (Williams et al., 2004). One important preventive measure is to provide information to the farmers for an appropriate handling of crops (Wild and Gong, 2010; Wu and Khlangwiset, 2010).
Ochratoxin A (OTA) is another mycotoxin and is classified as a group 2B carcinogen by the international agency for research in cancer (IARC), along with aflatoxin M1 (Matsuda et al., 2013). OTA could be found in cereals and coffee. OTA is
also known as a causative agent for nephritic disease (Bayman and Baker, 2006). Even though the role of OTA in HCC is not yet explored, some reports have shown that OTA can induce DNA damage in HepG2 human hepatoma cells (Ehrlich et al., 2002; Renzulli
et al., 2004). Traces of OTA can be detected in body fluids by high-performance liquid
chromatography (HPLC) and OTA measurement has been proposed to be employed as a biomarker for HCC (Matsuda et al., 2013).
1.6.6. Genetics and epigenetics of liver cancer
Genomic instability and chromosomal abnormalities, either genomic gain or loss, predispose to HCC (Buendia, 2002; Guichard et al., 2012; Ozen et al., 2013). Genomic aberrations might be an outcome of HBV genome integration into the host DNA (Brechot et al., 1980; Brechot et al., 2000). However, it has been suggested that HBV does not target specific regions on the host genome and even in the same tumor the viral DNA could be inserted in various genomic locations (Fujimoto et al., 2012).
In addition, some single gene mutations and polymorphisms could be associated with an increased risk of liver cancer. The four most frequent mutated genes include
Trp53, CTNNB1, AXIN1 and ARID1A (Bressac et al., 1990; Ozturk, 1999; Ozturk et al.,
2009). Meanwhile, scanning the whole genome has revealed mutations in more than 22 additional genes in human samples of HCC (Fujimoto et al., 2012; Guichard et al., 2012; Huang et al., 2012). Indeed, in the regions where environmental risk factors of HCC are not frequently seen, the inborn genetic defects might extensively contribute to the HCC incidence rate (Hemminki and Li, 2003). For instance, allelic variations of
SERPINA1, the gene coding for Alpha-1 antitrypsin (A1AT), could increase the chance of
HCC development (Teckman, 2013). A1AT is a glycoprotein, mainly produced in the liver and released in serum in order to protect against the nonspecific effects of the endogenous proteases produced during inflammatory conditions (Rudnick et al., 2004; Nelson et al., 2011). SERPINA1 has been shown to have over 100 different variants; however, the Z mutant allele (known as PIZZ) is the most frequent variant and is responsible for the A1AT-related liver disease (Qu et al., 1997). Periodic acid-Schiff (PAS) and diastase digestion staining can reveal the aggregation of the Z variant A1AT in hepatocytes (An et al., 2005). Homozygote PIZZ patients often suffer lung emphysema and liver damage (Eriksson, 1990). The resulting chronic liver damage and
inflammation could lead to cirrhosis and HCC (Perlmutter, 2004; Lindblad et al., 2007; Teckman, 2013). Other genetic diseases that may cause liver cancer include glycogen storage disease type I (Von Gierke’s disease) due to mutation of the gene encoding glucose-6-phosphatase (Bianchi, 1993; Janecke et al., 2001; Franco et al., 2005), hemochromatosis due to mutations of the hemochromatosis gene (HFE) (Elmberg et
al., 2003; Haddow et al., 2003; Pietrangelo, 2004; Alexander and Kowdley, 2009),
porphyria due to mutations of hydroxymethylbilane synthase (HMBS) gene (Ostrowski
et al., 1983; Andant et al., 2000; Seth et al., 2007; Ulbrichova et al., 2009), and
Hereditary tyrosinemia type I due to defects in the gene encoding fumarylacetoacetate hydrolase (FAH) (Weinberg et al., 1976; Scott, 2006).
Epigenetic aberrations including DNA methylation, histone modifications and non-coding RNAs have also been linked to HCC (Pogribny and Rusyn, 2012). Hypomethylation or hypermethylation of cytosine bases of oncogenes or tumor suppressor genes can increase or decrease their expression, respectively (Pogribny and Beland, 2009; Sceusi et al., 2011). Genome wide studies in HCC samples have shown that hypomethylation affects primarily the normally methylated repetitive DNA sequences, like long interspersed nucleotide elements 1 (LINE1), retroviral intracesternal A particles (IAPs) and Alu elements (Takai et al., 2000; Tangkijvanich et
al., 2007; Kim et al., 2009; Lee et al., 2009). Moreover, hypomethylation of several
oncogenes have been identified in HCC including uPA, TFF3, MAT2A, HKII, CD147, VIM,
HPA and SNCG (Yang et al., 2001; Goel et al., 2003; Xiao et al., 2003; Chan et al., 2004;
Okada et al., 2005; Zhao et al., 2006; Kitamura et al., 2011; Kong et al., 2011). In contrast, inactivation of various genes due to aberrant methylation of the CpG islands of their promoters could also increase the HCC risk. Some of the genes affected by hypermethylation in HCC include RASSF1A, RB1, SYC, GSTP1, NQO1, NORE1B, RIZ1, RELN, PAX5, FBLN1, p16INK4A, p15INK4B and SOCS3 (Roncalli et al., 2002; Zhong et al.,
2002; Edamoto et al., 2003; Schagdarsurengin et al., 2003; Li et al., 2004; Niwa et al., 2005; Tada et al., 2005; Macheiner et al., 2006; Yuan et al., 2006; Harder et al., 2008; Zhang et al., 2010; Kanda et al., 2011; Liu et al., 2011; Okamura et al., 2011).
Using restriction landmark genome scanning analysis of DNA from HCC biopsies, it was shown that a distinct region on chromosome 16 was aberrantly methylated in
almost 88% of the cases (Nagai et al., 1994; Yoshikawa et al., 1997). Later, the gene coding for suppressor of cytokine signaling-1 (SOCS1) was localized within this chromosomal region and transcriptional repression of SOCS1 as a result of its promoter methylation was observed in up to 65% of human primary HCC samples (Yoshikawa et al., 2001; Okochi et al., 2003; Miyoshi et al., 2004).
The high frequency of SOCS1 silencing in HCC has encouraged many scientists to investigate the pathological consequences of SOCS1 deficiency in the liver. However, as we will see, SOCS1 has a broad range of functions and in spite of the recent progresses, we do not have yet a comprehensive explanation for its ‘putative’ anti-tumor function in the liver. The current research is an effort to better understand how SOCS1 might suppress tumor formation in hepatocytes. We will first review SOCS proteins, their mechanisms of action and their implications in human diseases and cancer.
1.7. Suppressor of Cytokine Signaling family
The family of suppressor of cytokine signaling (SOCS) consists of eight proteins that were first discovered as the negative regulators of JAK-STAT signaling pathway (Yoshimura et al., 1995; Endo et al., 1997; Masuhara et al., 1997; Matsumoto et al., 1997; Minamoto et al., 1997; Naka et al., 1997; Starr et al., 1997). SOCS proteins are relatively small proteins of 20 to 50 kD (Figure 1.2) and display tissue-specific expression pattern (Trengove and Ward, 2013). For instance, SOCS1 is mostly expressed in thymus, spleen, intestine and peripheral blood lymphocytes; SOCS2 is mainly expressed in heart, placenta, lung, kidney and prostate; and for SOCS3 the highest expression levels have been reported in heart, placenta, lung, skeletal muscle and peripheral blood lymphocytes (Aman and Leonard, 1997). Moreover, despite some redundancies, as we will specify shortly, members of SOCS family regulate specific intracellular signaling pathways. Therefore, regardless of several similarities among them, SOCS proteins have context-dependent and specific functions. Another major characteristic of SOCS proteins is their inducibility by cytokines and growth factors and their minimal basal expression at the steady state levels (Starr et al., 1997; Starr and Hilton, 1998). We will first review the structural and functional aspects of SOCS proteins and then discuss their role in the regulation of various signaling pathways and receptors.
1.7.1. Functional domains of SOCS proteins
SOCS proteins share two distinct domains namely, a Src Homology 2 (SH2) domain and the SOCS-box domain that confer their molecular characteristics (Figure 1.2) (Tamiya et al., 2005). The N-terminal region varies among members of SOCS family and does not contain any recognizable domains. SOCS6 and SOCS7, however, require their N-terminal sequence for nuclear localization (Matuoka et al., 1997; Hwang et al., 2007).
The 40-amino acid C-terminal SOCS-Box domain is a conserved sequence that can be found in over 70 proteins in human and is essential for binding to the adaptor proteins Elongin B and Elongin C (Piessevaux et al., 2008). This domain enables SOCS proteins (as well as other SOCS-box harbouring proteins) to participate in a protein complex, working together as an E3 ubiquitin ligase (see below) (Tamiya et al., 2005).
It is noteworthy that SOCS-box is also involved in proteasomal degradation of SOCS proteins themselves (Kamura et al., 1998; Zhang et al., 1999; Chen et al., 2002). The adaptor function for the SOCS-box domain depends on phosphorylation of its tyrosine residues (Piessevaux et al., 2008). Meanwhile, SOCS-box may also occasionally contribute to substrate recognition (see below) (Piessevaux et al., 2008).
The SH2 domain is important for the substrate specificity of SOCS proteins (Machida and Mayer, 2005). An SH2 domain is ~100 amino acids long and contains two α helices and seven anti-parallel β-sheets in a “βαβββββαβ” order (Kuriyan and Cowburn, 1997). The SH2 domain can recognize p-tyrosine residues via a p-tyrosine pocket and a “specificity determining region” that binds on the C-terminal side of the p-tyrosine. Replacement of a conserved Arginine within the FLVRES in the p-tyr binding pocket would disrupt the binding of SOCS proteins to phospho-tyrosine residues (Mayer et al., 1992). However, phosphorylation-independent binding to Tyr residue can also occur as in the case of SOCS1 binding to Vav (De Sepulveda et al., 2000). SOCS1 and SOCS3 have the highest homology (Trengove and Ward, 2013) and both have two 12-amino acid-long sequences adjacent to the SH2 domain, namely the Extended SH2 Subdomain (ESS) and the Kinase Inhibitor Region (KIR) (Machida and Mayer, 2005). The ESS (68 aa to 79 aa in SOCS1) is required for the association with JAK2 activation loop (Giordanetto and Kroemer, 2003). The KIR domain (56 aa to 67 aa in SOCS1) enables SOCS1/3 to act as a pseudosubstrate for JAK2 (Nicholson et al., 1999; Yasukawa et al., 1999). Nuclear translocation of SOCS1 may be needed for exerting its maximal inhibitory functions (Koelsche et al., 2009). Indeed, a bipartite nuclear localization signal (NLS) domain has been identified between the SH2 and SOCS-Box domains, encompassing 159 aa to 172 aa of SOCS1 sequence (Baetz et al., 2008; Koelsche et al., 2009). Engineered exogenous Cytokine-inducible SH2-containing protein (CISH) with an inserted SOCS1-NLS sequence, gains the ability of nuclear translocation (Baetz et al., 2008).
1.7.2. Mechanisms of Action of SOCS proteins
The members of Janus Kinases (JAK) family, JAK1/2/3 and TYK2, contain a catalytic domain and a kinase-like domain implicated in auto-regulation. This is why they are named after the two-faced Roman god, Janus (Harrison, 2012). The cytokine
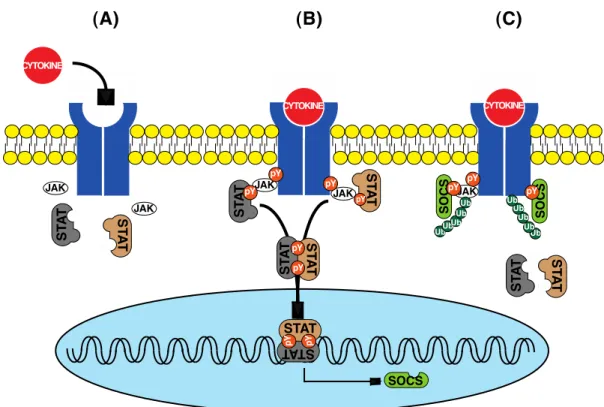
and growth factors receptors that do not have an intrinsic kinase activity require the recruitment of the JAK tyrosine kinases for a full activation (Linnekin et al., 1997). The recruited JAKs trans-phosphorylate each other and gain the ability to phosphorylate the downstream signaling molecules including the Signal Transducer and Activator of Transcription (STAT) proteins (Harrison, 2012). The phospho-tyr residues on the cytoplasmic side of receptors serve as the docking sites to the SH2 domain of STATs. The STAT family has seven members. Once phosphorylated, STATs dimerize and translocate into the nucleus to induce the transcription of their target genes including SOCS proteins (Harrison, 2012). In fact, SOCS proteins are minimally expressed at the steady state level.
Figure 1.2. Functional domains of SOCS proteins.
All the SOCS proteins share the SH2 and box domains. Note that SH2 and SOCS-box domains may overlap (light purple). SOCS1 and SOCS3 contain a kinase inhibitory region (KIR) and an extended SH2 subdomain (ESS). The N-terminal length is variable in different SOCS members. SOCS-box contains an Elongin C binding region (BC, shown only for SOCS1) and a region for binding to Cullin5 (not shown). The numbers indicate the first amino acid of each domain/region. The sizes are relative to the real lengths of SOCS proteins.