About the vacuum UV photoabsorption spectrum of methyl fluoride
(CH
3F): the fine structure and its vibrational analysis
R. Locht a, B. Leyh a,1, A. Hoxha a, D. Dehareng b, H.W. Jochims c, H. Baumgärtelc
a
Département de Chimie Générale et de Chimie Physique, Institut de Chimie Bât. B6c, Université de Liège, Sart-Tilman par B-4000 Liège 1, Belgium
b
Centre d'Ingéniérie des Protéines, Institut de Chimie, Bât. B6a, Université de Liège, Sart-Tilman par B-4000 Liège 1, Belgium
c
Institut für Physikalische und Theoretische Chemie, Freie Universität Berlin, Takustraβe 3, D-14195 Berlin, Germany
Abstract
The vacuum UV photoabsorption spectrum of CH3F has been recorded between 7 and 24 eV and has
been analyzed in detail. Broad and structureless peaks are observed over the entire photon energy range. They are all assigned to transitions to Rydberg states, members of series converging successively to the 2e-1, 5a-1 and 1e-1 ionization limits. These features are underlying very long series of narrow and weak structures in the range of 10-13.2 eV. Through a continuum subtraction procedure, about 70 lines could clearly be identified. These have been assigned to long vibrational progressions belonging to Rydberg states corresponding to the 2e → 3p and 2e → 6s/5d configurations. These states are split by a Jahn-Teller distortion. Ab initio calculations lead to a Jahn-Teller stabilization energy of about 0.84 eV. The main features observed in the two bands are assigned to one single long vibrational progression of hcω ~ 0.160 eV (1 290 cm-1) related to the C-F Jahn-Teller inactive stretching vibration. The remaining structure is assigned to the low excitation of the Jahn-Teller active vibrational modes, i.e. the bending modes v5 and v6 characterized by hcω5 ~ 0.120 eV (970 cm
-1
) and hcω6 ~ 0.082 eV (660 cm-1). Leaning on the present results and assignments previously reported photoelectron
spectroscopic data on CH3F +
[L. Karlsson, R. Jadrny, L. Mattsson, F.T. Chau, K. Siegbahn, Phys. Scripta 16 (1977) 225] have been reconsidered and reinterpreted.
1. INTRODUCTION
To get a deeper insight into the various aspects of the ionization and the monomolecular dissociation dynamics of molecular ions, we extensively investigate the photoabsorption spectrum, the He(I) and the threshold photoelectron (TPES) spectra, the constant ion state (CIS) spectra and the fragment ions translational energy release spectra in several types of molecules. Keeping this aim in mind, molecular systems e.g. ethylene and its various halogenated derivatives [1-5] and monohalogenated methanes [6] are being or have been investigated. Several of these studies [5, 7-9] showed the major importance of the localization and identification of neutral molecular states embedded in the ionization continua. In some cases, these states were shown to play a crucial role in the dissociation dynamics [6, 7, 10].
Though the halogen polysubstituted derivatives of methane have been thoroughly studied in the recent past by many groups [11-15]2 using most of the available spectroscopic techniques, the monosubstituted species received much less attention. Among the methyl monohalides, surprisingly the least investigated is the monofluorinated member CH3F. Its photoabsorption spectrum has been reported a few times, as studied under
different conditions.
1
Chercheur Qualifié FNRS (Belgium). 2
First, Stokes and Duncan [16] photographed the photoabsorption spectrum of CH3F in the vacuum UV
region by using a He discharge source. The observed electronic transitions were classified in Rydberg series converging to the first two ionization limits, i.e. at 103 240 cm-1 (12.80 eV) and 123 200 cm-1 (15.27 eV). These authors observed a fine structure which they assigned to one vibrational progression. Edwards and Raymonda [17] examined the photoabsorption spectra of the fluoromethanes as excited by a Lyman line source. They only mentioned a vibrational structure without any further analysis. Sauvageau et al. [18] repeated this work using the Hopfield continuum and measured the molecular extinction coefficient ελ for the four fluoromethanes
(CHnF4-n with n = 0-3). These authors also reported on the observation of a short vibrational progression, without
further analysis. However, they mentioned a wave number of 400 cm-1 (0.050 eV) at about 10.6 eV and of 1000 cm-1 (0.124 eV) at about 11.2 eV. The publication of Wu et al. [19] is the only work, to our knowledge, extending the observation of the CH3F photoabsorption to higher photon energies, i.e. above 11.8 eV (the LiF
window limit), using synchrotron radiation. They measured the photoabsorption cross-section and analyzed the spectrum between 175 and 760 Å (16.3-70.8 eV).
Though usually less resolved in this energy range, the electron energy loss spectra are very useful for the study of molecular structure. Themost recent work on CH3F using this technique has been reported by Olney
et al. [20]. They measured the photoabsorption oscillator strength between 7 and 250 eV. In a high resolution dipole (e,e) measurement in the range of 7.5-50 eV electron energy, they were able to resolve an extended fine structure but no further analysis was proposed.
We analyzed the photoabsorption spectrum of CH3F in an earlier report [6] with the aim to search for
the possible existence of superexcited states at 16.8 and 21.2 eV participating in the production of CH3+ fragment
ions. No analysis of the low energy part of the spectrum was presented. The main goal of this paper is to report on a detailed reexamination of the photoabsorption spectrum recorded under improved conditions, as well as on an assignment of the extensive fine structure observed between 10 and 13 eV photon energy, based on new ab initio calculations.
2. EXPERIMENTAL 2.1. Experimental setup
The experimental setup used in this work will be described briefly. Synchrotron radiation available from the BESSY I facility (Berlin, Germany) is dispersed with a vacuum UV monochromator (beamline lm-NIM-2). This monochromator is a modified M-225 McPherson, with a focal length of 1.5 m (instead of 1 m in the commercial version). A laminar Zeiss grating is used for the efficient second spectral order reduction; it is gold coated with 1200 ℓ/mm. The width of the entrance and the exit slits of 100 µm provides a 0.1 nm wavelength resolution. The light passes through a 1 mm thick stainless steel microchannel plate to ensure a differential pressure of 1:1000 before entering a 30 cm long stainless steel absorption cell. The vapor pressure in this cell is measured by a Balzers capacitor manometer (1 mbar full range). The light is detected by a sodium salicylate sensitized photo-multiplier fixed at the end of the absorption cell opposite to the light entrance slit. Output pulses are recorded by a 100 MHz counter. The recording of an absorption spectrum requires one scan with gas in the absorption cell and one with an empty cell. The stability of the synchrotron radiation and of the pressure in the cell allowed us to ensure reliable absorption data. The spectra presented in the following sections are corrected for any pressure drift. The commercially available CH3F, purchased from Matheson Company Inc.,
is used without further purification. 2.2. Data handling and error estimation
As will be noticed in the next section, most of the weak fine structures observed in these spectra is superimposed on fairly intense broad absorption peaks. A way to facilitate the detailed analysis of this structured part of the spectrum consists in a continuum subtraction. This procedure has already been successfully used earlier [21]. For this purpose, the experimental curve is severely smoothed to simulate the underlying continuum, which is subtracted from the original photoabsorption spectrum. The smoothing procedure consists in filtering the experimental curve by fast Fourier transform. The weak fine structure emerges as a series of sharp and strong peaks superimposed on a remaining very weak and slowly varying background. This procedure has been applied separately to the seven spectra recorded in this experiment under different pressure, resolution and recording conditions. Each structure mentioned in this work is present in all seven data sets. The energy position of the structures are averaged values over these seven independent measurements. The error, mentioned separately for
each level, is given by one standard deviation.
3. EXPERIMENTAL RESULTS
The photoabsorption curve of CH3F has been measured over the photon energy range of 7-30 eV.
Owing to its transmission curve, the cutoff limit of the grating used in this experiment lies at about 26 eV. Only the photon energy range of 7-24 eV will be discussed in this work. This photoabsorption spectrum is reproduced in Fig. 1 where the molar extinction coefficient єhv is given as a function of the photon energy (eV). A crude
comparison with the data reported by Edwards and Raymonda [17] shows a fairly good agreement with the present measurement on єhv. These are somewhat underestimated with respect to the work of Sauvageau et al.
[18]. In a more critical review, Olney et al. [20] made a quantitative comparison of photoabsorption cross-sections and oscillator strength over the 7-50 eV photon energy range. They showed that the values reported in the latter work [18] provide photoabsorption oscillator strength about 20%, too high at 14 eV as compared to the absolute values measured by high resolution dipole (e,e) measurements [20]. At 9.5 and 11.5 eV, this quantity lies between those deduced from the photoabsorption data [17,18].
Fig. 1. Vacuum UV photoabsorption spectrum of CH3F measured between 7.5 and 24.0 eV photon energy. The
intensity is plotted in terms of molar extinction εhv in ℓ (mol cm)-1.
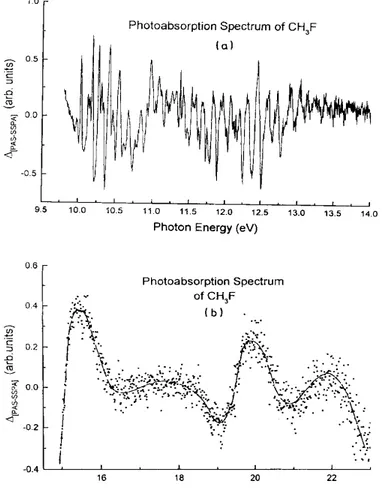
As clearly observed in Fig. 1, in the photon energy range of 9.5-14 eV, a weak but very well-defined fine structure is superimposed on intense broad peaks. On the other hand, at high energy (i.e. 15-24 eV), several weak and diffuse peaks are detected, superimposed on a strong continuum.
In order to analyze these features and to measure their energy level (wave numbers) as precisely as possible, we applied the procedure described in Section 2.2 to both energy ranges. The result is shown in Fig. 2(a) and (b), where the quantity ∆ defined below is plotted as a function of the photon energy. This quantity ∆ stands for the point-to-point difference between the original photoabsorption spectrum (PAS) and the strongly smoothed curve (SSPA) resulting from fast Fourier transform. Owing to the scattering of the signal in Fig. 2(b), a smoothed curve is drawn through the points.
The position in energy of the most salient features as defined by their maximum are listed in Table 1 together with the results of previous measurements.
The energy positions of the features observed in the first part of the fine structured photon energy range of 10.03-10.78 eV are listed in Table 5, together with previous measurements [16,23] mentioned here for comparison. Though being a photoelectron spectroscopic work, reference is made to the paper of Karlsson et al. [23] because these authors based their vibrational structure assignment in the first photoelectron band on the photoabsorption data of Stokes and Duncan [16]. The numbers listed in the last two columns of Table 5 will be discussed in the next section.
The remaining part of the fine structure observed in the photon energy range of 10.850-13.257 eV is gathered in Table 6. The first column contains few observations made in the first band of the He(I) photoelectron spectrum as reported by Karlsson et al. [23].
Fig. 2. Fine structured part of the photoabsorption spectrum of CH3F: (a) photon energy range of 9.7-14.0 eV
and (b) photon energy range of 15.0-23.0 eV. See text for data handling procedure.
4. DISCUSSION
For the sake of clarity in the following discussion of the experimental results, the molecular orbital configuration of CH3F in the C3v group of symmetry has to be kept in mind i.e.
(1a1) 2 (2a1) 2 (3a1) 2 (4a1) 2 (1e)4(5a1) 2 (2e)4 : X~1A1
where the two first orbitals, i.e. 1a1 and 2a1 are the two inner-shell orbitals having essentially F(1s) and C(1s)
character, respectively. The 3a1 and 4a1 orbitals correspond to the inner-valence orbitals, whereas the le, 5a1 and
2e orbitals correspond to the outer-valence orbitals. The He(I) [23] and He(II) [24] photoelectron spectra provide the vertical ionization energies at 13.04 eV corresponding to (2e)-1, at 17.2 eV assigned to (5a1/1e)
-1
and at 23.5 eV corresponding to (4a1)
-1
. These three energies are the possible convergence limits of the Rydberg series observed in the photoabsorption spectrum measured in the 7.0-24.0 eV photon energy range.
4.1. The main features
As shown in Fig. 1, the main features are broad bands for which only maxima can be determined. Their positions are listed in Table 1. Except for the data published by Wu et al. [19], who measured the photoabsorption of CH3F above 16 eV only, all the measurements agree fairly well with each other. The electron
energy loss spectroscopic work of Harshbarger et al. [22] is consistent with the photoabsorption data.
The first peak observed at 9.37 eV, assigned to a 2e → 3s Rydberg transition with a term value of 3.64 eV and an effective quantum number n* = 1.925, shows a shoulder on the low energy side at about 9.04 eV. Olney et al. [20] also reported on the existence of this feature in their high resolution dipole (e,e) measurement. By decomposition into Gaussian components, they determined two peaks with maxima at 8.94 and 9.40 eV successively. These authors assigned these features to the Jahn-Teller splitting of the electronic state resulting from the 2e-1 excitation on the basis of the corresponding splitting of 0.6 eV observed in the photoelectron spectrum [23].
Table 1- Vertical excitation energies (EEvert) (eV), vertical ionization energies (IEvert) (eV) and assignments for
the photoabsorption spectrum of monofluoromethane EEvert
Pabsa [16] Pabsa [6] (e,e)b [20] EELSc [22] This work Assignment
IEvert [23,24] - - [8.98] - 9.04(s) 2e → 3s 9.35 - 9.40 9.36 9.37 - - 10.0-10.8 - 10.0-10.8 2e → 3p 10.58 - - 10.42 10.04(m) - - 11.0-11.9 - 10.8-11.8 2e → 3p 11.37 11.20 - 11.21 11.27(m) (continued) 13.04 (2e)-1 - - - - 11.8-13.2 2e → 6s/5d 13.52 13.50 ~13.4 13.41 13.57(m) 5a1/1e → 3s and/or 3p - 15.25 ~15 15.25 15.73 5a1/1e → 4s/3d - - - 17.2 (5a1/1e) -1 - ~17.9 - 19.80 ~19.5 19.78 19.9 4a1 → 3s - 20.40 - - - - 22.30 - - 22.0 4a1 → 4s/3d 23.5 (4a1) -1 - - - - -
[(s) and (m) refer to shoulders and maxima in the corresponding bands respectively.] a
Pabs: photoabsorption spectroscopy. b
(e,e): dipole (e,e) electron spectroscopy. C
EELS: electron energy loss spectroscopy.
The two first broad peaks at 9.37 and 11.27 eV, respectively, are separated by a progression for which the maximum is estimated to be at about 10.4 eV. On the basis of this energy and the convergence limit at 13.04 eV for the 2e-1 photoelectron band [23], an effective quantum number n* = 2.270 is determined. This could indicate that one is dealing with a Rydberg state with a p-character. This energy region will be discussed in more detail in the next section.
The band at 11.27 eV is well defined but underlies a weak fine structure, which will be analyzed in the next section. The term value associated with this band is 1.77 eV and the effective quantum number is n* = 2.772. Harshbarger et al. [22] and Olney et al. [20] assigned this band to a 2e → 4s/3d transition.
The strongest photoabsorption band of CH3F has its maximum near 13.57 eV and spreads from 12.5 to
14 eV. As shown in Fig. 2(a), a fine structure extending to at least 13.2 eV is superimposed on this continuum. Separating the broad feature from the fine structure, the term value associated with the former is estimated at 3.63 eV and an effective quantum number n* = 1.936 is obtained. This strongly suggests a (5a1/1e) → 3s
transition where the 5a1 and the le orbitals are nearly degenerate. On the basis of the peak width, Harshbarger et
al. [22] suggested that within the energy range of 12.5-14 eV, (5a1/1e) → 3s and (5a1/ 1e) → 3p transitions should
occur.
The energy range of the photoabsorption spectrum above 15 eV has been handled as described in Section 2.2. Despite the unfavourable signal-to-noise ratio resulting from this procedure, clearly four features can be observed: a peak at 15.7 eV, a very broad weak band at about 18 eV, which spreads over a photon energy range of about 3 eV, and finally peaks at 19.9 and at 22.0 eV.
The feature defined by its maximum at 15.7 eV spreads from about 15-17 eV and would have a term value of 1.47 eV with respect to the ionization limit at 17.2 eV. An effective quantum number n* = 3.04 is
calculated. This probably indicates that this peak corresponds to a (5a1/1e) → 4s/3d transition. This is in
agreement with earlier reports [6, 20, 22]. This transition was also identified as being responsible for the dissociative autoionization producing thermal and nearly thermal CH3
+
fragment ions when using the Ne(I) lines for ionization [6].
The very weak and broad structure following the peak at 15.7 eV overlaps the energy range of the (5a1/1e)-1 photoelectron band [24]. This feature is also observed in the photoabsorption spectrum reported by Wu
et al. [19].
The two remaining structures observed at 19.92 and 22.01 eV are observed below the (4a1) -1
ionization limit. Their term values are 3.58 and 1.49 eV. The calculated effective quantum numbers are n* = 1.949 and n* = 3.022, which are indicative of 4a1 → 3s and 4a1 → 4s/3d transitions. These features were neither discussed nor
assigned in previous papers [6, 19, 20, 22]. The latter Rydberg state overlaps the energy of the He(I) resonance line at 21.22 eV and its autoionization should be responsible for the production of the thermal and nearly thermal CH3+ fragment ions by dissociative autoionization induced by the He(I) resonance line [6].
4.2. The fine structure
4.2.1. Results of the ab initio calculations
In the most recent past, two quantum mechanical calculations were reported about CH3F and CH3F+
[25,26]. Gauld and Radom [25] used high level ab initio calculations to describe CH3X and CH3X+ (where X =
F, Cl, OH, NH2, SH and PH2) and their isomeric species CH2X +
H. They obtained their optimized geometries and thermochemical properties. Good agreement is found between theory and experiment for most of these species. Significant differences are mentioned for CH3F+ and its ylidionic isomer CH2X+H for which the authors suggest
a revision of the experimental data.
Lugez et al. [26] investigated the infrared spectrum of the methyl halide cations trapped in a frozen neon matrix. The discussion is supported by ab initio calculations at MP2 as well as at QCISD levels. In agreement with Gauld and Radom [25], they also found a minimum for a CH3F
+
cation distorted to the Cs
symmetry and with a ground state of 2A" electronic symmetry approaching the CH2F +
H structure, where the C-F bond length is considerably shorter than in the neutral molecule. This is not surprising since the ground electronic state has a 2E symmetry in the C3v point group and will therefore be submitted to a Jahn-Teller
distortion [27]. The main contribution of Lugez et al. [26] is the calculation of vibrational wave numbers in CH3F
+
and the comparison of these values with their infrared data and with the values obtained for the cation by photoelectron spectroscopy [23]. In order to investigate in further detail, the Jahn-Teller interaction in CH3F, it
would be desirable to obtain informations on the 2A' component for which no previous calculation is available. Therefore, we performed ab initio calculations of CH3F and CH3F+ using the GAUSSIAN 94 program
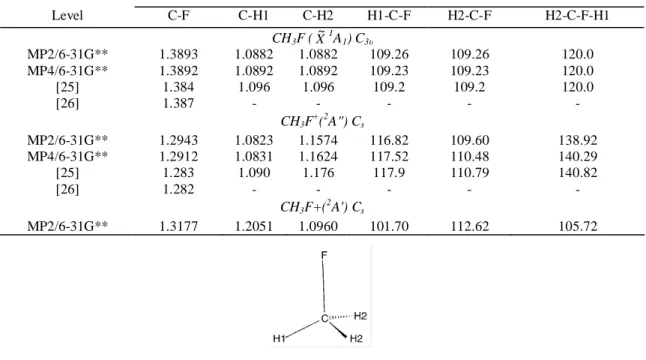
[28] at the MP2 and MP4 frozen core level [29,30]3 with 6-31G** basis sets [31,32]. The geometries are optimized for the C3v and Cs symmetry groups. The results are shown in Table 2 for CH3F ( X~1A1) and CH3F+
(2A" and 2A') together with the results of previous calculations [25, 26].
An essential first result, which is consistent with previous ab initio calculations, is the severe shortening of the C-F bond length upon ionization in both the 2A" and the 2A' states. This fact will have important consequences on the vibrational analysis of the absorption spectrum. Furthermore, the Jahn-Teller distortion is found to act on both the bond length and the bond angles. This leads to the Cs symmetry, with two equivalent
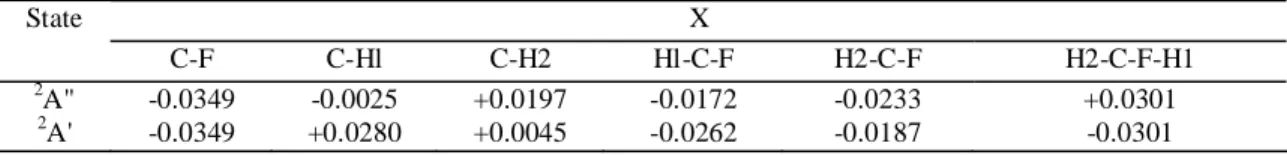
hydrogen nuclei called H2 (see figure in Table 2). As can be expected on the basis of the symmetry properties of the 2e orbital in the 2A" state, the H2-C-H2 bond angle is reduced compared to the neutral molecule, whereas the reverse is true for in the 2A' state. Important variations of the bond lengths are also observed (Tables 2 and 3). More particularly, the H2-C-F-H1 dihedral angle strongly deviates from 120 degree. Components of the energy gradient were calculated for both cationic states at the neutral ground state equilibrium geometry and these are listed in Table 3. The gradient preserves the Cs symmetry, imposing the symmetry of both the wave packet
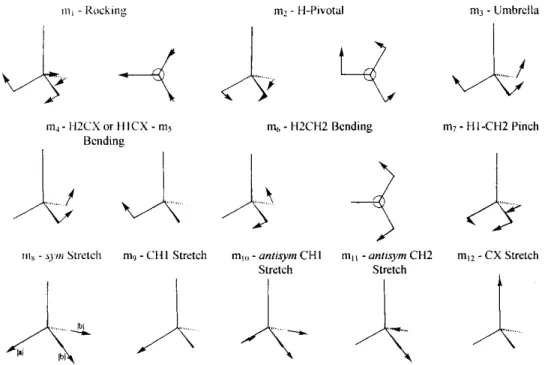
motion and the symmetry of the observed vibrational modes (a')· The vibrational wave numbers of the neutral molecule and of the 2A" and 2A' states of the cation have been calculated and weighted by the 0.937 empirical correction factor [33]. The results are displayed in Table 4 for CH3F and CH3F+ (2A" and 2A'). The nuclear
3
motions associated with the nine vibrational normal modes are described with reference to symmetry coordinates (ml to ml2) depicted in Fig. 3.
For the neutral CH3F (X
~1
A1) molecule, calculated and experimental wave numbers [34] agree
satisfactorily. Despite a lowering in most cases with respect to the results of Lugez et al. [26], the wave numbers characterizing the 2A" state of the ion are in fairly good agreement. The slight discrepancy could be ascribed to the difference of the calculation levels, i.e. MP2 in this work and QCISD in Ref. [26], and to the use of distinct basis sets.
Due to the threefold symmetry of the CH3F system, three minima corresponding to the distorted 2A"
state exist and are generated by the cyclic permutation of the three hydrogen atoms. The 2A' state has also been optimized (Table 2) and corresponds to the transition state linking two equivalent 2A" minima. As expected, an intrinsic reaction path leads from such a transition state to either of the neighbor minima. To facilitate the understanding of the situation discussed here, Fig. 4 displays potential energy contour diagrams of the lower part of the Jahn-Teller split potential energy surface of the CH3F+ ( X
~2
E) state. This diagram is derived from a perturbational treatment of the Jahn-Teller effect up to the second order [35]. The potential energy is given by the equation
where qx and qy are degenerate symmetry coordinates which belong to the E irreducible representation of the C3v
point group. They correspond to the antisymmetrical bending motion. ∆ and Φ are the polar coordinates corresponding to qx and qy. The numerical parameters λ, µ and v are chosen to reproduce the ab initio results for
the energy of the minima (2A") and saddle points (2A') as well as the positions of the minima. The threefold symmetry is clearly observed. The energy stabilization brought about by the distortion, i.e. the energy difference between the C3v apex and the minima is 0.84 eV at the MP4/6-31G** level. On the other hand, the saddle points
are calculated to lie only 0.075 eV above the minima. Table 2- Optimized geometries of CH3F (X
~1
A1) in the C3v symmetry group and CH3F+ (2A" and 2A') in the Cs
symmetry group calculated at different levels: distances in A and angles in degrees. Comparison is made with previous calculations at their highest levels [25, 26]
Level C-F C-H1 C-H2 H1-C-F H2-C-F H2-C-F-H1 CH3F (X ~1 A1) C3υ MP2/6-31G** 1.3893 1.0882 1.0882 109.26 109.26 120.0 MP4/6-31G** 1.3892 1.0892 1.0892 109.23 109.23 120.0 [25] 1.384 1.096 1.096 109.2 109.2 120.0 [26] 1.387 - - - - - CH3F + (2A") Cs MP2/6-31G** 1.2943 1.0823 1.1574 116.82 109.60 138.92 MP4/6-31G** 1.2912 1.0831 1.1624 117.52 110.48 140.29 [25] 1.283 1.090 1.176 117.9 110.79 140.82 [26] 1.282 - - - - - CH3F+( 2 A') Cs MP2/6-31G** 1.3177 1.2051 1.0960 101.70 112.62 105.72
The wave numbers for the 2A' state are about the same as those characterizing the 2A" minimum but they involve different vibrational modes. This is due to the 120 degree rotation of the normal modes (Duschinski
effect) illustrated in Fig. 4. Obviously, an imaginary wave number (64li cm-1) appears because one deals with a transition state. The corresponding mode has a m2 character (Fig. 3) and correlates therefore with the v9 mode
(a" symmetry) of the 2A" minimum. The nuclear symmetry coordinate m2, which is a H-pivotal deformation motion (Fig. 3) is therefore the vibrational mode connecting with each other the different minima of the ground state potential energy surface. This means that among the possible Jahn-Teller active degenerate normal modes in the C3v point group, the deformation modes v5 and/or v6, which have components on m2 (Table 4), play an
important role in the Jahn-Teller stabilization. The antisymmetric valence mode seems to play a minor role. This Table 3 - Gradient components ∂E/∂X, in Hartree/Bohr or Hartree/degree, for the 2A" and 2A' states of CH3F
+
, respectively, calculated at the equilibrium geometry of the ground state CH3F ( X
~1 A1) X State C-F C-Hl C-H2 Hl-C-F H2-C-F H2-C-F-H1 2 A" -0.0349 -0.0025 +0.0197 -0.0172 -0.0233 +0.0301 2 A' -0.0349 +0.0280 +0.0045 -0.0262 -0.0187 -0.0301
Table 4 - Vibrational normal modes and their corresponding wave numbers (cm-1) resulting from ab initio calculations at the MP2(FC)/6-31G** level, for CH3F (X
~1
A1) and CH3F +
(2A" and 2A'), respectively in the C3v
and Cs symmetry group a
Designation Wave number
(this work) Mode Description (see Fig. 3) Ref. [34] CH3F ( X ~1 A1) (C3υ) a1 Symmetry v1 2936 m8 2964 v2 1456 m3 1475 v3 1042 m12 1048 e Symmetry v 4 3033 m12 2982 v5 1465 m2 + m6 1471 v6 1150 m2 + m1 1195 CH3F+(2A")(CS) Ref. [26] a' Symmetry v1 3116 m9 3228 v2 2479 m10 2589 v3 1422 m4 + m5 1478 v4 1283 m12 1321 v v5 1032 m1 1082 v6 667 m6 808 a" Symmetry v7 2217 m11 2190 v8 1002 m2 1043 v9 747 m2 1024 CH3F+(2A')(CS)-TS a' Symmetry v'1 2896 m8 - v'2 2423 m9(+m6) - v'3 1405 m3 - v'4 1323 m7 - v'5 1141 m12 + m5 - v'6 733 m4 + m5 - a" Symmetry v'7 2961 m11 - v'8 1151 antisymm m1 - v'9 i641 m2 - a The 2
A' component corresponds in fact to a transition state (TS). All wave numbers are corrected by the coefficient proposed by Scott and Radom [33].
is confirmed by the absence of this mode in the vibrational progressions which will be discussed in Section 4.2.2.On the basis of the geometrical differences between the cationic and the neutral states, the following vibrational motions should be excited upon ionization to the 2A" state. According to Tables 2, 3 and Fig. 3, these would be: ml2 (C-F stretch), ml0 (C-H antisymmetric stretch), ml (CH3-rock-ing), m4, m5 (H1/H2-C-F bend),
m6 (H2-C-H2 bend) and m7 (H1-C-H2 pinch). Consequently, the following frequencies are expected to show up: v4, v2, v5, v3 and v6. The observation of the gradient components confirms this analysis. It has to be noticed
that the assignment of small frequencies has to be done cautiously because these are the least accurate. Fig. 3. Schematic representation and description of nuclear symmetry coordinates mi of CH3X
+
in the Cs
symmetry group.
Fig. 4. Contour lines of the low energy part of the Jahn-Teller distorted potential energy surface of the CH3F+
X2E state. The energies (eV) are given with respect to the apex (undistorted position). This diagram corresponds to a second-order perturbation treatment of the Jahn-Teller effect [35] (see text).
4.2.2. The experimental data
The attention will be focussed here on the long series of weak structures observed between 10.0 and 13.2 eV photon energy as shown in Figs. 1 and 2(a). Only the first 15 peaks have been reported, analyzed and assigned in the literature [16] as shown in the first column of Table 5. Photoelectron spectroscopic data and assignments from Karlsson et al. [23] have been added as being useful for the interpretation. The results of this work are listed in the third and fourth columns in wave number (cm-1) and energy (eV), respectively.
To avoid any confusion, it should be mentioned that the assignments made in Table 5 and in this discussion are based on the vibrational mode descriptions corresponding to the results of the ab initio calculations as presented in Section 4.2.1. The assignments presented in Ref. [23] result from the description of the vibrational modes in CH3F
+
in terms of those of CH3F in the C3v group of symmetry.
Table 5- Vibrational fine structure and energy levels observed in the 10.035-10.783 eV photon energy range This work
Ref. [16]a Ref. [23]a,b,c cm-1(e) eVd n*e Assign.
80995 80940b 80940 10.035(4) 2.344 0-0 - 81633 81714 10.131(6) 2.357 v6 81972 819 899 10.154(5) 2.357 v5 82260 82254 82206 10.192(6) 2.331 1v4 - 561 - - - - 941 883 859 10.273(5) 2.332 v4 +v6 83 221 83 101 83 198 10.315(7) 2.339 v4 +v5 474 545 408 10.341(7) 2.329 2v4 - 827 - - - - 84187 84125 84077 10.424(5) 2.331 2v4 + v6 438 359 432 10.468(5) 2.337 2v4 + v5 669 746 577 10.486(4) 2.324 3v4 85179 85013 85142 10.556(7) 2.341 3v4 + v6 338 367 650 10.619(2) 2.342 4v4 783 - - - - - 86276 86166 86174 10.684(8) 2.334 4v4 + v6 919 561 - - - - 87 438 87 263 973 10.783(8) 2.316 4v4 + 2v6
Comparison with previous measurements by photoabsorption [16] and photoelectron spectroscopy [23]. The value of the effective quantum number n* and the proposed assignments are inserted.
a
In cm-1 units.
b
Obtained by adding the vibrational spacings reported by [23] to 80 940 cm-1.
c
Recommended energy (eV) to wave number conversion factor: 1 eV = 8065.48 cm-1
[36].
d
Numbers in brackets = one standard deviation (for explanation see text).
e
Using the recommended value for the Rydberg constant, R = 13.6058 eV [36].
The comparison of the energy levels of the structures shows some significant discrepancy. The results of Stokes and Duncan [16] are reported as being affected by an error of about ± 10 cm-1, when sharp bands are concerned. The maximum error allowed in the photoelectron spectroscopic work [23] is about 6 meV or 48 cm-1. The standard deviation affecting each peak position in the present work is listed in Table 5 and ranges between 2 and 8 meV or 16-64 cm-1. Despite these observations, very scarce are the overlapping measurements. The origin of this discrepancy is not easy to identify. A systematic error, e.g. monochromator calibration, seems to be very unlikely. Nevertheless, the corresponding features in each experiment can be identified unambiguously.
The series of narrow peaks starting at 10.035 eV has to be assigned as pertaining to vibrational progressions of one isolated Rydberg state. Indeed, taking the energy levels of the absorption spectrum and using the ionization energies reported by Karlsson et al. [23] as their respective convergence limit, an average term value of 2.500 ± 0.015 eV and an effective quantum number n* = 2.333 ± 0.030 have been obtained by averaging over the 14 values.
The fine structure can be assigned on the basis of three vibrational normal modes of a' symmetry (Cs
point group) in the 2e → 3p Rydberg state converging to the 2A" ionic state, i.e. v4(a') (C-F stretch), v5(a') (CH3
rock) and v6(a') (H-C-H bend) using the notations resulting from the ab initio calculations (Section 4.2.1) and the
group (Table 4) and are therefore Jahn-Teller active. On the other hand, the v4 mode correlated to the v3 mode in
the C3v point group does not lead to a symmetry lowering. Stokes and Duncan [16] designated the present v4(a')
and v5(a') modes by the v2(a1) and v3(a1) modes. These authors did not observe the wave number corresponding
to the actual v6(a') normal mode characterized by hv6 = 0.086 ±0.010 eV (ω6 = 690 ± 80 cm-1). This vibrational
energy has been observed in the photoelectron spectrum [23]. The absence of this vibration changes the assignment considerably [16]. The fact that v2, corresponding to an antisymmetric C-H stretch, is not observed
confirms the minor role played by this vibration in the Jahn-Teller stabilization, as already inferred from the ab initio results.
Up to 10.341 eV, the wave numbers obtained from the present photoabsorption spectrum are in full agreement with the photoelectron data of Karlsson et al. [23] but the assignment is completely different. Associated with the v3, v6 and v5 vibrational progressions in the C3v point group, in the present work, we suggest
the following assignment hcω6 = 0.086 ± 0.010 eV (ω6 = 690 ± 80 cm-1), hcω5 = 0.121 ± 0.009 eV (ω5 = 976 ±
72 cm-1) and hcω4 =0.157 ± 0.010 eV (ω4 = 1266 ± 80 cm -1
). These values have to be compared with those reported by Karlsson et al. [23] of 0.086, 0.109 and 0.163 eV. In their photoabsorption spectrum, Stokes and Duncan [16] determined 975 cm-1 (0.121 eV) and 1278 cm-1 (0.158 eV). As mentioned earlier, the value of 0.086 eV is missing in this latter work. Karlsson et al. [23] based their assignment on a comparison between the wave numbers of the neutral and the ionized methyl fluoride. This ignores the strong modifications brought about in the vibrational force field by the ionization process, and in this case, by the Jahn-Teller effect. As an example, these authors [23] assigned the 86 meV transition energy to the C-F stretch. Such a decrease of the C-F wave number in the ion compared to the neutral cannot be maintained because the ab initio calculations unambiguously show that the involved 2e orbital has a CF antibonding character. The removal of an electron from this orbital leads therefore to an important F bond length shortening of 0.1 A and to an increase of the C-F stretching wave number whose calculated value of 0.159 eV (1283 cm-1) is very close to the experimental value. Such a very good agreement between theory and experiment is also found for the two other intervals detected in the spectra, i.e. hcω6 = 0.083 eV (667 cm-1) and hcω5 = 0.128 eV (1032 cm-1).
However, two transitions which are observed in the ion [23] are detected neither in the present study, nor in Stokes and Duncan's work [16]. Moreover, two transitions detected by Stokes and Duncan [16] and/or by Karlsson et al. [23] are not observed in our spectrum. They would involve combinations v6 + v5, v6 + v5 + v4. The
combination reported at 86 561 cm-1 for v3 +4v5 [23] has been allocated preferentially to the structure at 10.684
eV (Table 5), i.e. v6 + 4v4. An argument favoring this assignment is the value of the effective quantum number of
n* = 2.334, calculated as based on this assumption, which is very close to the average value of n* = 2.333 ± 0.030.
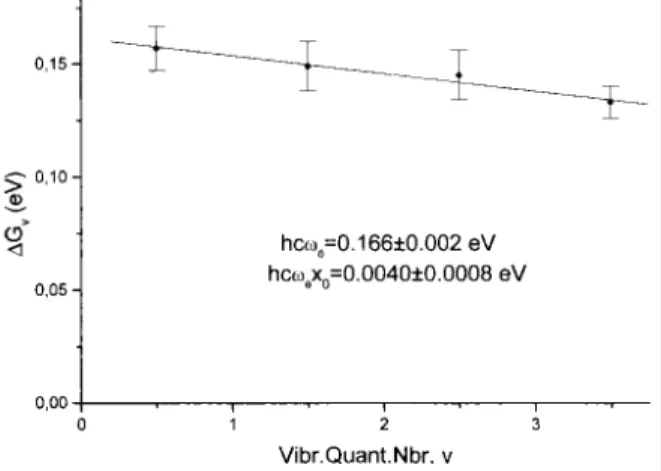
Fig. 5. Birge-Sponer plot corresponding to the v4 vibrational mode in the 10.03-10.78 eV photon energy range.
Furthermore, the fairly good precision on the present measurements clearly showed an anhar-monicity on the v4 mode, observed up to v = 4. Karlsson et al. [23] already mentioned that the photoelectron band
structure includes a small an-harmonicity. The Birge-Sponer plot related to this vibrational progression is shown in Fig. 5. A linear regression fitted the data with a correlation coefficient of 0.989, including the errors on ∆GV.
From the zero extrapolation and slope, the molecular constants (hcω0)4 = 0.166 ± 0.002 eV [(ω0)4 = 1339 ± 16
cm-1] and (hcω0x0)4 = 0.0040 ± 0.0008 eV [(ω0x0)4 = 32 ± 6 cm -1
After a drop of the relative intensities (Fig. 2(a)), the structures observed above 10.850 eV have increasing intensities reaching a maximum at about 11.007 eV and then slowly decrease for photon energies increasing to 12.0 eV. The density of structures in this energy range is much higher than that at lower energies.
As mentioned in the fourth column of Table 6, the effective quantum number which could be allocated to the structures observed in the present photoabsorption spectrum remains quite constant and close to the earlier obtained average of n* = 2.333 ± 0.030. This result could be obtained by relating the present spectrum with the remaining structures observed in the X~ 2E band of the photoelectron spectrum of CH3F [23] and listed in the
first column of Table 6. It is noteworthy to mention that in this energy range, the uncertainty on the energy levels as mentioned by the authors [23] is 10 meV (80 cm-1) instead of 6 meV at most on the low energy side of the same band.
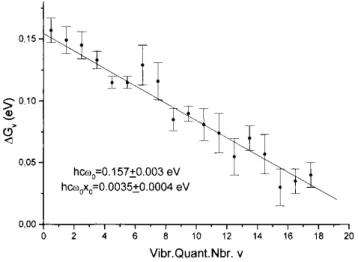
It is therefore suggested that this series of peaks belongs to the same 2e → 3p Rydberg transition. Karlsson et al. [23] assigned the high energy part of the X~2E band of the photoelectron spectrum to the upper part of the Jahn-Teller split potential energy surface. However, a clear-cut transition between the two regimes is observed neither in our absorption spectrum nor in the photoelectron spectrum [23]. Therefore, we prefer to suggest an alternative detailed interpretation of the observed vibrational pattern based on the fact that most of the peaks measured up to 11.9 eV can be assigned as members of the nv4 progression with the wave number and
anharmonicity constant derived from the Birge-Sponer plot of Fig. 5. Fig. 6 displays the new Birge-Sponer plot obtained by considering nv4 vibrational levels up to n = 18. The constants derived from the least squares fit, i.e.
(hcω0)4 = 0.157 ± 0.003 and (hcω0x0)4 = 0.0035 ± 0.0004 eV, are very close to those derived from the first four
levels. The correlation coefficient is 0.977. In addition, as this wave number refers to the C-F stretch, the dissociation energy deduced from the wave number and anharmonicity should not be very different from or converge to the CH3F
+→ CH 3
+
+ F dissociation energy. Even though such an extrapolation based on only one anharmonicity term is not expected to be very accurate, a value of 1.694 eV is obtained, and is consistent with the dissociation energy of 2.0 eV derived from photoionization mass spectrometric measurements [6]. A long progression associated with the C-F vibration is perfectly consistent with the important change in the C-F bond length, which is the largest change brought about upon ionization (Tables 2 and 3).
Besides this main vibrational progression, two other spacings have been identified above 10.85 eV, i.e.
∆GV = 80 ± 8 meV (645 ± 60 cm-1) and ∆GV = 119 ± 6 meV (960 ± 50 cm-1) as averaged over 14 and 10 values,
respectively. These spacings can be assigned to the already mentioned Jahn-Teller active v6 and v5 modes. The
fact that only low excitations of the Jahn-Teller active modes are observed implies that the wave packet only explores the lowest part of the Jahn-Teller split potential energy surface. As the potential well is relatively deep (0.84 eV), the wave packet does not come too close to the region where the Born-Oppenheimer approximation breaks down, i.e. where vibronic couplings are strong. This gives rise to the observed regular vibrational pattern.
The overall intensity in this band seems to decrease when the photon energy reaches about 12.0 eV. At this energy, lines are still observed at 11.913 and 11.939 eV (Table 6). Considering that these structures still correspond to vibronic transitions to the same 2e → 3p Rydberg state characterized by the same effective quantum number n* = 2.333, an ionization energy of 14.44 eV is calculated for the convergence limit of the 11.939 eV level. This energy is close to the Franck-Condon limit estimated for the X~2E photoelectron band of CH3F [23] and is indicated in brackets in Table 6. Perhaps the very weak line at 12.025 eV still belongs to this
progression and could fit a nv4 + v5 or v6 (n ≥ 18), as indicated in Table 6.
The fine structure displayed upon the photo-absorption band at 11.27 eV is observed well beyond the Franck-Condon limit estimated at about 12 eV as shown in Fig. 2(a) and Table 6. This structure has likely to be assigned to a 2e → ns/ (n-1)d or np transition and is superimposed on the 5a1/1e → 3s and/or 3p Rydberg
transitions mentioned earlier. Considering our observations at lower energies, we expected to find about the same progressions.
As shown in Table 6, for all the remaining structures, which could be correlated with the vibrational progression of the photoelectron spectrum of CH3F [23], about the same effective quantum number is obtained.
Using 20 values, an average value of n* = 5.010 ± 0.074 is determined. In this photon energy region, a larger scattering of the energy level measurements has to be noticed and is marked by a larger standard deviation. This is essentially ascribed to a larger crowding of the structure. Nevertheless, this value of n* is typical for a 6s/5d transition. However, an uncertainty remains concerning the lowest excitation energy to this Rydberg state. Using the 11.976 eV line and 12.533 eV for the adiabatic ionization energy, an n* = 4.942 is calculated. It cannot be excluded that the actual lowest excitation energy should be at 11.991 eV using n* = 5.010 and which should be burried in the 11.976 and 12.025 eV peaks. Some recordings showed a shoulder at this energy.
Table 6 - Vibrational structure and energy levels observed in the 10.850-13.257 eV photon energy range
Ref. [23]a This work
cm-l b eVb,c n*d Assignment 13.360 87 513 10.850(8) 2.328 6v4 13.450 88 158 10.930(6) 2.323 6v4 + v6 13.487 533 10.979(8) 2.329 7v4 - 779 11.007(2) - 6v4 + 2v6 13.560 89 046 11.040(4) 2.323 6v4 + v5 + v6 - 465 11.095(7) - 8v4 13.630 699 11.121(8) 2.329 7v4 + 2v6 - 90 175 11.180(2) - 9v4 - 392 11.207(8) - 8v4 + v5 - 578 11.230(5) - 7v4 + 3v6 or 7v4 + 2v5 13.760 901 11.270(4) 2.337 10v4 91 199 11.307(13) 9v4 + v5 554 11.351(9) 11v4 804 11.382(6) 10v4 + v5 92 151 11.425(7) 12v4 594 11.480(8) 13v4 93 159 11.550(2) 14v4 619 11.607(14) 15v4 858 11.637(8) 16v4 94 143 11.672(16) 17v4 288 11.690(6) 15v4 + v6 466 11.712(7) 18v4 853 11.760(3) 16v4 + v5 95 530 11.844(7) 17v4 + 2v6 96 087 11.913(5) 18v4 + v5 + v6 [14.439]e 294 11.939(9) [2.33]e 18v4 + 2v5 595 11.976(7) 18v4 + 3v6 12.533 4.942 0-0 2e → 6s/5d 12.533 [11.991]e [5.01]e [0-0 2e → 6s/5d]e 96 990 12.025(4) [nv4 + v5(v6) with n > 18]e 12.619 97 482 12.086(4) 5.052 v6 12.642 821 12.128(6) 5.145 v5 12.696 98 031 12.154(6) 5.010 1v4 12.734 466 12.208(9) 5.086/ v5 + v6 12.774 4.903 12.801 99 095 12.286(6) 5.140 v4 + v5 12.850 305 12.312(9) 5.029 2v4 12.891 418 12.326(3) 4.907 v4 + 2v6 12.928 - [12.398] (2v4 + v6) 12.960 - [12.433] (2v4 + v5) 13.005 100 507 12.461(8) 5.001 3v4 13.038 725 12.488(5) 4.974 2v4 + 2v6 13.080 101 281 12.557(12) 5.100 3v4 + v6 13.181 555 12.591(7) 4.942 4v4 - 102 096 12.658(2) 3v4 + v5 + v6 13.230 338 12.688(8) 5.010 4v4 + v6 612 12.722(4) 5v4 13.320 806 12.746(7) [4.869] 4v4 + 2v6 103 169 12.791(7) [5.071] 4v4 + v5 + v6 13.360 507 12.833(13) 5.081 6v4 830 12.873(8) 4v4 + v5 + 2v6
Table 6 (continued) Réf. [23]a This work cm-1 b eVb,c n*d Assignment 13.450 104 056 12.901(5) 4.978 5v4 + 2v6 13.487 249 12.925(5) 4.920 7v4 645 12.974(4) 5v4 + 2v5 13.560 983 13.016(7) 5.001 7v4 + v6 105 137 13.035(2) 8v4 13.630 435 13.072(2) [4.937] 6v4 + 3v6 588 13.091(2) [5.024] 7v4 + 2v6 106 105 13.155(10) 8v4 + v5 13.760 468 13.200(10) 4.929 10v4 927 13.257(10) 8v4 + 2v5
Effective quantum numbers and assignments proposed in this work are also inserted.
a
Ionization energies (eV) as reported in Ref. [23].
b
Recommended energy (eV) to wave number conversion factor 1 eV = 8065.48 cm-1
[36].
c
Number in brackets = one standard deviation (see text for explanation).
d
Using the recommended value of the Rydberg constant R = 13.6058 eV [36].
e
Data in square brackets, see text.
Fig. 6. Birge-Sponer plot corresponding to the v4 vibrational mode in the 10.03-11.91 eV photon energy range.
On the basis of a nearly equal effective quantum number, the features starting at 12.086 up to 13.257 eV are therefore assigned to one and the same progression of the 2e → 6s/5d Rydberg state. A possible assignment of the lines observed be tween 12.025 and 12.746 eV is reported in Table 6. An argument favoring this assignment, as well as the choice of the lowest excitation energy at 11.991 eV, is the possibility to determine a progression of the v4 normal mode. Combinations with v6 and v5 vibrations are also observed. Furthermore, an
anharmonicity is again observed in this band. A Birge-Sponer plot for 10 vibrational quanta is shown in Fig. 7. A linear regression could be fit to these data with a correlation coefficient of 0.987. This provides the molecular constants (hcω0)4 = 0.167 ± 0.004 eV [(ω0)4 = 1348 ± 30 cm
-1
] and (hcx0ω0)4 = 0.0043 ± 0.0007 eV [(ω0x0)4 = 35
± 6 cm-1]. These values are both in good agreement with the values determined earlier for the 2e → 3p transition, i.e. 0.157 ± 0.003 and 0.0035 ± 0.0004 eV.
Fairly good correlation is observed between the remaining high energy structures from 12.791-13.257 eV and the photoelectron spectrum. A few additional lines are observed in the photoabsorption spectrum. A complete assignment has been attempted (Table 6).
Fig. 7. Birge-Sponer plot corresponding to the v4 vibrational mode in the 11.99-13.25 eV photon energy range.
5. CONCLUSIONS
The vacuum UV photoabsorption spectrum of CH3F has been examined in detail. It consists of broad
peaks underlying many line shaped structures. The attention has particularly been focused on the fine structure observed between 10.03 and 13.25 eV. It has been assigned to two extended vibrational progressions associated with two Rydberg transitions, i.e. 2e → 3p and 2e → 6s/5d. Ab initio calculations have been performed and the Jahn-Teller distortion accompanying the 2e Rydberg excitation in both bands is carefully considered. The main feature is assigned to one extended vibrational progression involving the Jahn-Teller inactive v4 mode for which
hcω0~ 160 meV (1290 cm -1
) and hcω0x0 ~ 4 meV (32 cm -1
). Besides this motion, two Jahn-Teller active vibrational motions are slightly excited, i.e. v5 and v6 for which hcω5 ~ 120 meV (970 cm-1) and hcω6 ~ 82 meV
(660 cm-1). Furthermore, a Jahn-Teller stabilization energy of 0.84 eV is theoretically predicted. Fig. 8. Birge-Sponer plot built on the data related to the first photoelectronic band of the CH3F
+
( X~2E) cation as reported by Karlsson et al. [23] (for explantion, see text).
In the light of the present analysis, we are able to reconsider the interpretation of the photoelectron spectroscopic data published by Karlsson et al. [23]. Using their own data (see Table 2 in Ref. [23]) and by calculating the missing data by the Rydberg formula, a Birge-Sponer diagram has been plotted for the CH3F
+
Fig. 8 and the molecular constants derived from this least squares fit are (hcω0)4 = 0.170 ±0.003 eV (1371 ± 24
cm-1) and (hcω0x0)4 = 0.0042 ± 0.0008 eV (34 ± 6 cm-1). This wave number has obviously to be assigned to the
C-F stretching motion in agreement with ab initio calculations predicting an important C-F bond shortening. This description differs from the analysis of Karlsson et al. [23], who related this motion to the 0.086 eV quantum. In the present work, this latter energy is assigned to the antisymmetric bending motion v6. These results are
summarized in Table 7.
In the fourth column, the assignment proposed by Karlsson et al. [23] is reproduced, although we suggest a different interpretation, which is presented in the last three columns.
Table 7 - Vibrational energies (meV) and assignments for CH3F (X
~1
A1) and CH3F+ (X
~2
A") as determined by ab initio calculations, infrared spectroscopy [34], photoelectron spectroscopy [23] (for explanation, see text) and photoabsorption spectroscopy in this work
Symmetry Group C3v Symmetry Group Cs
Motion
Mode Th./exp. [34] CH3F CH3F +
[23] Mode Abs. Sp. This
Work Rydberg Theor. This Work CH3F+ C-F stretch v3 129/130 86 v4 160 159 CH3 rock v6 143/149 109 v5 120 128 CH2 bending v5 182/182 163 v6 82 83 Acknowledgements
We are indebted to the University of Liège, the Freie Universität Berlin and the Bundesministeri-um für Forschung und Technologie for financial support. H.B. acknowledges the Fonds des Chemischen Industrie for financial support. R.L., B.L. and A.H. gratefully acknowledge the European Community for its support through its TMR programme (Contract EU-TMR-ERBFMGE-CT-970123). B.L. thanks the Fonds National de la Recherche Scientifique (Belgium) for a research associate position. This work has also been supported by the Direction de la Recherche Scientifique de la Communauté Française de Belgique through an Action de Recherche Concertée (ARC). D.D.'s contribution was supported by the Belgian Program of Pôles d'Attraction Interuniversitaires (PAI no. P4/03) initiated by the Belgian State, the Prime Minister's Office, the Federal Office of Scientific, Technical and Cultural Affairs.
We also wish to thank the BESSY I staff for the outstanding maintenance of the equipment. The authors wish to gratefully acknowledge the critical reading and suggestions made by the referee.
References
[1] G.Tornow, R.Locht, R.Kaufel, H.Baumgärtel, H.W. Jochims, Chem. Phys. 146 (1990) 305. [2] R. Locht, B. Leyh, K. Hottmann, H. Baumgärtel, Chem. Phys. 220 (1997) 207.
[3] R. Locht, B. Leyh, K. Hottmann, H. Baumgärtel, Chem. Phys. 220 (1997) 217.
[4] A. Hoxha, R. Locht, B. Leyh, D. Dehareng, K. Hottmann, H. Baumgärtel, Chem. Phys. 256 (2000) 239. [5] J. Momigny, R. Locht, Chem. Phys. Lett. 211 (1993) 161.
[6] R. Locht, J. Momigny, E. Rühl, H. Baumgärtel, Chem. Phys. 117 (1987) 305.
[7] A. Hoxha, R. Locht, A.J. Lorquet, J.C. Lorquet, B. Leyh, J. Chem. Phys. 111 (1999) 9259. [8] K.M. Weitzel, F. Güthe, J. Mähnert, R. Locht, H. Baumgärtel, Chem. Phys. 201 (1995) 287. [9] F. Güthe, R. Locht, B. Leyh, H. Baumgärtel, K.M. Weitzel, J. Phys. Chem. A 103 (1999) 8404.
[10] R. Locht, J. Momigny, in: F. Lahmani (Ed.), Photophysics and Photochemistry above 6 eV, Elsevier, Amsterdam, 1985, p. 171.
[11] W. Zhang, G. Cooper, T. Ibuki, CE. Brion, Chem. Phys. 137 (1989) 391. [12] W. Zhang, G. Cooper, T. Ibuki, CE. Brion, Chem. Phys. 151 (1991) 343. [13] W. Zhang, G. Cooper, T. Ibuki, CE. Brion, Chem. Phys. 151 (1991) 357. [14] W. Zhang, G. Cooper, T. Ibuki, CE. Brion, Chem. Phys. 153 (1991) 491. [15] J.W. Au, G.R. Burton, CE. Brion, Chem. Phys. 221 (1997) 151.
[16] S. Stokes, A.B.F. Duncan, J. Am. Chem. Soc. 80 (1958) 6177. [17] L. Edwards, J.W. Raymonda, J. Am. Chem. Soc. 91 (1969) 5937.
[18] P. Sauvageau, R. Gilbert, P.P. Berlow, C. Sandorfy, J. Chem. Phys. 59 (1973) 762. [19] C.Y.R. Wu, L.C. Lee, D.L. Judge, J. Chem. Phys. 71 (1979) 5221.
[20] T.N. Olney, G. Cooper, W.F. Chan, G.R. Burton, CE. Brion, K.H. Tan, Chem. Phys. 189 (1994) 733. [21] R. Locht, B. Leyh, W. Denzer, G. Hagenow, H. Baumgärtel, Chem. Phys. 155 (1991) 407.
[22] W.R. Harshbarger, M.B. Robin, E.N. Lassettre, J. Electr. Spectr. Related Phenom. 1 (1973) 319. [23] L. Karlsson, R. Jadrny, L. Mattsson, F.T. Chau, K. Siegbahn, Phys. Scripta 16 (1977) 225. [24] G. Bieri, L. Åsbrink, W. Von Niessen, J. Electr. Spectr. Related Phenom. 23 (1981) 281. [25] J.W. Gauld, L. Radom, J. Phys. Chem. 98 (1994) 777.
[26] C.L. Lugez, D. Forney, M.E. Jacox, K.K. Ikura, J. Chem. Phys. 106 (1997) 489.
[27] G. Herzberg, Molecular Spectra and Molecular Structure. III. Electronic Spectra and Electronic Structure of Polyatomic Molecules, Van Nostrand, Princeton, NJ, 1967.
[28] M.J. Frisch, G.W. Trucks, H.B. Schlegel, P.M.W. Gill, B.G. Johnson, M.A. Robb, J.R. Cheeseman, T.A. Keith, G.A. Petersson, J.A. Montgomery, K. Raghavachari, M.A. Al-Laham, V.G. Zakrzewski, J.V. Ortiz, J.B. Fores-man, J. Cioslowski, B.B. Stefanov, A. Nanayakkara, M. Challocombe, C.Y. Peng, P.Y. Ayala, W. Chen, M.W. Wong, J.L. Andres, E.S. Replogle, R. Gomperts, R.L. Martin, D.J. Fox, J.S. Binkley, D.J. Defrees, J. Baker, J.P. Stewart, M. Head-Gordon, C. Gonzalez, J.A. Pople, GAUSSIAN 94 (Revision D.4) Gaussian Inc., Pittsburgh, PA, 1996.
[29] C. Møller, M.S. Plesset, Phys. Rev. 46 (1934) 618. [30] R. Krishnan, J.A. Pople, Int. J. Quant. Chem. 14 (1978) 91.
[31] W.J. Hehre, R. Ditchfield, J.A. Pople, J. Chem. Phys. 56 (1972) 2257.
[32] T. Clark, J. Chandrasekhar, G.W. Spitznagel, P.v.R. Schleyer, J. Comp. Chem. 4 (1983) 294. [33] A.P. Scott, L. Radom, J. Phys. Chem. 100 (1996) 16502.
[34] G. Herzberg, Molecular Spectra and Molecular Structure. II. Infrared and Raman Spectra of Polyatomic Molecules, Van Nostrand, New York, 1945.