ESTIMATION OPÉRATIONNELLE DE LA FERTILITÉ DES SOLS ET ÉVALUATION DES INDICES FOLIAIRES COMME INDICATEUR DE SUIVI
DES RÉSERVOIRS NUTRITIFS DES SOLS DE LA FORÊT BORÉALE
MÉMOIRE PRÉSENTÉ
COMME EXIGENCE PARTIELLE DE LA MAÎTRISE EN BIOLOGIE
PAR
JEAN-PHILIPPE MICHEL
Service des bibliothèques
Avertissement
La diffusion de ce mémoire se fait dans le respect des droits de son auteur, qui a signé le formulaire Autorisation de reproduire et de diffuser un travail de recherche de cycles supérieurs (SDU-522 - Rév.01-2006). Cette autorisation stipule que «conformément à l'article 11 du Règlement no 8 des études de cycles supérieurs, [l'auteur] concède à l'Université du Québec à Montréal une licence non exclusive d'utilisation et de publication ,de la totalité ou d'une partie importante de [son] travail de recherche pour des fins pédagogiques et non commerciales. Plus précisément, [l'auteur] autorise l'Université du Québec à Montréal à reproduire, diffuser, prêter, distribuer ou vendre des copies de [son] travail de recherche à des fins non commerciales sur quelque support que ce soit, y compris l'Internet. Cette licence et cette autorisation n'entraînent pas une renonciation de [la] part [de l'auteur] à [ses] droits moraux ni à [ses] droits de propriété intellectuelle. Sauf entente contraire, [l'auteur] conserve la liberté de diffuser et de commercialiser ou non ce travail dont [il] possède un exemplaire.»
Je voudrais remercier en premier lieu mon directeur de recherche Alain Leduc et ma co-directrice Suzanne Brais, pour m'avoir offert la chance de travailler sur ce projet. L'implication qu'ils ont démontrée, leurs conseils, leur support et les longues heures qu'ils y ont consacrées m'ont permis de mener ce projet à bon port.
J'aimerais remercier Évelyne Thiffault, toujours prête à répondre à mes nombreuses interrogations. De plus, je me dois de souligner l'aide de David Paré, du Centre Canadien des Laurentides pour ses commentaires, son aide, et certaines analyses de laboratoire (analyses foliaires et pédologiques). Jean-Pierre Saucier et Louis Duchesne, du Ministères des ressources naturelles et de la Faune (MRNF) ont aussi participé activement à ce projet et fourni certaines données essentielles et précieuses (de l'information sur les peuplements et l'indice de qualité de station des tiges échanti llonnées).
J'aimerais aussi remercier mes aides de terrain: M'Bark Oumouhou pour avoir
volontairement et avec enthousiasme donné de son temps et de son énergie, Alfred Coulombre et André Beaumont, pour leurs compétences multiples et leurs connaissances du terrain.
Je ne pourrais passer sous silence l'aide de mes collègues de labo, qui m'ont souvent guidé, conseillé et surtout diverti.
Cette recherche a été réalisée grâce au financement du Fonds Québécois de la Recherche sur la Nature et les Technologies (FQRNT). J'aimerais remercier Bowater, Tembec et le Conseil de recherches en sciences naturelles et en génie (CRSNG) pour
m'avoir octroyé de généreuses bourses d'études.
Enfin, j'aimerais remercier ma famille, qui m'a encouragé tout au long de ma recherche et qui, de leur simple présence, me permettait d'oublier momentanément tous les petits soucis et angoisses qui ont surgi au cours de la réalisation de ce projet.
LISTE DES FIGURES vii
LISTE DES TABLEAUX ix
RÉSlIMÉ xi
INTRODUCTION 1
Aménagement durable des sols 1
Vulnérabilité des sols forestiers 1
Avenir de la récolte de la biomasse forestière .4
Objectifs 6
CHAPITRE 1 7
EVALUATION OF FOLIAR INDICATORS AS A TOOL TO MONITOR FOREST
SOIL FERTILITY 9 1.1 Abstract 9 1.2 Introduction 10 1.3 Methodology 12 1.4 Results 22 1.5 Discussion 34 1.6 Conclusion 40 1.7 Acknowledgements 40 1.8 References 42 CHAPITRE II 49
OPERATIONAL TOOL FOR ASSESSTI\IG SITES VULNERABILITY OF
QUEBEC'S BOREAL FOREST TO BIOMASS EXTRACTION 51
2.1 Abstract 51
2.2 Introduction 52
2.3 Methodology 53
2.5 Discussion 70
2.6 Conclusion 76
2.7 Acknowledgements 76
2.8 References 78
CONCLUSION 85
La durabilité de la récolte de la biomasse forestière 85
Suivi de la fertilité des sols 85
Identification des sites vulnérables 86
Recommandations 87
BIBLIOGRAPHIE 89
Figure 1.1. Stand location and species sampled 14 Figure].2. Optimum, deficiency and unbalanced level determination with the
boundary line approach: example with Balsam fir's K eND ratio and SI. ... 22 Figure 2.1. Stand location and their respective surface deposit 55
Table 1.1. Study site characteristics 13
Table 1.2. Models ID and their respective variables 19
Table 1.3. Stand characteristics 23
Table 1.4. Correlations between Ca CND ratios and ORIS bivariate ratios containing
Ca, by species 24
Table 1.5. Correlations between CND ratios, nutrient concentrations and nutrient
contents for balsam fir 24
Table 1.6. Mean nutrient concentrations (mg/g), contents (g/I 00 needles), and CND
ratios by species 25
Table 1.7. Pearson r correlations by species between foliar indicators and stand age, density, degree-days and available precipitation, where only significant
(p<0.05) correlations are shown 27
Table 1.8. RDA r2 of 1st and the 1st
+
211d axis by species and foliar indicator, with base cation nutrition explained by soil cation exchange capacity (CEC), pH(waterJ, base cation HN03, % of silt, % of clay, specifie surface area and presence/absence of a soi 1depth of less then 50cm. The p values of the first canonical axis was assessed with a Monte-Carlo test.. 29Table 1.9. Best models by species and nutrient explaining Ca CND ratios with soil
fertility variables 31
Table 1.10. Nutrition standard by species, determined by the boundary layer approach ... 33 Table 1.11. White spruce trees optimum CND ratio and nutrition range of current
year needles compared with published results and standards 39
Table 2.1. Study site characteristics 54
Table 2.2. Surface deposit classification and number of stands
in
each c1ass 58 Table 2.3. Models ID and their respective variables 61Table 2.4. Main geological units where stands were sampled (MRN, 2001) 64 Table 2.5.
sr
and surface deposit by ecological domain, sampled species andproductivity classes 65
Table 2.6. Akaike's information criterion and derived measures of 10gistic
regression models for site productivity 66
Table 2.7. Best model: model 10 67
Table 2.8. Minimum, maximum and mean SI50 by species as a function of surface
deposit 68
Table 2.9. Contingency table of the proportion ofsites on different surface deposits
as a function of slope position 70
Table 2.10. Comparison between this study and Grondin el al. (1999, 2000) of
Les pluies acides, la plantation d'arbres à croissance rapide, des rotations plus courtes et la récolte par arbres entiers accentuent la pression sur les sols forestiers, et pourraient en diminuer la fertilité à long terme. Afin d'assurer le maintien de la productivité des stations forestières, les sites vulnérables à la déplétion de leurs nutriments doivent être identifiés afin d'y limiter l'extraction de biomasse forestière. Par la suite, un suivi devrait être effectué afin de vérifier l'efficacité des mesures mises en place.
Le premier chapitre de ce mémoire évalue le potentiel de la nutrition foliaire comme indicateur de suivi de la fertilité des sols. Cent quatre-vingt-onze stations furent échantillonnées pour déterminer les relations entre la nutrition, la fertilité du sol et la productivité. La nutrition du sapin baumier (Abies balsamea), de l'épinette noire (Picea mariana), de l'épinette blanche (Picea glauca) et du pin gris (Pinus banksiana) a été évaluée à l'échelle de la forêt boréale québécoise. Chaque essence s'est avérée avoir un profil nutritionnel distinct. La nutrition foliaire du sapin baumier, de l'épinette blanche et du pin gris répondait davantage aux gradients de fertilité du sol que celle de l'épinette noire. La capacité d'échange cationique (CEC) et le pH du sol ont démontré de plus fortes et consistantes corrélations avec la nutrition foliaire que les variables physiques du sol (texture, surface spécifique et profondeur). Entre la concentration en nutriments des aiguilles, le contenu en nutriments de 100 aiguilles et les ratios multivariés des concentrations foliaires (CND), la dernière méthode semble plus fortement liée à la fertilité des sols. L'âge du peuplement, la densité et les variables climatiques ont des effets variés sur la nutrition foliaire, mais souvent faibles et limités, suggérant la possibilité d'utiliser la nutrition foliaire comme indicateur sur de larges gradients environnementaux. Des normes CND établies avec la méthode « boundary-line » indiquent que la nutrition d'une importante proportion de peuplement est déjà déficiente en calcium et potassium. Donc, le suivi des réservoirs nutritionnels devraient figurer parmi les enjeux importants d'aménagement forestier.
Dans le second chapitre, la productivité de plus de 400 sites déterminée à l'aide de l'indice de qualité de station (IQS), de la surface terrière et de la végétation indicatrice de sous-bois, a été mise en relation avec des variables climatiques et pédologiques. À une échelle régionale, les concentrations en cations basiques du sol évaluées à l'aide de 80 000 échantillons de sédiments de lacs et rivières provenant de la prospection minière sont faiblement corrélées à la productivité dans les modèles testés. La position sur la pente, le drainage, le dépôt de surface, le nombre de degrées jours et les précipitations utiles formaient le modèle le plus apte à prédire la productivité. Un peuplement sur un dépôt à texture grossière, dépôt mince ou sur un
affleurement rocheux a respectivement 6,],7,7 et 21,5 fois moins de chance qu'un site sur dépôt argileux d'être dans une classe de bonne productivité. Les sites en haut de pente à bon drainage ainsi que les sites présentant un drainage imparfait ont aussi été identifiés comme étant moins productifs. Ces résultats suggèrent que des sites vulnérables à la récolte de la biomasse forestière pourraient être faci lement identifiés à l'aide de variables cartographiées comme le dépôt de surface, la position sur la pente et le drainage.
Aménagement durable des sols
Dans le cadre de la Conférence des Nations Unies sur l'Environnement et le Développement en 1992, le Canada a reconnu l'importance de l'aménagement forestier durable et signé la Déclaration de principe sur les forêts. Suite à cette conférence, le Conseil Canadien des Ministres des Forêts (CCMF) a développé des critères et indicateurs permettant de suivre l'évolution de l'aménagement durable des
forêts (CCMF, 2003). Le Ministère des Ressources Naturelles et de la Faune du Québec (MRNFQ), suivant la démarche du CCMF, a adopté une liste de six critères d'aménagement forestier durable. Le maintien de la fertilité des sols, une composante incontournable de la foresterie durable, est mis de ['avant à travers ces critères. De plus, la venue des « Objectifs de protection et de mise en valeur des ressources du milieu forestier» définis par le MRNFQ a fait en sorte que les plans généraux d'aménagement forestier doivent désormais viser à réduire l'impact des activités anthropiques sur les sols (MRNFQ, 2006). La préservation de la fertilité des sols est
aussi une partie importante du processus de certification forestière. Les normes du « Forest Stewardship Council (fSC) » et du « Canadian Standards Association (CSA)>> indiquent clairement l'importance de maintenir la fertilité des sols pour avoir accès à ces certifications (FSC, 2004 ; CSA, 2002).
Vulnérabilité des sols forestiers
Par contre, avec les pluies acides et l'intensification des pratiques sylvicoles, comme la plantation d'arbres à croissance rapide, des rotations plus courtes et la récolte par arbres entiers, les pressions sur les sols forestiers se font grandissantes.
Les pluies acides, principalement causées par l'activité anthropique, apportent
sur le territoire forestier des quantités importantes d'acide sulfurique (H 2S04) et
nitrique (HN03). Ces acides se dissocient et augmentent les concentrations de H+
dans le sol. L'acidité du sol sera en partie tamponnée par la dissolution des complexes Al-OH en A1 3+ et H20. Les H+ et AI3+ libres peuvent déplacer les cations basiques (Ca2+, Mg2+, K+ et Na2+) des sites d'échanges, causant le lessivage de ces derneirs (Bélanger, 2000; Galloway et al., 1983; DeHayes et al., 1999). Les cations basiques
ainsi lessivés dans les bassins versants peuvent être supérieurs aux apports de cations par altération de la roche mère et par déposition atmosphérique, pouvant ainsi causer une pelie nette de cations basiques hors l'écosystème. Cet appauvrissement des sols a été observé sur celiains sites de la forêt boréale (Duchesne et Houle, 2006). De plus, lorsque l'apport de H+ dans un écosystème est supérieur au pouvoir neutralisant de son sol, une acidification nette du sol peut se produire. Les pluies acides peuvent donc appauvrir les sols forestiers en acidifiant le sol et en lessivant une partie des cations basiques présents.
Les arbres à croissance rapide cultivés au Québec peuvent augmenter sensiblement la production de la biomasse forestière sur certains sites. Par exemple, le peuplier hybride, en conditions normales moyennes, a un accroissement annuel moyen (AAM) de 11 ,6m3 . ha-' . an'!, comparativement à 3,3m3 . ha-I . an'{ pour le peuplier faux-tremble et 1,8 m3 . ha" . an-I pour l'épinette noire (Ménétrier, 2008).
Cette production accrue de biomasse entraîne une exportation plus élevée de nutriments lors de la récolte (Adegbidi et al., 2001). De surcroît, la diminution de la période entre deux récoltes, observée sur l'ensemble du Québec, réduit l'âge moyen des arbres récoltés (Cyr et al., 2009). Les arbres plus jeunes, moins efficaces dans leur utilisation de nutriments, produisent une biomasse avec des concentrations nutritionnelles plus élevées (Paré et al., 2002; Adegbidi et al., 2002).
Conséquemment, les arbres à croissance rapide et les rotations écourtées amplifient l'exportation de nutriments en augmentant le volume de bois récolté et les concentrations nutritionnelles de ce bois.
De plus, la croissance des arbres entraîne une acidification des sols, ce qui peut augmenter le lessivage des cations basiques hors de l'écosystème forestier. Les racines des arbres relâchent des ions H+ lors de l' absorbtion de cations basiques et d'ammonium (NH4+) (Bélanger, 2000; Nilsson et al., 1982; Matzner et Ulrich,
1987). Normallement, cette augmentation de H+ est contrebalancée par la décomposition d'arbres arrivés à maturité qui retournent les cations basiques dans le sol. Par contre, la récolte forestière vient briser ce cycle, pouvant entraîner les mêmes conséquences qu'énumérées précédemment pour les pluies acides (Federer et al.,
1989).
La nitrification, processus par lequel certains micro-organismes oxydent l'ammoniac en nitrate, libère des H+ dans le sol. La nitrification est favorisée par une augmentation de la température et de l'humidité du sol. La récolte forestière favorise ces conditions et cause ainsi une augmentation de la nitrification, de l'acidification des sols et du lessivage des cations basiques (Dahlgren et Driscoll, 1994).
Cependant, certaines études ont démontré qu'une augmentation de la croissance des arbres peut parfois s'accompagner d'une augmentation à court terme de la disponibilité des cations basiques dans le sol (Bélanger et al., 2004; Quideau et al.,
1996). Ce phénomèene pourrait être expliqué par le fait que certaines espèces d'arbres peuvent augmenter la libération des cations basiques par l'altération des roches et augmenter la rétention des cations basiques dans le sol (Bélanger et al.,
2004). Les arbres peuvent avoir une influence importante sur les sols selon la qualité de leur litière, l'étendue et la profondeur de leurs racines ou encore selon leur rhizosphère (Augusto et al., 2002). Par contre, même si la croissance rapide de
certaines espèces peut être bénéfique à court terme au niveau de la capicité d'échange cationique, probablement que cette augmentation se fait au détriment des réservoirs à long terme de cations basiques dans le sol (Quideau et al., 1996).
La coupe forestière entrai ne une exportation nette de nutriments beaucoup plus importante que les feux de forêts ou autres perturbations naturelles (Thiffault et al.,
que les méthodes par troncs entiers (Paré et al., 2002; Weetman et Webber, 1972).
Étant donné les concentration nutritionnelles élevées dans les branches et le feuillage, l'exportation de nutriments découlant de la récolte par arbres entiers est de deux à quatre fois supérieure à celle engendrée par une coupe par troncs entiers (Paré et al., 2002). Les pertes causées par la récolte par arbres entiers dépendent de la distribution de la biomasse dans les différentes parties de l'arbre, et peuvent donc varier d'une espèce à l'autre. Par exemple, Paré et al. (2002) suggèerent que les pertes sont plus
importantes pour les peuplements de sapin baumier que de pin gris.
Les réservoirs en cations basiques sont probablement plus sensibles à l'exportation de la biomasse que l'azote et le phosphore (Fisher et Binkley, 2000; voir §3.1.4), puisque l'apport en cations basiques par déposition atmosphérique est faible par rapport èa l'azote (Grigal, 2000). La récolte par arbres entiers peut ainsi diminuet· les réservoirs nutritifs basiques des sols (e.g. Brais et al., 1995; Bélanger et al., 2003;
Pennock et Kessel, 1997; ülsson et al., 1996; Duchesne et Houle, 2006) et éventuellement, les acidifier (Bélanger et al., 2003). Ces changements pédologiques
sont susceptibles d'affecter la vigueur des arbres, leur résistance aux stress
environnementaux comme le gel (DeHayes et al., 1999) et les maladies (McLaughlin et Wimmer, 1999), ainsi que leur nutrition (Thiffault et al. 2006). Finalement, les
changements pédologiques induits par la récolte par arbres entiers peuvent entraîner une réduction de la croissance des arbres et de la productivité des peuplements (Egnell et Valinger, 2003 ; Mann et al., 1988).
Avenir de la récolte de la biomasse forestière
Des efforts ont été consentis à dim inuer la récolte par arbres entiers dans la dernière décennie, et celle-ci est passée d'environ 92% des surfaces récoltées à seulement 49% en 2004 (MRNFQ, 2008). Par contre, dans les dernières années, cette tendance semble s'inverser. Avec l'augmentation des prix du pétrole, et avec la recherche de sources stables et renouvelables d'énergie, il devient profitable
d'exploiter le contenu énergétique des branches et du feuillage. Ces résidus forestiers, présentement laissés sur les sites de coupes, pourraient être utilisés dans des usines de cogénération, ou pourraient même servir à synthétiser des biocarburants dans un avenir rapproché. En effet, il est désormais possible de développer des biocarburants à partir des branches, des feuilles et même des souches des arbres (Robert, 2007). De nouvelles usines expérimentales dédiées à la conversion de cette biomasse forestière sont présentement fonctionnelles et en construction en Amérique du Nord, et cette avenue est financée massivement par les gouvernements (Schubert, 2007). Cette technologie se développera probablement rapidement au cours des prochaines années, engendrant une demande pour les résidus forestiers. Avec l'augmentation de la récolte par arbres entiers en vue de satisfaire ces besoins énergétiques, la pression sur les sols forestiers risque de s'accroître.
Le plan d'action vers la valorisation de la biomasse forestière, déposé récemment par le MRNFQ, oriente clairement la foresterie vers cette avenue (MRNFQ, 2009) :
« Le plan d'action visant la valorisation de la biomasse forestière pourrait
permettre l'utilisation de 1,5 million de tma de biomasse forestière par
année, soit 22,6% du volume disponible, et entraînera la création de 850
emplois dans les régions du Québec, dont 680 enforét.»
Dans ce contexte, il devient essentiel de mettre en place des directives permettant d'encadrer la récolte de la biomasse forestière, et d'effectuer un suivi de la fertilité des sols du Québec. Les directives devront être opérationnelles pour l'ensemble de la province, facilement applicables pour l'industrie, et devront se baser sur les meilleures données et connaissances disponibles.
Il sera donc nécessaire d'identifier les sites forestiers vulnérables à une diminution de leur fertilité par l'exportation de leur biomasse forestière et de développer des indicateurs de suivi de la fertilité des sols.
Objectifs
Ce projet comp0l1e deux objectifs principaux correspondant à deux chapitres distincts du mémoire:
(1) Identifier des indices foliaires sensibles aux variations de la fertilité des sols et pouvant servir d'indicateurs des impacts de la récolte de la biomasse sur les réservoirs nutritifs.
(2) Développer un outil opérationnel à l'échelle de la province pouvant servir à identifier les sites vulnérables à une exportation accrue de nutriments.
SOIL FERTILITY
Jean Philippe Michela,b, Alain Leduca,b, Suzanne Braisb,c
This article was written by Jean-Philippe Michel and reviewed by Alain Leduc and Suzanne Brais.
a Université du Québec à Montréal (UQAM), Département des Sciences Biologiques, CP 8888, succursale Centre-Ville, Montréal, Québec, Canada, H3C 3P8
b Center for forest research, Université du Québec à Montréal, Dépal1ement des Sciences Biologiques, CP 8888, succursale Centre-Ville, Montréal, Québec, H3C 3P8
c Université du Québec en Abitibi (UQAT), Département des Sciences Appliquées, 445 boulevard de l'université, Rouyn-Noranda, Québec, Canada, J9X 5E4.
1.1 Abstract
Acid rain, intensive forest management practices and forest biomass industry development apply significant pressure on forest soils and may deplete forest soil base cation pools. It becomes important to identify sites vulnerable to fertility decline and develop operational indicators to monitor soil fertility on provincial scale.In order to evaluate and monitor base cation pool status, foliar indicators have been evaluated for 4 conifer species (balsam fir, black spruce, jack pine and white spruce) on a wide geographicaJ and soil fertility range of Eastern Canadian boreal forest. Each species had a distinct nutrition profile, and was analysed separately. Cationic exchange capacity (CEC) and pH displayed stronger and more consistent correlations with foliar indicators than physical variables (e.g. percentage of fine texture material, soil specific surface and depth). Between foliar nutrient concentrations, nutrient content in 100 needles and compositional nutrient diagnostic (CND) ratios, the latter had the strongest fit with soil fertility variables. White spruce, jack pine and baJsam fir foliar CND ratios were more strongly correlated with soil fertility than black spruce foliar nutrients. Stand age, density and climatic variables had conflicting effects on nutrition that were often weak and limited, suggesting the possible use offoliar indicators on a wide environmental range. Foliar CND norms established with a boundary-line approach gave results comparable with other similar studies. Those norms indicate that an important proportion of stands are already Ca or K deficient. Consequently, monitoring soil base cations should become an important forest management issue in the future.
Keywords: foliar nutntlOn , ORIS, CND, concentration content, soil fertility,
1.2 Introduction
Preservation of soil fertility is a key issue of sustainable forest management and a prerequisite to obtain forest certifications such as the Forest Stewardship Council and the Canadian Standards Association certifications (FSC, 2004; CSA, 2002). However, acid rain, shorter rotation, plantation of fast growing species and whole tree harvesting (WTH) accentuate pressures on forest soils and may jeopardize their long term fertility.
Intensification of silviculture practices can increase ecosystem nutrient losses by increasing nutrient uptake by vegetation and rate of harvesting. For example, plantation of hybrid poplars - with a mean annual increment rate three to seven times higher than those of trembling aspen and black spruce (Ménétrier, 2008) dramatically enhances soil nutrient immobilization by tree biomass. In addition, with the growing bio fuels industry, harvesting of leaves, branches and tree tops (WTH) for energy conversion will probably increase (MRNF, 2009). The higher nutrient concentrations in branches and leaves (Mann et al., 1988) augment 2 to 3 folds WTH nutrient exportation in comparison to stem only harvesting (SOH) (Paré et al., 2002; Yanai, 1998; Foster and Morrison, 1987). Increased biomass harvesting and increase in biomass nutrient concentrations both require more nutrients from forest soils. Finally, acid rain can increase leaching of soil bases cations by repJacing them with H+ on exchange sites (Driscoll et al., 2001; DeHayes et al., 1999).
Many studies in the boreal forest have repol1ed nutrient outputs following harvesting exceeding CUITent atmospheric and weathering inputs (Sverdrup and Rosen, 1998; Duchesne and Houle, 2008; Duchesne and Houle, 2006), suggesting a possible upcoming depletion of those nutrients in forest soils. The negative balance between input and output seems to be more acut , for base cations than nitrog n and phosphorus (Fisher and Binkley, 2000; Morris, 1997).
In this context, it is important to monitor soil fertility and ensure that our current practices are sustainable. We need ta identify indicators that reflect sail
fertility, sensitive to changes induced by anthropogenic or natural disturbance, valid on a wide variety of sites, easy to measure and inexpensive to sample (Schoenholtz et al., 2000). Foliar nutrient concentrations of trees could possess those criterions, and
they present the advantage of integrating a large soi! volume influencing the capacity of trees to access soil nutrients (Fisher and Binkley 2000).
The objective of this study is to evaluate the potential of fol iar nutrient concentrations as indicators of forest soil fertility within Quebec's boreal forest. Several steps will be taken in order to achieve this objective. Needles from balsam fir (Abies balsamea), black spruce (Picea mariana), white spruce (Picea glauca) and jack pine (Pinus banksiana) will be sampled and analysed with different expressions
of foliar concentrations and ratios : absolute foliar nutrient concentration, foliar nutrient content (Walworth and Summer, 1988), Diagnosis and Recommendation Integrated System (ORIS) (Beaufils 1973), and Compositional Nutrient Diagnostic (CND) (Parent and Dafir 1992). The four tree species were chosen because of their abundance in Eastern Canad ian boreal forest and their nutrition requirement differences. The differences will first be highlighted by comparing foliar nutrient means between species.
Species and foliar analytical techniques will be evaluated individually in order to identify which one constitutes the best soil fertility indicator. A good indicator wiJ1 have to be sensitive to soi 1 fel1i 1ity variation and usable on a wide range of environment conditions. Simple correlations between foliar indicators and environmental variables will be performed and redundancy analysis will be used to evaluate the global fitness between different indicators and soil fertility variables. The foliar nutrient analysis technique that wiJ1 give the best results will be used to develop foliar indicators. The effects of soil on this indicator will be analysed more closely by evaluating with multiple regressions the relationship between different soil fertility models and foliar nutrition. Finally, the relationship between foliar nutrition and productivity will be assessed with a boundary line approach (Vizcayno-Soto and Côté, 2004; Quesnel et al., 2006) in order to establish norms that could indicate
stands with or close to nutrient deficiencies. The boundary-line approach is useful to establish foliar nutrition standards in varying environment.
1.3 Methodology
Studyarea
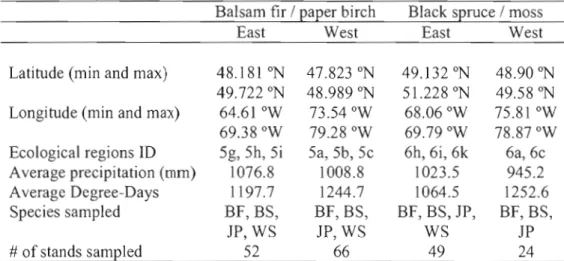
The study was conducted in the balsam fir / paper birch and the black spruce / moss domains of Quebec's boreal forest. The two domains differ by the species' composition of late successionnal stages. Each of them is subdivided in 2 sub domains (Table 1.1). The balsam fir / paper birch east sub-domain receives more precipitation and has a rougher landscape than its western counterpart. East and West black spruce / moss sub-domains differ also by their annual precipitation, which results in longer fire cycles in the East (Saucier et al., 1998). The study area covers part of the Precambrian shield and Appalachian geoJogic region. The bedrock is covered with Quaternary deposits (Landry and Mercier, 1992). Quaternary deposits vary from sMdy to clay soils- and from rock ôutcrop to deep lûose soil. Surface deposit distribution is unequal, with regions predominantly on fine texture deposits, like the clay belt region (Vincent and Hardy, 1977), and regions composed mostly of tills and coarse texture deposits like Quebec's Nort Shore region. Plots were sampled between 47.8° - 51.2° north, and 64.6° - 79.3° west. Annual temperature varies from 2,3°C to 3,3°C and the total precipitation from 863 mm to 1223 mm.
Table 1.1. Study site characteristics
Balsam fir / paper birch Black spruce / moss
East West East West
Latitude (min and max) 48.181 0
N 47.823°N 49.132°N 48.90 oN 49.722 oN 48.989 oN 51.228 oN 49.58 oN Longitude (min and max) 64.61 °W 73.54°W 68.06°W 75.81°W
69.38°W 79.28°W 69.79°W 78.87°W
Ecological regions ID 5g, 5h, 5i 5a, Sb, 5c 6h, 6i, 6k 6a, 6c
Average precipitation (mm) 1076.8 1008.8 1023.5 945.2
Average Degree-Days 1197.7 1244.7 1064.5 1252.6
Species sampIed BF, BS, BF, BS, BF, BS, jp, BF, BS,
jp, WS jp, WS WS jp
# of stands sampled 52 66 49 24
Longitude, latitude, and climatic variables statistics were determined from sampled stands. Ecological region ID corresponds to Quebec's ecological classification (Saucier et al., 1998). Only ecological regions with at least one sampled stand are presented in this table. Species sampled were balsam fir (BF), black spruce (BS), jack pine (JP) and white spruce (WS).
QUÉBEC Plots e M M Species While Spl'"uce Black Sprue.
j
M JackPine NW
BalsamFlrONTARIO Bioclimatic Domains
c::3 Spruce-moss /J
-
.
W Balsam fir-white birch_ Montréal
USA ~-~'00:====7'20~m
PIOj.ut:l1'l N:.D,!!lëI) CLIfltlfot l .. n't!#lll
AIAft(lI CEF.
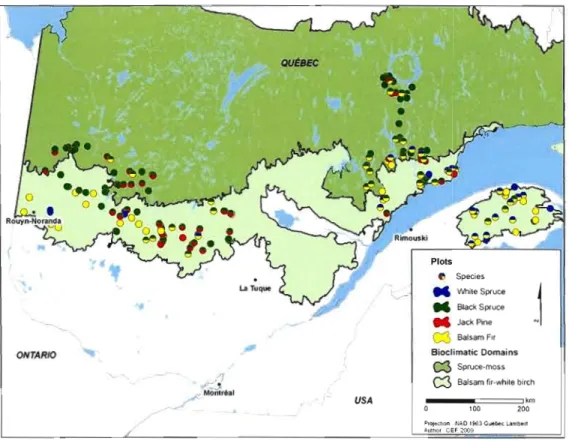
Figure 1.1. Stand location and species sampled.
Stand selection
Using Quebec's ecological classification (Saucier et al., 1998), 191 stands were selected to represent the main physica1 (topography, texture and drainage) and biological (forest cover and potential vegetation) characteristics of their ecological region. The selected sites covered 22 different geological units (MRN, 2001) and a wide array of surface deposits representing a large soil fertility gradient. Stands supported by organic deposits have not been selected for this study. Ali stands were at least 50 years old and preferably more than 70 years old. Forest cover density was over 40%, and slope inclination inferior to 50%. Most sites had a mesic to sub-xeric water regime.
Field methods
Geographical coordinates, altitude, slope and aspect were noted for each stand. A sampling plot (400m2) was located and ail trees with a diameter at breast height (DBH) over 9 cm were numbered by species. Five or more dominant trees per species
were harvested for stem analyses. Only straight trees with no apparent default and of at least 50 years were retained for the analysis. Each selected tree was cut and disks were taken at 0.15m, 0.60m, 1.0m, 1.3m, 3.0m and at each additional 2 meters until
the apex of the stem. On most plots, two different species were sampled. Additionnai details on sampling methods are given in the forest inventory manual of the Quebec government (MRNF, 2006).
Surface deposit origin and depth were noted (MRNF, 2006). For each plot, three soil samples were collected with an auger between 20 and 30 centimetres in the
minerai soil. Samples were pooled in the same bag. For podzolic soils with a Ae horizon, soit samples were always taken beneath the eluviate horizon.
Foliage sampling took place in the autumn of 2008. To limit seasonal variability in nutrient concentrations, foliar sampI es were taken after tree hardening
(UN/ECE-EC, 2000). On each plot, 5 dominant and healthy trees per species were
selected. Foliage samples of current year needles were collected with a shotgun from three branches of the upper third of the crown. Foliage was collected from aIl species sam pied for stem analyses and samples of the same species were pooled for each
stand.
Laboratory methods
Growth measurements were taken with binoculars and digitized with WinDendro software on four radiuses for the first 4 disks and on 2 radiuses for the following ones (Zarnovican, 1985). Height and diameter growth was then reconstructed using the ANATI software (MRNF, 2006). Growth delays caused by external factors, like spruce budworm or oppression, were corrected following the methodology described in Quebec's forest inventory standards (MRNF, 2006). A
mean site index (SI) was attributed by species for each plot based on average height at age 50 of ail sampled trees. From a total of 191 plots, SI was obtained from 87 balsam fir plots, 132 black spruce plots, 31 white spruce plots and 56 jack pine plots. The age of the stand was estimated from mean age of the dominant trees.
Mineral soil samples were dried at room tempe rature and sieved (2mm). The relative proportion of clay «0,002mm), silt (>0,002mm and <0,05mm) and sand (>0,05mm and <2mm) was determined by granulometric analysis (Carter 1993). Mineral soil specifie surface was calcuJated according to Jonsson et al., (1995):
Se = 0,003*sand + 0,022*silt + 0,08*clay (1)
Mineral soil pH in distilled water (pHwaler) was determined with a glass electrode-calomel system using 1 part of soil for 2 parts of solution. Exchangeable cations were determined following an extraction with an unbuffered BaCh solution (Hendershot et al., 1993). To measure the proportion of Ca, Mg and K that is not readily availabJe to trees but that could be released from soil minerai weathering, we
used a weak digestion. Thus, soil samples were leached for one hour in a 10% HNO] solution and hot HCI. Potassium was determined by atomic emission, and Calcium and Magnesium by atomic absorption on a Varian AA spectrometer.
Foliage samples were dried at 60°C for 48 hours. Aftenvards, 100 needJes of each sample were weighted and mass per needle was determined. Total cations and P were determined following calcination at 500°C and dilution with hydrochloric acid (Miller, 1988). Cations were analysed by atomic absorption and P by colorimetry (Lachat Instruments, Milwaukee, Wisconsin). Total N was measured by a CNS analyzer.
Average nutrient content in 100 needles was calculated for each sample from foliar concentrations and needle mass. Also, DRIS bivariate ratios were calculated for each sample (Beaufils, 1973; Walwort and Summer, 1987). DRIS technique uses ail possible ratios between the mass oftwo eJements:
Element Xt mass Drymattennass Element Xt mass
= (2)
Element JS mass Drymattennass Element JS mass
With DRIS ratios, deficiencies are not calculated by the absolute concentration of an element, but by imbalance of a nutrient compared to another. Finally, CND ratios were established foll owing Parent and Dafir (1992) method:
R = 1000 - (N + P + K. + Ca + Mg) (3)
Where R is the filling value and where nutrients are in g/kg.
g = (N
*
P * K * Ca" Mg* R)'/6
(4)Where g is the geometric mean of foliar nutrients
CND(Ca)
=
ln (ca/g) (5)Where CND(Ca) is the CND ratio for Ca, a log centered multivar.iate ratio.
Degree-days and available precipitation are believed to be important cJimatic factors influencing productivity (Hamel et al., 2004; Pinno, 2009; Ung et al., 2001). Both variables were derived from stand longitude, latitude, elevation, slope and aspect using BlOSIM (Régnière 1996). BIOSIM matches geographical coordinates of a given site to c1imatic data from 1965 to 1998 collected in 120 Quebec stations. This data is then adjusted to specified elevation, slope and aspect. Using c1imatic data generated by BIOSIM has the advantage of keeping models simple white capturing the most important information from c1imate proxies like longitude, latitude,
Statistical analysis
Tukey-Kramer tests were used to compare foliar nutrients mean between species. Due to the important foliar nutrition differences between species, the following analyses were conducted on individual species. Complementarity and
divergence between different foliar nutrition indices were assessed by means of Pearson correlations. Also, correlations between foliar indices and stand density, age, degree-days and available precipitation were performed to evaluate the validity of foliar indices on a large variety of sites.
For each species and each nutritional index, the link between soil fertility and foliar base cations was explored with redundancy analysis (RDA) (ter Braak and Smilauer 1998). Redundancy analysis is an extension of multiple regressions, with a set of response variables correlated to a set of explanatory variables (Legendre and Legendre, 1998). The different variables used to describe soil fertility were soil texture, soil specifie surface area, soil depth, pH(water), exchangeable cations (CaCEC, MgCEC and KCEc) and HN03- leached cations (CaHNo3, MgHN03and K HN03).
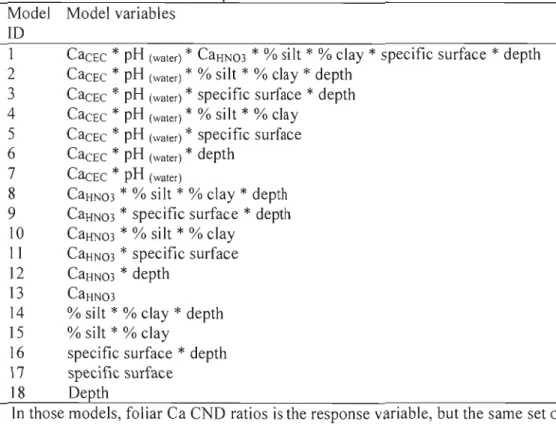
To understand the influence of soil characteristics on individual indices of tree nutrition, different soil fertility models were constructed (Table 1.2) and tested with multiple regressions - the first model being the general model containing ail variables and the other model subsets of the generaJ mode!. Each model was a combination of variables from five groups of variables: base cations short-term availability (exchangeable cations and pH), acid extractable base cations (base cations HN0 3), soil texture (% of silt, % of clay), soil specifie surface, and presence/absence of a soil depth of less than SOcm. Except for the general model, no model had two variables from similar groups of variables. For example, base cations short-term avaiJability and acid extractable base cations are two different estimators of soil nutrients and consequently, those variables were never included in the same mode!. The same was
Table 1.2. Models ID and their respective variables. Madel Madel variables
ID
1 CaCEC
*
pH (water)*
CaHNo3*
% silt*
% clay*
specifie surface*
depth2 CaCEC
*
pH (water)*
% silt*
% clay*
depth3 CaCEC
*
pH (water)*
specifie surface*
depth4 CaCEC
*
pH (waler)*
% silt*
% clay5 CaCEC
*
pH (water)*
specifie surface6 CaCEC
*
pH (water)*
depth7 CacEC
*
pH (waler)8 CaHN03
*
% silt*
% clay*
depth 9 CaHN03*
specifie surface*
depth 10 CaHN03*
% silt*
% clayIl CaHN03
*
specifie surface 12 CaHN03*
depth13 CaHN03
14 % silt
*
% clay*
depth 15 % silt*
% clay16 specifie surface
*
depth 17 specifie surface18 Depth
ln those models, foliar Ca CND ratios is the response variable, but the same set of models were used for foliar CND Mg and K
Models were tested separately for each tree species and nutrient CND ratios (Ca, Mg and K) by means of linear regressions.
Model selection was based on Akaike's Information Criterion (AIC) where:
AIC
=
-2(1og-likelihood) + 2K (6)and k is the number of parameters used in the mode!.
The Akaike weight was then calculated to compare models between them:
Wi = exp(-11/2) / Lr=1 exp(-11/2) (8)
where I1j is a relative measure of model i compare with the best model (min AIC), Wi is the Akaike weight which provides a measure of strength of the model i relative ta
the whole set of models r. This method allows comparing different soil fertility models based on their ability to predict foliar nutrition as weil as their simpJicity (Burnham and Anderson, 2002).
Critical concentrations assessment by the boundary fine approach
ln order to efficientJy establish the link between foliar nutrition and stand productivity for a wide study area including a large variation in soils conditions, a boundary line-approach can be used (Vizcayno-Soto and Côté, 2004; Quesl1el et al., 2006). This method was performed separately for each species and nutrients CND ratio (N, P, Ca, Mg and K).
Each nutrient range was first divided in Il segments of equal length. The number of segments had to be large enough to calculate a boundary layer curve, but small enough to avoid having sub-optimal nutrition points. In each segment, only the stand with maximum SI was retained, whiJe other stands were considered as having sub-optimal growth, limited by a factor other than nutrition. Due to limited sample size, it is possible that some of the 11 stands retained sti Il show sub-optimal growth for a nutrient level. To detect and eliminate those points, the following criterion was used:
Yi < Yi' ll and Yi+nand Y/[(Yj.n
+
Yi+n)/2] <90% (9)Where Yi is the SI of the segment i, and Yi-n and Yi+n the SI of adjacent
segments ifn=l, and of the second adjacent points for n=2.
A quadratic regression of SI as a function of each nutrient CND ratio was then computed with the remaining boundary points:
y = ax2
+
bx+
C (10)Where y is the SI and x is the CND ratio.
The optimum nutrient CND ratio was detennined with this equation:
Optimum = -b/2a (11 )
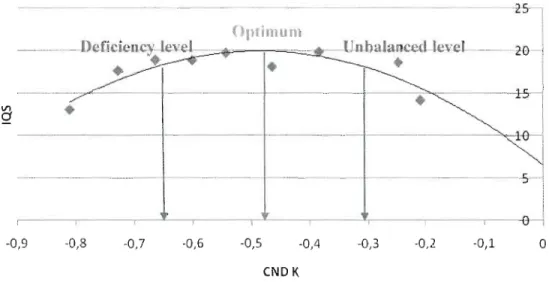
The optimum nutrition range was bounded by the two points corresponding to 90% of the maximum growth (Fig. 1.2). Stands under that range were considered as
having a nutrient deficiency, while stands with a nutrient eND ratio over that range were considered as having an unbalanced nutrition negatively affecting productivity. A nutrient range was not computed if the quadratic regression had a p value under 0.10, the deficiency level was not computed if no stand was beneath the optimum range, and the unbalanced level was not computed if no stand was above the optimum range.
_ _---,_ _---,_-L--, ----,--L----,---Ir-.--,....---..,---e~
-0,9 -0,8 -0,7 -0,6 -0,5 -0,4 -0,3 -0,2 -0,1
°
CNDK
Figure 1.2. Optimum, deficiency and unbalanced level determination with the boundary line approach: example with Balsam fir's K eND ratio and SI.
lA Results
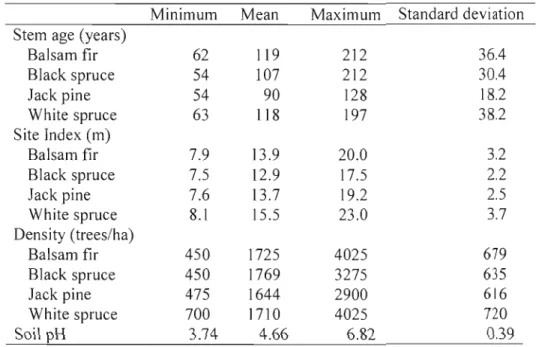
Stand characteristics
Based on surficial geology, about 45% of sampled stands grew on medium texture soil (till deposits), 20% on fine texture soil (glaciolacustrine deposits), 20% on coarse texture soil (fluvioglacial deposits) and 15% on shallow till deposit or bedrock. A large variation in dominant tree age and in tree density was observed (Table 1.3). There was also a large variation in stand potential productivity, with the largest variation observed for white spruce (Table 1.3). Soils pH ranged from acid (3.7) to neutral (6.8).
Table
1.3.
Stand characteristicsMinimum Mean Maximum Standard deviation Stem age (years)
Balsam fir
62
119
212
36.4
Black spruce54
107
212
30.4
Jack pine54
90
128
18.2
White spruce63
118
197
38.2
Site Index (m) Balsam fir7.9
13.9
20.0
3.2
Black spruce7.5
12.9
17.5
2.2
Jack pine7.6
13.7
19.2
2.5
White spruce8.1
15.5
23.0
3.7
Density (trees/ha) Balsam fir450
1725
4025
679
Black spruce450
1769
3275
635
Jack pine475
1644
2900
616
White spruce700
1710
4025
720
Soil pH3.74
4.66
6.82
0.39
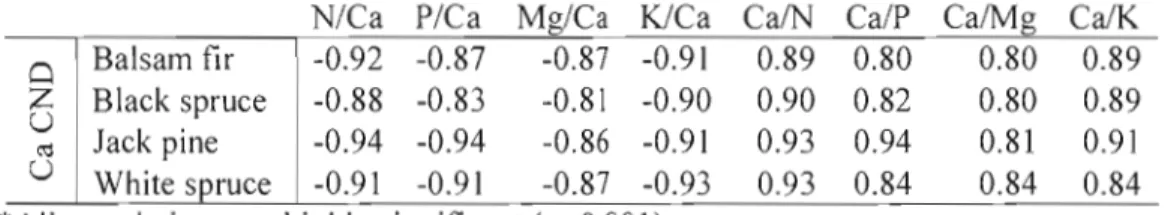
Correlations between foliar indicators
Strong correlations between CND ratios and ORIS bivariate ratios were found (Table 1.4, results with Mg and K are similar to those of Ca but not shown). Because of ORIS 's ratios high dimensionality and their strong correlations with CND, ORIS ratios were not retained for the rest of this study. Strong correlations between CND ratios, foliar nutrient concentrations and contents were also observed (Table
1.5,
results with black spruce, jack pine and white spruce are similar to those ofbalsam fir but not shown). The strongest correlations were between CND ratios and foliar nutrient concentrations.
Table 1.4. Correlations between Ca CND ratios and ORIS bivariate ratios containing Ca, by species
N/Ca PICa MgICa K/Ca CaIN Ca/P CalMg Ca/K Balsam fir -0.92 -0.87 -0.87 -0.91 0.89 0.80 0.80 0.89
a
;Z Black spruce -0.88 -0.83 -0.81 -0.90 0.90 0.82 0.80 0.89u
ro Jack pine -0.94 -0.94 -0.86 -0.91 0.93 0.94 0.81 0.91 U White spruce -0.91 -0.91 -0.87 -0.93 0.93 0.84 0.84 0.84 *Ail correlations are highly significant (p<O.OO 1).Table 1.5. Correlations between CND ratios, nutrient concentrations and nutrient contents for balsam fir
Concentration (g/kg) Concentration (g/kg) Content (g/ 100 need les)
vs vs vs
content (g/I 00 needles) CND ratio CND ratio
N 0.659** 0.683** 0.331 * P 0.867** 0.951** 0.812** Ca 0.832** 0.927** 0.735** Mg 0.749** 0.869** 0.551 ** K 0.710** 0.835** 0.482** *Significant correlations (p<0.05)
- **Highly significant correlations (p<O:OOI)
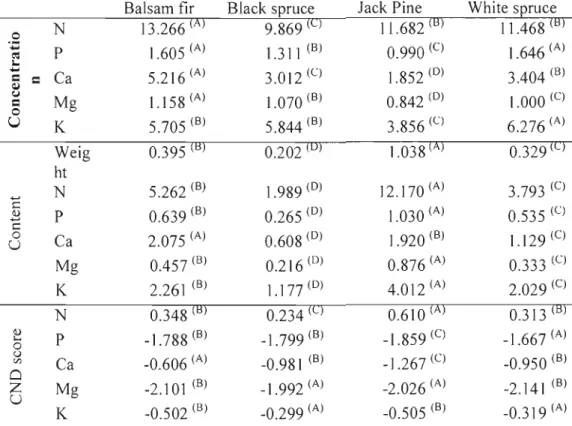
Variability offoliar indicators
Nutrition differences between species were evaluated by comparing means by nutrient, by species and by foliair indicator. Significant nutritional differences were found between species. Average weight of 100 needles for black spruce was 0.202g, compared to I.038g for jack pine, 0.395g for balsam fir and 0.329g for white spruce (Table 1.6). AIso, jack pine had significantly (Tukey-Kramer with p<0.05) lower needle base cation concentrations than other conifers, and balsam fir had significantly higher N, Ca and Mg concentrations in its needles. Black spruce had significantly lower N concentrations in its needles than other species.
Table 1.6. Mean nutrient concentrations (mg/g), contents (gll 00 needles), and CND ratios by species.
Balsam fir Black spruce Jack Pine White spruce
0 ·Z t': N P 13.266 (A) 1.605 (A) 9.869 (C) 1.311 (8) 11.682 (B) 0.990 (C) 11.468 (B) 1.646 (A) 1
....
~=
Ca 5.216 (A) 3.012 (C) 1.852 (0) 3.404 (B) ( j=
0 Mg 1.158(A) 1.070 (B) 0.842 (0) \.000 (C)u
K 5.705 (B) 5.844 (B) 3.856 (C) 6.276 (A) Weig 0.395 (B) 0.202 (0) 1.038 (A) 0.329 (C) ht ... N 5.262 (B) 1.989 (0) 12.170 (A) 3.793 (C) c <l) ... c P 0.639 (8) 0.265 (0) 1.030 (A) 0.535 (C) 0 U Ca 2.075 (A) 0.608 (0) 1.920 (B) 1.129(C) Mg 0.457 (B) 0.216 (0) 0.876 (A) 0.333 (C) K 2.261 (B) 1.177 (0) 4.012 (A) 2.029 (C) N 0.348 (B) 0.234 (C) 0.610 (A) 0.313 (B) <l) .... 0 P -1.788 (B) -1.799 (8) -1.859 (C) -1.667 (A) () Vl Cl Zu
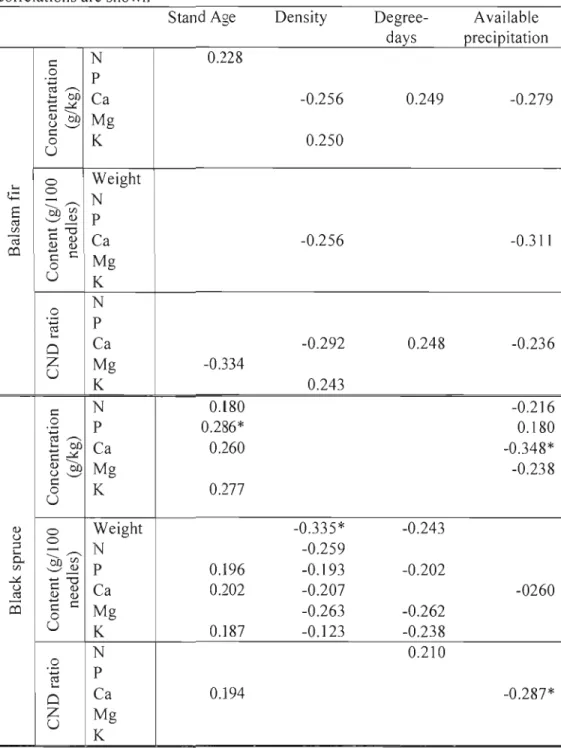
Ca Mg K -0.606 (A) -2.101 (B) -0.502 (B) -0.981 (B) _1.992 (A) -0.299 (A) -1.267 (C) -2.026 (A) -0.505 (B) -0.950 (B) -2.141 (B) -0.319 (A) A, B, C and D exponents indicate significantly «0.05) different means between species determined by Tukey-Kramer.Relationship between environmental factors and foliar indicators
Weak correlations were found between foliar indicators and stand age, density, degree-days and available precipitation (Table 1.7), CND ratios had lower correlation with stand age th an other foliar indicators. Stand density was generally negatively correlated with black spruce and balsam fir nutrition, while it was positively correlated for white spruce. Degree-days were positively correlated with balsam fir Ca nutrition, negatively with black spruce nutrient content and showed both positive and negative correlations with jack pine and white spruce nutrition. Avai lable precipitation generally affects ail species and nutrients negatively. For ail species and foliar indicators, Ca was significantly negatively correlated with available
precipitation. Calcium presented more significant correlations with tested variables than aIl other nutrients (Table 1.8).
Table 1.7. Pearson r correlations by species between foliar indicators and stand age, density, degree-days and available precipitation, where only significant (p<0.05) correlations are shown
Stand Age Density Degree Available
days precipitation 1:: 0 .;= ro ,,-... ' Cf) ... ,:,t. 1::--.. Q) Cf) U ' - ' 1:: 0 u N P Ca Mg K 0.228 -0.256 0.250 0.249 -0.279 ' t;:: E ro VJ ~
co
0 0 ---.. ,,-... OJ)VJ '-'~ ... "'0 1:: Q) Q) Q)C
c 0 u Weight N P Ca Mg K -0.256 -0.311 0 .;= ro ' 0z
u
N P Ca Mg K -0.334 -0.292 0.243 0.248 -0.236 1:: 0 ...ro ,,-... ' co ... ,:,t. 1::--.. Q) co U ' - ' 1:: 0 u N P Ca Mg K 0.l80 0.286* 0.260 0.277 -0.2] 6 0.180 -0.348* -0.238 Q) u ;:l ' 0.. VJ ,:,t. U roco
0 0 ---.. ,,-... OJ)VJ '-'~ ... "'0 1:: Q) Q) Q)C
1:: 0 u Weight N P Ca Mg K 0.196 0.202 0.]87 -0.335* -0.259 -0.193 -0.207 -0.263 -0.123 -0.243 -0.202 -0.262 -0.238 -0260 .2 ... ro ' Cl Zu
N P Ca Mg K 0.194 0.210 -0.287*Stand Age Density Degree Available days precipitation c N -0.456* 0.358 0 .';= P ro ~ +-'~'-C ... 01) Ca -0.420 -0.454* Q) 01) Mg -0.407 u ' - ' 0c K U Weight 0.308 Q) c +-' N -0.317 0.416 0.. c o P ..0<: U
~=
ro obi> Ca -0.363 ...u'-'
Mg K N -0.426 0.512* 0 +-' ro P 0.457* ' Ca -0.483 -0.425 0 Z Mgu
K c N -0.518 0.429 0 P -- 0.423 .';= ro ~ '- 01) Ca 0.368 -0.435 +-'..0<: C ... Q) 01) Mg u ' - ' c 0 Ku
Q) 0 Weight u 0 ... ;:l '- ... N 0.. 01)'"~'"
Q) '-'~ + - ' ' ' ' 0 P 0.395 0.370 +-' C Q) ...s:: Q) Q) Ca ~-=
c 0 Mg U K N -0.414 0.542 0 .';= P 0.385 ro ' Ca 0.409 -0.428 0 Z Mg U KAssessment of relationship between soil fertility and foliar indicators by means ofredundancy analyses
Redundancy analysis evaluates the fit between a set of explanatory variables with a set of response variables. Soil fertility variables were used to explain the
variability in foliar indicators (Table 1.8).
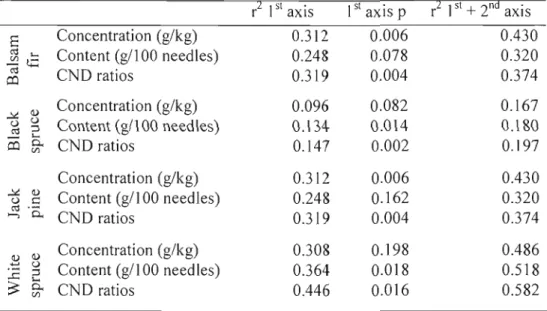
Table 1.8. RDA r2 of 1st and the 1st + 2nd axis by species and foliar indicator, with base cation nutrition explained by soil cation exchange capacity (CEC), pH(water), base cation HNO), % of silt, % of clay, specifie surface area and presence/absence of a soil depth of less then SOcm. The p values of the first canonical axis was assessed with a Monte-Carlo test.
r2 1st axis 1st axis p r2 1st + 2nd axis
Concentration (g/kg) 0.312 0.006 0.430 Content (g1100 needles) 0.248 0.078 0.320 CND ratios 0.319 0.004 0.374 ~ <l) Concentration (g/kg) 0.096 0.082 0.167 <.) <.) ::l Content (gl1 00 needles) 0.134 0.014 0.180 ro L..
co
0. CND ratios 0.147 0.002 0.197 <Il Concentration (g1kg) 0.312 0.006 0.430 ~ <1) <.) C Content (gl1 00 needles) 0.248 0.162 0.320 ro . ..., 0. CND ratios 0.319 0.004 0.374 <1) <1) Concentration (g/kg) 0.308 0.198 0.486 .-::: <.)::l Content (gl1 00 need les) 0.364 0.018 0.518
...c ....
0.
~ <Il CND ratios 0.446 0.016 0.582
Black spruce has the smallest r square, suggesting that its foliar nutrition is less
correlated to soil fertility th an other species (Table 1.8). For ail species, the CND r square of the 1st axis and its corresponding p value are stronger than other foliar indicators. For that reason, the following analysis will only concern CND foliar indicator.
Assessment of relationship betyveen soil fertility and foliar indicators by multiple regressions
For balsam fir and white spruce, Akaike's weight of regresslons models between so i1variables and CND ratios are stronger for Ca than Mg and K (annexe 1).
Jack pine shows higher r square with K while black spruce shows a stronger link with Mg, followed closely by Ca for both species. Generally, models r2 of relationships between soil fertility and CND are stronger with white spruce, followed respectively by jack pine, balsam fir and black spruce (annexe 1). In general, relationships between soil variables and foliar CND ratios are weak for the tested models.
Best models determined by AIC for each species and nutrient gives further insight on links between foliar nutrient and soil fertility. For Ca CND ratios, pH(water) is present in 2 of the 4 best models presented, for balsam fir and white spruce (Table 1.9). In those models, pH(water) is positively correlated with foliar Ca nutrition. CaHN03 is the only variable in the jack pine best model, and it has a positive effect on Ca CND ratio. CaHNü3 is also present in the black spruce best model (Table 1.9). Percentage of silt and percentage of clay have a negative effect on foliar C,r CND ratios in the majority of the models.
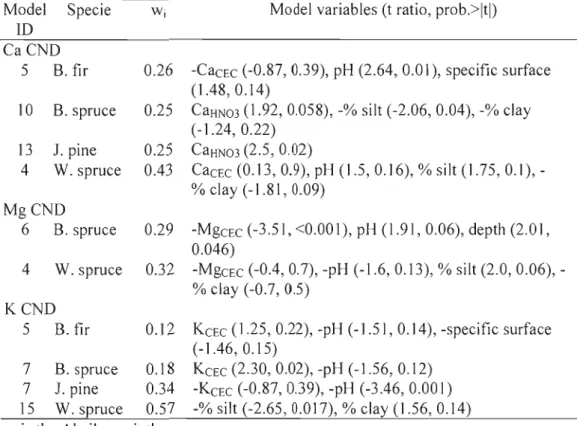
Table 1.9. Best models by species and nutrient explaining Ca CND ratios with soil fertility variables
Model Specie W 1 Madel variables (t ratio, prob.>ltl) ID
CaCND
5 B. fil' 0.26 -CaCEC (-0.87, 0.39), pH (2.64, 0.01), specifie surface (l.48,0.14)
10 B. spruce 0.25 CaHN03 (1.92,0.058), -% silt (-2.06, 0.04), -% clay (-1.24, 0.22)
13 J. pine 0.25 CaHN03 (2.5,0.02)
4 W. spruce 0.43 CaCEC (0.13, 0.9), pH (1.5,0.16), % silt (1.75,0.1), % clay (-1.81, 0.09)
MgCND
6 B. spruce 0.29 -MgcEc (-3.51, <0.001), pH (1.91,0.06), depth (2.0 l, 0.046)
4 W. spruce 0.32 -MgcEc (-0.4, 0.7), -pH (-1.6, 0.13), % silt (2.0, 0.06), % clay (-0.7, 0.5)
KCND
5 B.fir 0.12 KCEC (1.25, 0.22), -pH (-1.51, 0.14), -specifie surface (-1.46, 0.15)
7 B. spruce 0.18 KCEC (2.30, 0.02), -pH (-] .56, 0.12) 7 1. pine 0.34 -KCEC (-0.87, 0.39), -pH (-3.46, 0.001) 15 W. spruce 0.57 -% silt (-2.65, 0.0]7), % clay (1.56, 0.14)
Wj is the Akaike weigth.
Regressions between soil fertility variables and Mg CND ratios were very weak for balsam fil' and jack pine. For both species, the best model only contained depth of the profile, which had a low l' square (1'2 < 0.03). Soil depth in the black spruce mode1 (Table 1.9) is positively correlated with the Mg CND ratio. pH (waler) has a positive influence on black spruce nutrition. For wl1ite spruce, silt is positively correlated with Mg CND ratios.
pH(wa'er) is present in 3 of the 4 best K models presented, for balsam fil' (Table ] .9), black spruce and jack pine. ln ail the models, pH(water) is negatively correJated with foliar K nutrition. KCEC is also present in those 3 models and is positively correlated with black spruce and jack pine nutrition. Percentage of silt has a negative
effect on the white spruce CND Mg ratio. Percentage of clay is positive in this mode l, but not significant.
Relationships between foliar indicators and productivity by the boundary line approach
A boundary line could not be assessed for balsam fir and jack pine P due to a convex quadratic regression. Also, due to low quadratic regression p value, black spruce N and balsam fir Ca boundary line are not considered. Because of the lack of samples beneath the deficiency level, Mg deficiency level could not be estimated for ail sampled species.
Table 1.10. Nutrition standard by species, determined by the boundary layer approach
CND CND CND
?
Deficient MaxOptimu deficienc Unbalance samples productivity
m y level d level (%) loss (%)
N 0.4121 0.2139 0.6103 0.739 4.6 18.7
P N.A. N.A. N.A. N.A.
Ca -0.6751+ -1.1503+ -0.1999+ 0.074+ Mg -2.0522 -2.2614* -1.8430 0.911 0* K -0.4683 -0.6684 -0.2682 0.747 10.3 29.1 N 0.2196+ -0.0382+ 0.4774+ 0.145+ Q) u ~
...
P -1.7967 -2.0782 -1.5152 0.595 5.3 12.9 0.. (/) Ca -0.7892 -1.1433 -0.4350 0.748 17.4 28.3~
Mg -2.0336 -2.1987* -1.8686 0.956 0* CO K -0.3352 -0.6872 0.0169 0.586 0.8 10.7 N 0.6304 0.5060 0.7548 0.875 17.9 40.3P N.A. N.A. N.A. N.A.
Ca -1.2526 -1.5198 -0.9855 0.912 14.3 38.3 Mg -2.0303 -2.1525* -1.9080 0.688 0* K -0.5189 -0.6366 -0.4011 0.928 12.5 27.3 Q)
2
N P 0.2936 -1.5109 0.1820 -1.7878 0.4033 -1.2340 0.819 0.868 12.9 25.8 14.4 26.8 ~ Ca -1.0732 -1.4155 -0.7309 0.832 9.7 17.1 ~ ...c: Mg -2.2870 -2.5078* -2.0662 0.870 0* ~ K -0.2260 -0.3570 -0.0950 0.853 29.0 28.3Nutrition optimum corresponds to the boundary-line CND ratio where productivity is at its highest, while CND deficiency and unbalanced leveJ correspond respectively to the point where productivity is at 90% due to low or high CND ratios. The r2 is the r square of the quadratic regression. Deficient samples correspond to the proportion of samples which have a lower CND ratio than its corresponding CND deficiency level. Max productivity loss corresponds to the lowest CND ratio sample plotted on the quadratic regression.
*Calculation of CND deficiency level is not possible due to the lack of observation with nutrient deficiency.
+Determination of CND optimum <md nutrition range is not possible due to the low p value (p<O.1 0) of regression of boundary line points.
N.A. Determination of boundary line characteristics is not possible due to a convex quadratic regression.
Of the 306 foliar samples, 222 had no deficiencies, 75 had one nutrient under
the deficiency level and only 9 had two nutrient deficiencies. More stands were limited by base cation deficiencies than N or P deficiencies, as 34 stands had a Ca CND ratio under the deficiency level, 26 for K, 18 for N and 15 for P. However, the
highest productivity loss has been observed with low N CND ratios on a sampled jack pine.
1.5 Discussion
As mentioned in the introduction, developing foliar indicators of stand nutrient status for large geographical areas involved many steps: comparison of different expressIon of foliar concentrations, testing indicator sensitivity to species, soil conditions and productivity as weil as their applicability to a wide range of environmental conditions.
Differences between species
Fast growing species generally respond more to a change in soil fertility than conservative species (Chapin, 1980). Redundancy analysis showed that the relationship between soil and foliar nutrition was stronger for balsam fir, white spruce and jack pi ne than black spruce. The first three species are indeed fast growing species Uack pine) or nutrient demanding species (balsam fir and white spruce), while black spruce is more conservative (Thiffault, 2006). Black spruce needles also had low nutrient content and concentrations, jack pine had low nutrient concentration bt.::t high content, while balsam fir needles had high nutrient concentration. Differences in needle nutrient concentrations between species may be caused by species intrinsic charectheristics and/or by their different distribution. Jack pine was mainly found on
f1uvioglacial deposits and till, while white spruce was mainly sampled on lacustrine deposits and til!.
This difference between species is less apparent with CND ratios, suggesting
that nutrient ratios are more constant between species than foliar concentrations (Ericsson, 1994). Conservative species are usually weil adapted for scarcer resources and are more effective in their use of nutrients, which can explain lower black spruce
needle concentration (Chapin, 1980). The 1ink between productivity and foliar nutrition, underlined by the boundary-line approach, a1so shows that black spruce experiences 1ess foliar deticiencies than other species for aIl nutrients except Ca.
Compared to other species, white spruce foliar nutrition displays higher coefficient regressions with soil model for ail nutrients. However, since fewer white spruce trees were sampled, those coefficients may be biased by the small white spruce sample size. Black spruce needles weakly reflect soil fertility for ail nutrients. Jack pine Ca and K CND ratios and balsam tir foliar Ca are good indicators of soil
fertility. Thiffault et al. (2006) also observed that those species where more sensitive to soil changes.
Difference between indicators
CND offers many advantages over ORIS. The tirst technique takes into account higher order interaction and interrelationships between ail nutrients, as one nutrient cannot vary without affecting ail eND ratios (Parent and Datir, 1992). Also, CND multivariate ratios are free of the unit-sum constraints of ORIS and offer more statistical possibilities. Despite those differences, Parent and Datir (1992) demonstrated that there is a strong relationship between the two indicators, which was apparent in the correlations observed in this study. However, CND ratios are less affected by stand age than foliar concentrations and contents. Indeed, in Walworth and Sumner (1988) review on foliar indicators, they observed that ratios tend to be more stable to seasonal and annual variation than nu trient concentrations.