O
pen
A
rchive
T
OULOUSE
A
rchive
O
uverte (
OATAO
)
OATAO is an open access repository that collects the work of Toulouse researchers and
makes it freely available over the web where possible.
This is an author-deposited version published in :
http://oatao.univ-toulouse.fr/
Eprints ID : 10494
To link to this article : DOI:10.1039/c2sm25982f
URL :
http://dx.doi.org/10.1039/c2sm25982f
To cite this version : Chauvet, Fabien and Geoffroy, Sandrine and Hamouni,
Abdelkrim and Prat, Marc and Joseph, Pierre. Roles of gas in capillary filling of
nanoslits. (2012) Soft Matter, vol. 8 (n° 41). pp. 10738-10749. ISSN 1744-683X
Any correspondance concerning this service should be sent to the repository
administrator:
staff-oatao@listes-diff.inp-toulouse.fr
Roles of gas in capillary filling of nanoslits
Fabien Chauvet,ab Sandrine Geoffroy/ Abdelkrim Hamoumi,ab Marc Prat
4and Pierre Joseph*ab
Control and understanding offlows inside fabricated nanochannels is rich in potential applications, but nanoscale physics of fluids remains to be clarified even for the simple case of spontaneous capillary filling. This paper reports an experimental and modelling investigation of the role of gas on the capillary filling kinetics slowdown in nanoslits (depth going from 20 nm to 400 nm) compared to Washbum's prediction. First, the role of gas through the usually observed trapped bubbles during a nanoslits capillary filling is analysed thanks to experiments realized with water, ethanol and silicone oil in silicon-glass nanochannels. Bubbles are trapped only when slit depth is below a liquid-dependent threshold. This is interpreted as possible contact line pinning strength varying with wettability. Stagnant trapped bubbles lifetime is investigated for the three liquids used. Experimental results show that bubbles are fust compressed because of the increasing localliquid pressure. Once the gas hubble pressure is sufficiently high, gas dissolution in duces the final hubble collapse. Influence of the bubbles' presence on the capillary filling kinetics is analysed by estimating viscous resistance induced by the bubbles using an effective medium approach (Brinkman approximation). Surprisingly, the bubbles' presence is found to have a very minor effect on nanoslits capillary filling kinetics. Second, the transient gas pressure profile between the advancing meniscus and the channel exit is computed numerically taking into account gas compressibility. A non-negligible over-pressure ahead of the meniscus is found for nano-scale slit capillary filling. Considering the possible presence of precursor films, reducing cross-section for gas flow, leads to a capillary filling kinetics slowdown comparable to the ones measured experimentally.
A.
Introduction
Flows at small scales are ubiquitous, from porous media to blood circulation inside microvessels; and they have raised scientific interest for a long time. From the 90's, the use of micro-fabrication technologies-initially developed for microelec-tronics-to manipulate the liquid inside deterministic networks of channels, has led to the overwhelming development of microfluidics.1 Motivation for this growth is mainly practical, since the field is strongly driven by the potential applications of labs-on-chip: miniaturization leads to smaller amount of sample, high-throughput and automated analysis, reduction of time and cost, key features for analytical chemistry, or even medicine (point of care diagnostics for instance). In spite of this applied finality, the possibility to build efficient, innovative microfluidic applications has not only originated from technological prog-resses, but also frequently from fundamental studies on fluid
•CNRS, LAAS, 7 avenue du colonel Roche, F-31400 Toulouse, France. E-mail: pjoseph@laas.fr
•univ de Toulouse, LAAS, F-31400 Toulouse, France
'Université de Toulouse, INSA, UPS, Mines Albi, ISAE, ICA (Institut Clément Ader), 135 avenue de Rangueil, F-31077 Toulouse, France. E-mail: geoffroy@insa-toulouse.fr
dUniversité de Toulouse, INPT, UPS, IMFT, Avenue Camille Soula, F-31400 Toulouse, France. E-mail: mprat@imft.fr
mechanics and flow physics, leading the way to novel or improved functions: diffusiophoresis in salt gradients for enhanced mixing/ reduced friction on superhydrophobic surfaces, 3 biomolecule concentration due to salt effects at a micro-nanochannel interface. 4
This last example involves fluid confined in nanometer-sized channels: nanofluidics is an emerging topicS-41 that appeared very recently and is strongly linked to nanotechnologies.9·10 It has also a strong potential for applications (let us cite perspectives for water salt removal, DNA elongation, or even energy conver-sion11·12), but is very closely linked to fundamental phenomena. Indeed, nanoscale fluid physics is particularly rich and still only partially explored: hydrodynamic boundary condition, 13 enhanced flows inside carbon nanotubes, 14·15 proton titra ti on by acidic walls, 16 limit of validity of continuous description17·18 are sorne of the basic nanofluidic open fundamental questions.
In this context, we address in this paper the simple case of capillary invasion of nanochannels. This process, also baptized spontaneous imbibition in the context of porous media, is related to very different practical situations: in trees, in aging of concrete, for separation in zeolithes, for oil recovery; which is an additional motivation to this study.
Almost one century ago, Lucas19 and Washbum20 described
the dynamics of a liquid entering a tube by capillarity: meniscus velocity is driven by a balance between viscous friction in the
liquid within the already wetted part of the channel, and a driving force due to Laplace pressure at the liquid front. For the simple case of a rectangular tube with low aspect ratio (width w
»
depth a), the simplest description based on an increasing
hydrodynamic resistance balancing a constant capillary driving force leads to a meniscus position h versus time t that can be written:
'hA racos8
Wlt
=
3~tl'
(1)where r is the liquid surface tension, 8 is the contact angle and ILl
is the liquid viscosity.
At the macro or even rnicrometer scale, the current description of spontaneous imbibition is quite accurate, with different refinements accounting for inertia,~1•22 dynamic contact angle,~3
or the transient velocity profile and pressure field at the entrance being considered, 24 or including vi seo us dissipation in the gas
phase.2s In porous media, observed deviations to the standard laW'~ have been analyzed as resulting from pore size distribution, but the analysis is complex as demonstrated recently;27 and the
case of water-ethanol mixtures in model nanoporous packed beads shows non-trivial dynamics.28
At the molecular scale, many numerical results have been derived by using molecular dynamics for situations related to imbibition: dynamic contact angle,29 capillary flows of n-alcohol
or water in nanopores, 30
•31 evaporation of fluid bridges in slit-like
pores, 32 role of slip boundary condition on the capillary filling in
carbon nanotubes,33 influence of a prewetting monolayer
inducing a strong slip.34
Nevertheless, as already evoked, there are still questions at dimensions below about 100 nm. A number of experimental works have recently been performed with silicon-glass nanoslits (low aspect ratio nanochannels), with depth in the 5--500 nm range, and widths of the order of 1-10 JliD defined by photo-lithography.t Fabrication of deviees differ in their details: they use either silicon wet or dry etching, 3s•36 a spacer silicon oxide
layer,37 a sacrificial core38 or two steps silicon oxidation.39 van Delft et al. have even included rnirrors within deviees, acting as a
Fabry-Perot interferometer, for contrast enhancement.40
•41
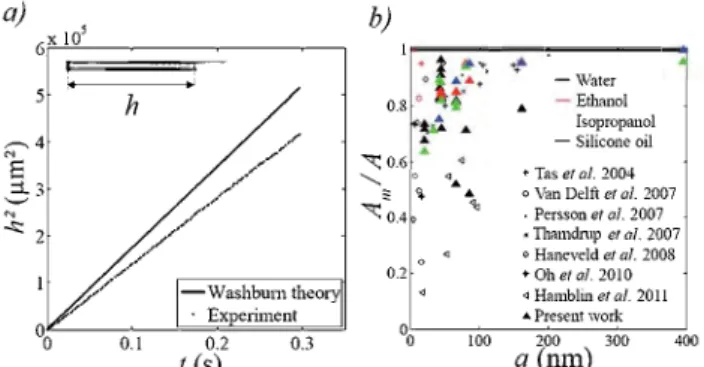
There is no full consensus on the measured filling kinetics, but most studies report a semi-quantitative agreement with Wash-burn law: time progression of the meniscus follows a square-root law, but with a slowdown with respect to the macroscopic prediction. 3s-38
,40-43 Fig. 1 gives an overview of the reported
measurements. They are expressed as the ratio of the experi-mental measured factor Am to the predicted one A in eqn (1 ), as a function of the channel depth a. Dispersion of data is quite
significant but most results deviate from the macroscopic prediction for depths below about 100 nm. These filling speeds that are significantly lower than classical continuum theory are observed for ali the liquids investigated. The slowdown factor increases with size reduction, up to about 50% for tens of nanometers depth.
A number of specifie studies and possible physical explana-tions have been proposed; they are briefly summarized below.
t
Nanotubes or nanopores are closer to nanochanne1s with aspect ratio of order unity; fiows inside such structures are still high1y debated, and their study goes beyond the scope of this paper.~
"""-1:: ~ + 0 0.8 0 ~ x 0.6 0"*
0.4 ~ 0 0.2 <1 0 + <1 <1 <1 +x + - Water - Ethanol + Tas et al. 2004o Van Delft et al. 2007
. Persson et al. 2007 x Thamdrup et al. 2007 o Haneveld et al. 2008 *Oh etal. 2010 <1 Hamblin et al. 2011
%L_
______
l~00~----~2~0~0---~300a
(ntn)
Fig. 1 Capillary filling slowdown in nanoslits reported by severa! authors.35
•37....,•45,.. Results are expressed as the ratio Arc/ A of the measured coefficient Am to the predicted one A in Washburn law h2(t) =At.
The possible slowdown effect of dynamic contact angle has been suggested as a reduced capillary 'mo tor' in the process. 38
•42
However, a few arguments seem to disprove this effect. First, the goveming parameter is the capillary number that compares viscosity to capillary stress: Ca
=
~t1Uir, where U is a typicalvelocity. For nanochannels, spontaneous imbibition, Ca can be
written from eqn (1): Ca
=
a/6h(t). From usual models and measurements,44 a dynamic contact angle differing from the static one is usually obtained for a minimum capillary number Ca~
to-
4, which holds only for distances lower than about 200 llm in a 20 nm deep nanoslit. It suggests that a hypothetical deviation due to this effect would only impact the very beginning of filling. Sirnilarly, since dynamic contact angle depends on velocity, which strongly varies during capillary imbibition, the square root progression, experimentally observed by most groups, should not hold. Furthermore, at a given position after the meniscus h0,Ca decreases when the depth of the channel a is reduced, so a dynamic contact angle s1owdown effect should decrease with
narrower channels.
Oh et al. have used water-ethanol mixtures with different
proportions, for 6 nm and 16 nm deep channels. 45 They conclude
that specifie adsorption or chemical selectivity effects are not relevant, and show that a simple additional resistance due to roughness is not sufficient to account for the experimental dynamics.
Haneveld et al. have worked on dimensions down to about 5
nm; they have realized a very accurate determination of channel's depth, and measure effects notably smaller than most other studies. 37 They propose, as a possible explanation of slowdown,
the presence of immobilized liquid layers (with dimensions comparable to the molecular size). It can be related to the layering of the fust liquid molecules, observed by surface force apparatus, for a variety of solvents.46
Electroviscous effect, that can be viewed as an electroosmosis in the flow potential (which itself originates from the charged diffuse layer close to surfaces immerged in an electrolyte), has also been proposed to account for an enhanced hydrodynamic resistance. This point has been tackled both by experiments, with
studies on influence of the salt concentration on the meniscus dynamics,35 and by successive theoretical analyses.47-49 The effect
is maximized when the depth of the channel is comparable to the screening length (extension of the diffuse layer). Nevertheless, models show that on a quantitative point ofview, electroviscous slow-down is too low to explain the experimental results.
We can also note that the enormous negative pressure inside devices50 can deform the channels by elastocapillarity. The
dynamics resulting from this fluid-structure coupling have been studied in detail by van Honschoten et al. ;51-53 and lead to an
overall accelerated dynamics.
The transport by precursor films that can develop ahead ofthe meniscus, as evidenced in the simulations by Chibbaro et a/.,54
can also be a source of altered imbibition. It could, for instance, suck a part of the liquid, as suggested by Haneveld et al. to
account for their experiments;37 this effect has been studied by a
lattice-gas model. 55 It can also modify the effective boundary condition, as shown by a numerical study.34
An important point is that, even though many of the previ-ously cited experimental studies have observed the formation of enclosed gas bubbles during the filling process, very few have assessed the influence of this phenomenon on the filling kinetics. Han et al. 42 observed that for an ethanol-water mixture, air
trapping disappears for the ethanol fraction above 40 %, for 27 nm deep nanochannels. To our knowledge, the only published work on the influence of those bubbles on meniscus dynamics is by Thamdrup et al. :56 they measure how single hubble trapping
leads to an instantaneous jump of the meniscus, but corresponds to an immediate decrease in the filling speed.
Phan et al. 57 have measured fillings kinetics within dead-end
nanochannels, a geometry which amplifies the role of the gaseous phase. Experimental results agree with a macroscopic hydrody-namic model accounting for gas compression and dissolution. However the measured slowdown in the kinetics (about 50% for 45 nm deep channels) is slightly stronger than for identical open deviees.
This collection of studies shows that we are still lacking a complete description of phenomena occurring during nano-channels spontaneous imbibition. In particular, the role of gas and liquidlgas/wall interfaces appears to be complex and has only hardly been investigated until now. In this paper, we present experimental results on capillary filling, with special focus on the trapping of bubbles, their dynamics, and their influence on the imbibition kinetics. We also discuss the role of gas present ahead of the meniscus: we develop a theoretical model accounting for gas compression during filling, demonstrating a significant pressurization. We take this effect into account to determine the meniscus dynamics, and extend this model to a situation with fully developed wetting films.
B. Filling kinetics experiments
Materials and methodsNanochannels are realized by standard clean-room fabrication, as described in our previous work. 57 Lateral dimension of the
channels are designed on a photomask: width is varied between 3 J.UD. and 10 J.UD., and length between 200 J.UD. and 5 mm, as shown
in Fig. 2(a) and (c). Nanochannels are etched in silicon by
a)
b)
c)
Fig. 2 Geometry of the nanochannels. (a) Scheme of the cross section of a nanoslit etched in silicon. Graphs on the right are typical roughness measurement by AFM inside a channel and on the glass surface. (b) Nanochannel 3D profile, measured by tapping mode AFM. (c) Archi-tecture of a typical chip used consisting of nanoslits (in violet) with different widths and lengths; self capillary filling of microchannel (in green) allows liquid into nanochannels.
reactive ion etching in an ICP omega 201 machine, with condi-tions adapted to slow smooth etching: CF 4 at 10 rn torr pressure,
with a flow rate equal to 20 sccm, coil power 50 W and bias power 25 W at 13.56 MHz. The etching rate is around 10 nm min-I and the obtained peak-to-peak roughness, measured by Atomic Force Microscopy (AFM), is below 1 nm on a 2.5 ~rn line (see Fig. 2(a)). Microchannels (10 ~rn deep, 200 J.UD. wide) are also dry etched; they provide a fast and reproducible arrivai of the liquid during the capillary filling experiments. Holes are drilled by sand blasting at microchannels ends.
Sealing of the silicon wafer to a glass substrate is ensured by anodic bonding after piranha cleaning (5 min in 50% H202/50%
H2S04 followed by 20 min rinsing in deionized water) and 30 min
dehydration in an oven at 200 oc. Bonding parameters (temperature T
=
370 oc, voltage V= 250 V, limiting current 4 mA) are chosen to minimize channel collapse, as previously reported for very low aspect ratio deviees. 58 Glass roughness is abit higher than that of the silicon, but remains of the order of 1 nanometer on a few microns (see Fig. 2(a)). Contact angles are measured just before the bonding step by drop deposition method (Digidrop apparatus). Full wetting is obtained for the different liquids, so the contact angle is supposed to be lower than 5o, the minimum angle that can reasonably be measured by this method. Channel depth is varied between 20 nm and 400 nm.
It is measured by a calibrated AFM. The values are consistent with the ones obtained on test zones of width much larger than those of the nanochannels by a mechanical profilometer and an optical interferometry profilometer, with a maximum deviation of a few percent.
Filling kinetics experiments are realized on an inverted micro-scope (Zeiss Axio Observer Dl), with lOx objective, and a high speed camera (Fastcam SA3). Imbibition is characterized for deionized water (clean-room quality, 18 MO cm), ethanol, iso-propanol (electronic grade), and silicone oil (Siliconol M5, Carl Roth). Standard reflection illumination with a halogen lamp gives a good contrast between dry and wetted zone for depths down to 20 nm. Deviees are stored in an oven at 200
oc
for 30 min just before the experiments. The chip is inserted in a Teflon bolder and liquid arrivai is realized by deposition of a 5 J,LL droplet. Thetemperature is measured for each experiment; its value is in the range 21-26
oc.
Relative hygrometry is around 45%.Filling speed results
A typical snapshot of filling experiments is reported in the inset of Fig. 3(a), obtained for water in a 66.5 nm deep channel.
We observe trapping of bubbles at the liquid front; this point will be discussed in detail in the next section. Meniscus position is extracted by image analysis. The method we found to allow the best precision is to average image intensity on the channel width and threshold the obtained profile (filled part appears darker than the non-wetted zone); it enables us to determine the first arrivai ofliquid. Fig. 3(a) shows a typical result, also obtained for water in a 66.5 nm deep channel. Square of the meniscus position is reported versus time, together with prediction from Washbum law (eqn (1)). As reported in other studies, we measured a semi-qualitative agreement with the macroscopic prediction: the meniscus follows a square root law, but with a slightly reduced kinetics. The relative slowdown shows no dependence on channel width (from 3 to 10 J.Lm) and length (from 200 J.Lffi to 5 mm),
within a few percent. The typical reproducibility observed in our experiments is of the order of 10% for the value of A (defined in eqn (1)). This is consistent with estimation of the error bar originating from uncertainty on experimental parameters (channel depths, contact angle, image analysis, temperature and its influence on the viscosity).
b) - Water - Ethanol - Isopropanol - Silicone oil + Tas et al. 2004
o Van Delft et al. 2007
· Persson er al. 2007
0.2
• Thmndn1p er al. 2007
o Haneveld et al. 2008
.. Oh er al. 2010
<:~Hamblinera/. 2011 .a. Present work
0oc _ _l,..,_00.,---,-20;-,0----,-,30-,--0 _ _-,J400
a (mn)
Fig. 3 (a) Typical filling kinetics, shown in the case of deionized water in a 66.5 nm deep nanochannel. Continuous line is the macroscopic
Washburn prediction. Measured value of Amis 20 % lower than the
theoretical one. (b) Superposition of our data on the kinetics data
extracted from the litera ture. "·37
- · " ·56
Fig. 3(b) summarizes our determination of the ratio experi-mental/predicted coefficient A as fonction of the channel depth. Similarly to most other works, the slowdown effect we measure increases with confinement, up to around 25 % deviation for 20 nm nanoslits for all the liquids tested.t
Since this dynamics is hypothesized to be related to the pres-ence of observed bubbles, we describe in the following section their trapping and time evolution.
C. Behavior of trapped bubbles
Threshold for hubble trapping
Fig. 4 shows the typical appearance of the phase distribution behind the meniscus, when it is located at a distance of order
750 J.Lffi from the nanochannel entrance, for three different
liquids (water, ethanol and silicone oil), and four depths from 162 nm down to 42 nm.
First, a threshold depth at is clearly visible below which bubbles are trapped for the three liquids. Secondly, the value of at depends on the liquid: when reducing channel depth, bubbles are fust trappedforwater (85.7 <at< 162 nm), thenforethanol (66.5 <at < 85.7 nm), and eventually for silicone oil with very few bubbles observed only in the narrowest channels (42 nm deep). Note that 85.7 nm is probably very close to the trapping threshold for ethanol: it can be seen on the corresponding zoom on the spatiotemporal diagram of Fig. 5. Images for a
= 20 nm are not
shown because of the poor contrast between liquid and gas at this nanoslit depth. Nevertheless, after careful analysis of the images, bubbles are observed with ail the liquids for a=
20 nm.The precise physical mechanism responsible for bubble trap-ping is still unclear, but our observations suggest that it could be
Nanoslits entra nee
Fig. 4 Snapshots taken during capillary filling ofwater, ethanol and one
silicone oil for severa! nanoslit depths. For ali the images, the distance
between liquid front and the nanoslit entrance is ~750 J.llll. Liquid
appears as dark and gas (air) as white (flow from left to right).
t
We have investigated different fluids: water (which is an electrolyte),ethanol and isopropanol (also polar but organic liquids) and a silicone oil (made of small polydimethylsiloxane chains). Even though they do not constitute an exhaustive set, they represent quite different systems conceming molecular liquid-liquid, liquid-gas, and liquid-surface
interactions. Similar slowdown magnitude is observed for ali liquids
tested. It may thus be argued that specifie surface effects seem to play a
minor role, even though being able to confirm this point would require a dedicated study. In this work, we focus on effects which seem to be more generic than liquid-surface interactions to explain the experimentally measured slowdowns: trapped bubbles and gas pressurization.
Water Ethanol Silicone Oil
x
161.7 nmI
l sec -~1001-!m 85.7nm 66.5nm 42nmFig. 5 Spatiotemporal diagrams made on one nanoslit. Nanoslit entrance is located on the left of each diagram. Vertical white bars correspond to 1
second and horizontal bars correspond to 100 jliD. For a= 66.5 nm, high magnification snapshots ofbubbles are added where the widths of the nanoslits
are 10 jlill.
related to contact line pinning by chemical or topological defects. As a matter of fact, even though we measure a zero contact angle just bef ore bonding the deviees at a macroscopic scale, wetting on silicon oxide surface (glass or silicon native oxide) is better for silicone oil (the spreading parameter is higher) than for ethanol and for water, so that water (and to a lower extent ethanol) should be more subject to pinning than the oil. The fact that such pinning has a stronger effect (and leads to the trapping of bubbles) when the confinement increases is qualitatively in agreement with fluid mechanics studies in macroscopic
Hele-Shaw cells with chemical59 or topological60 heterogeneities.
Let us also note that, even in the absence of bubbles, pinning effects could contribute to the slowdown, and might even be interpreted as a dynamic contact angle (but with a very different scaling with velocity).
As can be seen in Fig. 4, hubble density is higher just behind the meniscus than close to channel entrance. A first explanation is that trapping occurs more sparsely at the beginning of the filling process, when the meniscus is moving faster. We believe this is related to a contact line pinning that is more significant for low velocities, as seen in the already cited Hele-Shaw cell
studies.59
•60 Nevertheless, hubble time evolution is probably the
main cause for this spatial distribution; and we discuss their dynarnics hereafter.
Bubble dynamics
For the cases investigated here, once a hubble is trapped it is not convected by the liquid flow but it stays at its formation place. This appears in spatiotemporal diagrams of a single nanoslit, see
Fig. 5. These spatiotemporal diagrams consist of successive snapshots of one nanochannel which are stacked from the top (initial instant - empty nanochannel) to the bottom (filled nanochannel). Snapshots are separated in time by a constant time interval. Here, we focus on bubbles' temporal evolution. Bubbles created lastly have longer lifetime, as can be particularly well seen in Fig. 5 for water in a= 85.7 nm and ethanol in a= 66.5 nm. Furtherrnore, the lifetime seems to depend on the initial hubble size (small bubbles disappear more rapidly).
We can expect that, as analyzed in ref. 57, hubble volume decrease is due to both compression and dissolution of the air in the liquid. Compression is due to the increase in the liquid pressure as the distance between the front and the hubble loca-tion increases, see Fig. 6.
The time evolution of a single hubble volume is estimated from the images. Spatiotemporal diagrams are fust binarized in order to be able to 'count' white pixels corresponding to the projected area of the highly crushed hubble chosen Qiquid-gas interface can be reasonably considered as straight here). Multiplying this
area by the depth a provides an estima te of the hubble volume,
Vb, accurate enough for the need of this study (uncertainty on Vb
is quite high here due to the optical resolution along the slits widths). Severa! measured hubble volume temporal evolution at
locations xb, are plotted as a function of time in Fig. 7.
Measurement are presented for a= 85.7 nm for water (Fig. 7(a)), and a= 66.5 nm for ethanol and silicone oil (Fig. 7(b) and (c)), depths for which our experimental data give access to the full hubble lifetime. To estima te the bubbles compression effect, time
evolution of the initial hubble volume trapped, Vbo, is computed
Pa
2ycos(
[!)/a
----
;-
-...
.'
' '
'
' '
' 1 ---~----2ycos(
[!)/a
' - - - -...
'
---~x
0
h(t)
Fig. 6 Illustration of the increase in the liquid pressure and in gas hubble as the distance between the front and the hubble location increases. The dashed line represents liquid pressure profile at the instant when the
hubble is trapped (meniscus at h = xb). The continuous line represents
liquid pressure profile at a later time.
Vb =Pa VbO,
Pb (2)
where Pb is the pressure in the bubble. It depends on the local liquid pressure p1(xb) through Laplace's law:
2-y
Pb
=
PI(xb) +-cos O. (3)a
Assuming a linear liquid pressure profile between x = 0
<PI
=
pa) and x = h(t) (p1 =Pa - 2-ycos Ota) leads to: 12JLidh
Pb= Pa+ (h(t)- Xb) - 2 -d . (4)
a t
Computations of Vb are performed using values of h(t) and dhl dt computed from the measured values of the coefficient Am
(h2(t)
=
Amt). Time evolutions of Vb, computed from thiscompression model, are shown in Fig. 7.
As can be seen from Fig. 7(a), Vb computed from isothermal gas bubble compression coïncides weil with experimental measurements for the case ofwater, except for xb
=
290 lilll whent > 0.5 s. At long times, compression model predicts a positive value for Vb (limited maximal compression ratio) and then cannot predict the observed bubble disappearance. Indeed, this final collapse is due to gas dissolution in water. Two main processes can then be distinguished for the bubble volume decrease: compression followed by dissolution. Dissolution begins to act efficiently once the dissolution flux J (kg m-2 s-1) is sufficiently large; it can be expressed as:
(5) where D is the diffusion coefficient of the gas in the liquid, o is a certain transfer length scale and c is the gas concentration in the liquid at the liquid-gas interface. Gas concentration c depends on Pb through Henry's law: c = pJkH, where kH is the Henry's constant, which depends on the liquid and gas under consider-ation. Eqn (5) becomes:
(6)
a)
x10-3 10~---~---~---.b)
,..."'
s
::t '-" ~-<>c)
8'
,, 6~\
;,T.t,} -\\
\ 1.2 0.8 0.6 0.4 0.2 00 -3 3.5x 10 2.5 ~-<> 1.5 0.5-x.= 290 ).lill, illodel coillp -x.= 290 ).lill, exp
- -
-x.
= 788 ).lill, illodel coillp-.-x.= 788 ).lill, exp
- x.= 363 ).lill, illodel coillp
- x.= 363 ).lill, exp
-- -x. = 50 1 ).lill, illodel coillp
-• -x. = 50 1 ).lill, exp
0.2
t(s)
0.4 0.6- x.= 557 ).lill, illodel coillp
- x.= 557 ).lill, exp
- - - x.= 965 ).lill, illodel coillp
- • - x.= 965 ).lill, exp
t
(s)
Fig. 7 Single hubble volume as a function of time experimentally measured (tines with error bars) and computed (solid or dashed lines without symbols) using an isothermal compression mode! (see text) for
severa! hubble locations xb from the nanoslit entrance. (a) Water in a
nanoslitofdepth a= 85.7 nm, (b) ethanol a= 66.5 nm, (c) silicone oil a=
66.5 nm.
According to eqn (6), J is proportional to
Dio
which will be assumed constant here. This hypothesis is justified because much higher variations are expected for pJkH (pb starts from Pa andtends to Pa +2"(/a) than for D/13. Eqn (6) indicates that the
dissolution flux is proportional to Pb· Dissolution is then
continuously enhanced during the filling process. In the following, we focus on the transition from
compression-domi-nated to dissolution-domicompression-domi-nated hubble evolution. It is
charac-terized by measuring the gas hubble pressure Pbd from which
experimental point Vb(t) devia tes from the compression model in
Fig. 7.Then, Pbd can be simply deduced graphically from a
hubble volume ratio computation (see eqn (2)): Pbd
=
Pa(Vb<JI'Vb)·As can be seen from the curve corresponding to xb
=
290 J..lm, inFig. 7(a), Vb decreases by a factor of about 10 before diverging
from the compression model, leading to Pbd "" 10Pa· The curve
corresponding to xb
=
788 J..liD is entirely described by thecompression model. We can then verify that the dissolution
pressure Pbd is not reached in this case. Indeed a maximal value of
Spa for Pb can be easily deduced from this plot. Therefore, for the
latter case, hubble volume decrease is mainly due to mechanical compression since the dissolution process is not expected to be
significant as long as Pb is lower than the dissolution pressure Pbd
=
lOpa previously deduced. The coherence of this analysis allows validating the proposed phenomenology to explain bubbles collapse: bubbles are fust mechanically compressed due to theincrease in localliquid pressure (see Fig. 6); J (which is
propor-tional to Pb) increases during this stage until hubble volume
decrease is mainly due to dissolution when Pb "" Pbd·
Compression process for the hubble located at xb
=
788 J..liD(Fig. 7(a)) takes more time because the hubble is further from the
channel entrance than the hubble located at xb
=
290 J..liD forwhich h - Xb increases more rapidly (see eqn (3) and Fig. 6).
In the following, we focus on the case of ethanol and silicone
oil (Fig. 7(b) and (c)) for which the experimental points Vb(t)
follow the compression model curves only at the beginning for the ethanol (Fig. 7(b)) and not at all for the silicone oil (Fig. 7(c)). Given the previous analysis, these behaviors suggest that hubble volume decrease by dissolution for ethanol and silicone oil starts
from lower values of Pbd than for water. In other terms, a lower
hubble compression is needed to reach the sufficiently large
values of J that mark the start of the dissolution stage. This can
be understood considering Henry's coefficient values. For simplicity here, air hubble is considered as pure nitrogen. The
values of Henry's coefficient kH for nitrogen are extracted from
Battino et al. 61 This gives 1.0 x 10⁷ Pa m3 kg-1
and 3.6 x 10⁵ Pa
m3 kg-1 for water and ethanol respectively. The kH for nitrogen
in the silicone oil used in our experiments has not been found. We
use the value 5.2 x 10⁴ Pa m3 kg-1 given in the same reference for
a quite similar oil (octamethylcyclotetrasiloxane). Since J is
inversely proportional to kH, the value of J needed to observe a
significant dissolution process is reached more rapidly (or at
lower Pb) for ethanol than for water (2 orders of magnitude in kH)
and even faster for silicone oil (3 orders of magnitude in kH
between water and oil).
Finally, this analysis shows that hubble lifetime strongly depends on the solubility of the gas in the filling liquid. First, if the gas is highly soluble, it is expected that hubble lifetime depends only a little on filling kinetics (as for silicone oil in our study). Second, for moderately soluble gas, hubble volume
decrease is first due to mechanical compression during which Pb
increases at a rate depending on xb and finally reaches Pbd from
when dissolution induces hubble final collapse. It is interesting to
note that we recover the compression-dissolution process already encountered in capillary filling of closed end
nanochannels. 57
D. Discussion: roles of gas compression on the
imbibition process
Influence of trapped bubbles on kinetics
It can be first hypothesized that the presence of stagnant bubbles
in the liquid generates an increase in the overall hydrodynamic resistance in the invaded region and thus a possible slowdown of the capillary filling. However, the continuous creation ofbubbles also induces an increase of the liquid front velocity because the
volume to fill by the liquid is lowered. It is thus surmised that the
competition between these two processes acts on the filling kinetics and this is analyzed in what follows.
One way to model the viscous resistance induced by the presence of bubbles in the narrow nanoslits is to use the
Brink-man approximation.62
'63 It allows estimating the effective
permeability K of a slit consisting of a square periodic array of
circular plots bounded by two parallel walls, see Fig. 8. Note that such a way to model hubble viscous resistance would fail in the presence of bubbles occupying almost the entire
channel width (that would lead to highly resistant corner flows64).
Nevertheless, high magnification bubbles snapshots in Fig. 5 for
a
=
66.5 nm show that hubble size is significantly inferior tochannel width and there are no such corner films: liquid around bubbles occupies several channel depths. Bubble induced resis-tance should be much lower and can be estimated as a function of their sizes and gap spacing, as discussed in the following.
The permeability of a square periodic array of cylinders of
infinite length, Kp, can be deduced from the work of Sangani and
Acrivos:65
K()-
WZ
P e - 2f(e)' (7)
where W is the center to center distance between two plots
(bubbles) and f{e) is a coefficient depending on the surface
Top view W=w
.. ·-;;
.:
··...
/'
l
··.
.··
···
..
... ~ ... . .•
•• •.
!
•• •••
\
••
l
..
·
···~....
l
.••.
..;::::·Square periodic .···~···..
.
.
.
:.
·· ...
~..
··
Sideviewi
.···~···..
.
.
··
....
l
.. · ..
· array of plots .···i··· ...
.
111 \ • .' •• ./ Flow directionFig. 8 Sketch of the bubbles arrangement (gray plots) in a nanoslit for
fraction of the plots (bubbles) e
=
~rb2/W2where rb is the plot radius (see Fig. 8). Discrete values ofj(e) are provided in ref. 65 and for the needs of the present study they are linearly interpo-lated. According to the Brinkman approximation, the effective permeability of a slit consisting of a square periodic array of plots bounded by two parallel walls with a gap spacing of a can be estimated by:
K(e)
= Kp(e) ( 1-
tan~~a)),
(8) where Da=
a/(2(Kp(e))112). The liquid flow rate q can theo be linked to the pressure gradient along the s1it using the Darcy's law:q _ K(e) dp1
aw p,1 dx· (9)
We will fi.rst assume that the volume of the bubbles stays constant during the filling. Viscous resistance due to the presence ofbubbles is theo overestimated. Aline of plots is selected in the square periodic array of plots to account for the bubbles posi-tioning observed in the experiments (see Fig. 8). Therefore, we set
W
=
w, where w is the slit width, and we vary the hubble radiusrb. The flow rate is related to meniscus velocity taking into
account that only the fraction (1 - e) of total area is to fill by the
liquid:
dh
q
=
(1-e)aw dt. (10)Assurning a pressure gradient of 2'Yiha and combining eqn (9)
and (10) we obtain the Washburn's law corrected for the presence ofbubbles:
2 12K(e)
h(t) =A
(l _
e)a2 t =A.t, (11)where A
=
'Yacos 0/(3p,i) is the Washburn's law classical prefactor(eqn (1)). In the following, the prefactor in eqn (11), A., is compared to A in Fig. 9(a). Surprisingly, this modelling leads to the result that capillary filling should be faster than Washburn's prediction for the narrowest nanoslits and slower for the less narrow ones. This is due to the counter-intuitive hydrodynamic behaviour of the very narrow nanoslits: when a is very low, the effective permeability (eqn (8)) does not depend on the presence of the bubbles. This is shown in Fig. 9(b). At these very small scales the effective permeability K(e) is actually very close to the Hele-Shaw permeability K(O)
=
~/12 as already shown by Tsayet al. 63§ Therefore, A.f A ~ 1/(1 - e) is necessarily higher than 1
and in this case the effect of the reduced volume to fi1l is more important than the viscous resistance induced by bubbles. For less narrow nanoslits, for a> 100 nm in Fig. 9(b), K(e) is lower than the permeability of a slit free of bubbles and depends on the bubbles' size. In this case, viscous resistance induced by bubbles is sufficiently large to overcompensate the effect of the reduced volume to fill. Nevertheless, such a slowdown is not expected in our experiments because no bubbles are observed for a > 100 nm.
§ This holds except ifbubbles are extremely close and almost obstruct the
channel, this is the case for the plot for 2rtfw = 0.95 in Fig. 9(b). Such a
bubble density is unrealistic compared to our observations and furthermore analysis should include corner fiows modelling.
a)
3.5 ,---,---,--,--,-,..,..,.,~-,---,--,-,-,..,..,---,
Fig. 9 (a) Ratio of Washbum prefactor corrected for the presence of bubbles to the classical Washbum prefactor as a function of the slit
aperture for severa! bubbles sizes and a slit width of 3 IJlll. (b) Ratio
between K(e) and the permeability of a Hele-Shaw slit K(O) for the same
set of parameters as for (a).
For a< 100 nm, K(e) should theo always be ::::K(O) and bubbles formation should lead to a faster filling kinetics.
The effect of the reduced volume to fill is overestimated in this analysis because, as it has been shown above, bubbles collapse after a certain time. Therefore, depending on the bubbles life-times, the effect of the reduced volume to fill is partially compensated by the bubbles collapses. If bubbles lifetime is very short, the overall effect should be null and theo the filling kinetics should be the Washburn's one. Capillary filling experiments realized with silicone oil are close to this situation (air bubbles dissolve rapidly in silicone oil as reported in the previous section) but we still measure a filling slower than the Washburn's one. If a hubble lifetime is long, the filling kinetics is theo expected to be faster but here again we measure a filling slower than the Washburn's one, as it is the case for experiments with water.
Finally, these elements suggest that capillary filling kinetics slowdown at nanoscale cannot be explained by additional viscous resistance due to the bubbles. It is then expected to be due to other processes. The next section focuses on the possible but so far unexplored role of gas compressibility during the imbibition.
Influence of gas pressurization ahead of the invasion front
One possible explanation of the slower invasion observed in nanochannels rnight lie in the effect of the gas flow in the part of the channel occupied by the gas phase. This issue was addressed in Hultmark et al. 25 where it was shown that the viscous
resis-tance associated with the gas flow could indeed explain the deviation from classical theory. However, the gas compressibility was not taken into account in Hultmark et al. 25 and as a result the
effect of the gas phase was significant for extremely long systems only. In contrast with Hultmark et al./5 the gas compressibility is
taken into account in what follows and it is shown that a significant pressurization of the gas occurs during the imbibition process. The effect of the pressurization effect on the imbibition dynamics is theo discussed. Before, one can give a simple argu-ment explaining why the gas pressurization effect should be incorporated in the analysis of the gas pressure in the nanoslit. As shown below, the gas pressure is governed by a diffusion equa-tion whose diffusion coefficient is given by D8 ::::: Paa2/12p,g where
pressure. As a result, a characteristic time of the pressure
"diffusion" is tp = L 2/Dg, where Lis the channellength. With L =
1 mm, a = 20 mn and Pa = 1 bar for example, this gives tp :::::
300 s, which is much greater than the imbibition time ( =2 s). As a result, quasi-steady pressure profiles cannot be assumed in the gas phase and the transient effect due to the gas compressibility should be taken into account.
The situation under study is sketched in Fig. 10. The equation governing the pressure in the gas phase is obtained by combining the gas mass balance equation,
ap
_g+V·(pu)=O
at
g (12)
the momentum balance equation, which reduces to the lubrica-tion approximalubrica-tion with only one non-zero average velocity
component, the one in the direction x of the invasion
ag2
apg
U x =
-12,ug
ax
(13)where ag is the channel aperture in the gas phase (this consider-ation of the aperture for the gas phase as possibly different from
the aperture of the channel will be made clear later), the ideal gas
law
_ Mpg+Pa
Pg- RT (14)
where R is the ideal gas constant, T is the temperature, Pa
+
pg isthe total gas pressure; Pa is the pressure at the exit of the nano-channel (thus the atmospheric pressure) and Pg is the deviation from the atmospheric pressure.
This leads to the following non-linear transient diffusion equation,
apg
a
((p )
a/
ah)
at
=a
x 8 +Pa 12,uga
x (15)which must be solved subject to the following boundary conditions
Pg
=
0 at x= L (16)ah
ag2apg
- = - - - atx=h(t)
at
12,ugaz
(17)and the initial condition Pg = 0 everywhere in the slit at t = O.
The imbibition dynamics, i.e. h(t), depends in turn on the gas
pressure at the imbibition front. Taking into account the inertial
effects21 occurring at the very beginning of the process so as to
avoid the velocity singularity at t = 0 of the Washburn model, the
equation governing the evolution of the front position h (see
Fig. 10) can be expressed as (details of the derivation will be given
elsewhere ):
meniscus radius a, 12 precursorJilms
~
~
_ _ Lliquid p1(t)'"(pg(t) Jas
,~
--r
llx
l@
1 - - - -h ( t ) - - - > j
Fig. 10 Sketch of imbibition process in a slit.
d2h2 =_!_ [ho2 cos(J(!!!.__Pg(t)) - dh2] (18) dt2 to to tlm Po dt where: _ 2'Ycos (). _ p1a12• h _
~
(19) Po- a1 ' to- 12 ' o-,u 6 1 ,u1'Y is the surface tension, () the contact angle ( () = 0 throughout the
article),
,u
1 is the liquid dynamic viscosity and a1 is the channelaperture in the invaded region (a1 =a where ais the aperture of
the slit). Note that as sketched in Fig. 10, we have the possibility
to consider a radius of curvature of the meniscus different from
the classical value a1/2cos 8. This radius is denoted by a,./2. The
initial condition associated with eqn (18) is h = 0 at t =O.
From the above equations, it is clear that the imbibition dynamics and the evolution of the pressure in the gas phase are coupled. Furthermore, it can be noted that the pressure diffusion equation, eqn (15), is non-linear and should be solved over a
shrinking domain as the front moves into the slit. It seems
therefore difficult to avoid a numerical approach to the above
pro blem. The details of the method of solution will be presented
elsewhere and can be summarized as follows. To solve eqn (15)--(17) governing the gas pressure, we fust introduce a new
coor-dinate system XIH = (1 - x/L)/(1 - h(t)IL), -r = t allowing us to
express the problem in a computational domain constant in size.
The trick is the same as the one used in Camassel et al. 66 where
the interested reader can find further details. Then the equation in the fixed domain is solved numerically using the commercial simulation software COMSOL Multiphysics. Eqn (18) is solved using a variable order solver based on the numerical differenti-ation formulas (NDFs) available with Matlab. To obtain a fully converged solution, one must iterate between the solution for the gas pressure and the solution of eqn (18) governing the front dynamics. For the present article, we have used a simplified procedure in three steps. The fust step consists in solving eqn (18)
with pg(t) = 0, which thus gives the classical invasion dynamics.
In the second step, we have computed the gas pressure Pg(t)
assuming the classical invasion dynamics, i.e. using h(t) as
computed in step #1. The third step consists in solving again
eqn (18) using the solution pg(t) obtained in step #2. This
simplified procedure is sufficient to get insight into the possible impact of gas pressurization on the imbibition dynamics. Furthermore, we have distinguished two main situations depending on the possible presence of precursor liquid films along the slit walls in advance of the bulk meniscus. We begin with the simplest case where the walls ahead of the front are dry.
Case #1: dry walls in the gas region. In this case, the problem is
solved assuming ag = a1 = a,. = a. Examples of results for pure
water as working fluid are presented in Fig. 11.
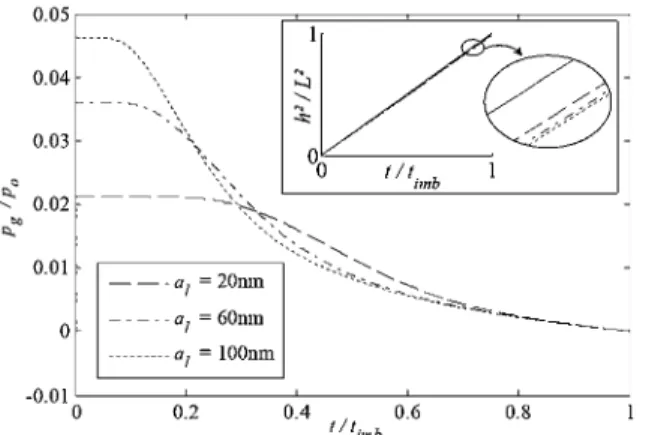
Two remarkable results emerge from Fig. 11. First the pres-surization of the gas phase is quite significant and reaches an absolute value as high as 2.5 bar (1.5 bar above the exit pressure) in the 20 mn slit for example. Second, this pressurization effect at the meniscus lasts over a significant period of the imbibition process. As can be seen from Fig. 11, the pressurization dynamics is characterized by a plateau, whose relative duration increases as the slit aperture decreases, followed by a period ofrelatively slow pressure decay as the front further advances into the slit. The
0.05 ,---~---;:::=========='1]
~
~
~0
0.04 0.03 0.01 0 a1 = 20nm a1 = 60nm ... a1=100nm~
0 0 r !r 1,b 1 -0.01 L _ _ _ _ L _ _ _ . . . L _ _ _ ---,-L.._ _ _ _ L _ _ _ 0 0.2 0.4 0.6 0.8 1 11imbFig. 11 Evolution of gas pressure at the front during the imbibition process for various slit apertures. The time is made dimensionless using
timb = 3 L2 p4(a1rcos 8) as reference time, which is the total imbibition
time given by the classical Washburn solution. The reference pressure
Po = 2rcos 8/a1 is the capillary pressure at the front. The dashed !ines in
the inset show the computed evolution of the square h2
(t)IL2 of the position of the liquid front from the nanochannel entrance. The continuous line in the inset, slightly above the dashed !ines, is the classical Washburn's law.
0.25<l.c C J 0.8 ...
"'
"'- - · - · - · - · , _ 0 :-:-:-.:-:-=-_~~-:-',~
0.6 0 1/ limb 1""'
... agla 1= 1 - -agla1= 0.5 - . - . agla1= 0.25 ----o--ag 1 a1= 0.1 0.6 0.8Fig. 12 Imbibition dynamics in the presence of liquid films in a 20 nm
slit. Results for severa! film thicknesses are presented. The inset shows the
evolution of gas pressure at the meniscus.
somewhat disappointing result is that the plateau pressure represents only a few percent of the reference pressure jump Po at the front. As a result, this pressurization effect does slow down the imbibition process but only slightly. This is illustrated in the inset of Fig. 11.
Case #2: wetted walls in the gas region. As discussed in Kavehpour et a/.,61 precursor liquid films in front of the moving
contact line can exist in the gas region. Film thicknesses as large as 100 nm have been reported in Kavehpour et al. 67 In this sub-section, we explore the possible effect of the precursor films on the gas pressurization and thus on the imbibition dynamics. For simplicity, we assume that the walls in the gas region are carpeted by a liquid film ofuniform thickness (a1 - a.,J/2. This is sketched
in Fig. 10. In addition, we have assumed that the capillary pressure at the front was not affected by the presence of the films,
Po= 2'Ycos8/ah that is llm = a1• Under these circumstances, the net
effect of the films is to reduce the gas section in the region ahead
of the front. The numerical procedure is the same as for the dry walls except that the gas section is now reduced owing to the presence of the films. The working fiuid is water as before. As a result of the reduced gas section, the gas pressurization effect increases as the liquid film thickness increases. As illustrated in Fig. 12, the effect is sufficient to slow down the imbibition dynamics significantly. For example, the case a/a1
=
0.25 in Fig. 12 corresponds to films ofthickness 7.5 nm along each wall of the slit.Owing to the simplifications made in the modelling (no effect of films on capillary pressure jump, dynamics of film precursors ignored-they are supposed to be present at ail times-possible effect of gas pressurization on film thickness ignored, possible slip effect at the film surfaces, etc.), further work is needed to assess the effect of precursor films on a more finn basis.
Note also that rarefaction effects in the gas phase68 were
neglected on the ground that a significant pressurization was expected. However, estimates of Knudsen number for the pres-sures obtained in our simulations indicate that the rarefaction effect, which increases the apparent conductance of the gas flow and thus tends to diminish the pressurization effect, is not necessarily negligible. Taking into account the rarefaction effect will not change our results qualitatively, but will reduce the pressurization effect.
Nevertheless, the simple computation presented here offers a possible explanation to the slowdown in the imbibition dynamics observed in the experiments.
E. Conclusions
W e discussed the phenomena arising during the capillary filling of narrow nanoslits, with gap of a few tens of nanometers. After a short literature survey, we described how experiments on capil-lary filling of microfabricated 20 to 400 nm deep nanoslits shed light on processes involved in nanoscale fiows. As reported previously by several authors, experiments show a slowdown compared to macroscopic prediction and the deviation increases with confinement. We presented possible origins of this phenomenon. In particular we discussed in detail the role of gas through trapped bubbles and through gas pressurization ahead of the advancing meniscus. We focussed on these effects because they are possible candidates for explaining the imbibition slow-clown at the nanoscale as they are enhanced by the confinement. Indeed, experiments showed that hubble trapping appears only below a certain nanoslit aperture threshold (<lOO nm) and theoretical analysis of the gas pressure profile showed that compressibility effect cannot be neglected in nanoslits.
Bubble formation, collapse and their effect on viscous resis-tance were analysed experimentally for three different liquids: water, ethanol and silicone oil. Nanoslit aperture threshold, below which bubbles appear, was found to depend on the liquid used. The hubble formation mechanism is still unclear but seems to be related to contact line pinning by unavoidable nanoscopic heterogeneities, since the measured aperture threshold decreases for highly wetting liquids. Further work is planned for a more accurate description of this effect. Bubble collapse was shown to follow two stages: fust, the hubble is compressed due to increase of the localliquid pressure that induces increase of gas hubble pressure; second, for sufficiently high gas hubble pressure,
dissolution leads to final hubble collapse. A simple model qualitatively explained why hubble lifetime strongly depends on the gas solubility in the liquid, as it is observed in experiments. The intuitive effect of viscous resistance induced by the presence of bubbles was estimated using an effective medium approach. Actually, this analysis showed that bubbles should not induce significant viscous resistance for nanoslit aperture <100 nm. This counter-intuitive purely hydrodynamic effect cornes from the fact that viscous resistance is mainly due to the very low nanometric slit gap which dominates over any assembly of obstacles spaced by a micrometrie distances in the slit. There-fore, nanoslit capillary filling kinetics slowdown does not seem to be due to the presence of bubbles in the filled part of the channel. However, the effect of successive contact line pinnings during the meniscus walk on the overall kinetics is not obvious and should be considered as a candidate for explaining the slowdown by a decrease of the imbibition driving force. Bubble formation seems to be controlled by contact line pinning, so that even though they do not increase the viscous resistance, their presence reveals meniscus pinning which may cause the slowdown.
Another effect that contributes to slow down of the imbibition dynamics is related to the gas compressibility. We showed from a numerical model coupling the imbibition dynamics with the evolution of gas pressure in the nanoslit that the imbibition process is characterized by a signifi.cant pressurization of the gas phase. This effect was shown to last over most of the imbibition but is more marked in a fi.rst phase that can represent almost half of the total imbibition duration for the narrowest slit tested. However, this effect is sufficient to slow down the imbibition dynamics signifi.cantly only in the presence of prewetting liquid films, reducing the gas section in the region ahead of the imbi-bition front.
Those elements show that capillarity at small scale can be complex and follows quite counter-intuitive rules, as recently demonstrated by Willmott et al. who showed the spontaneous filling of hydrophobie microcapillaries by water droplets. 69
In spite of the insights brought by the present paper, the full understanding of capillary fi.lling of nanoslits remains a subject rich in open questions such as finding the reason why bubbles are trapped; studying the influence of roughness (a recent study shows the interplay between shape and roughness for meniscus at small scales7
"); assessing the role of gas solubility.
Experiments on forced imbibition (with an external additional driving force) could be a clue to discriminate between possible mechanisms.
Other related situation are also interesting, such as fi.lling in the presence of surfactants, 71 or the case of channels with two
dimensions in the nanometer range, closely related to reduced friction recently observed in carbon nanotubes.14
•15
Nanofluidics offers numerous other situations where novel effects can be expected, in particular when the channel dimen-sions become comparable with typicallength scale: (i) molecular size for complex fluids (polymer melt or semi-dilute solutions,72
as weil as individual molecules - see works on DNA elongation and sorting, first applications of nanofluidics 7
3--76); (ii) mean free
path for gases (rarefaction effect);68 (iii) Debye screening length
for water solutions, potentially enabling electrical charge-based fi.ltering, sorting, concentrating, energy conversion.11
•12•77•78
Acknowledgements
We acknowledge CNRS and French National Research Agency for funding (Smart-US program). We thank D. Belharet, P. Dubreuil and M. Dilhan for help in microfabrication of nano-channels, and X. Dollat for the realization of the chip holder.
Notes and references
1 H. A. Stone, A. D. Stroock and A. Ajdari, Annu. Rev. Fluid Mech.,
2004,36, 381-411.
2 B. Abecassis, C. Cottin-Bizonne, C. Ybert, A. Ajdari and L. Bocquet,
Nat. Mater., 2008, 7, 785-789.
3 P. Joseph, C. Cottin-Bizonne, J. M. Benoit, C. Ybert, C. Journet,
P. Tabeling and L. Bocquet, Phys. Rev. Lett., 2006, 97, 156104.
4 Y. C. Wang, A. L. Stevens and J. Y. Han, Anal. Chem., 2005, 77,
4293-4299.
5 L. Bocquet andE. Charlaix, Chem. Soc. Rev., 2010, 39, 1073-1095.
6 R. B. Schoch, J. Y. Han and P. Renaud, Rev. Mod. Phys., 2008, 80,
839-883.
7 G. M. Whitesides, Lab Chip, 2011, 11, 191-193.
8 J. C. T. Eijkel and A. van den Berg, Microjluid. Nanojluid., 2005, 1,
249-267.
9 P. Abgrall and N.T. Nguyen, Anal. Chem., 2008, 80, 2326-2341.
10 D. Mijatovic, J. C. T. Eijkel and A. van den Berg, Lab Chip, 2005, 5,
492-500.
11 C. Davidson and X. C. Xuan, J. Power Sources, 2008, 179, 297-300.
12 C. C. Chang and R. J. Yang, Appl. Phys. Lett., 2011, 99, 083102.
13 E. Lauga, M. P. Brenner and H. A. Stone, in Handhook of
Experimental Fluid Mechanics, ed. C. Tropea, A. L. Yarin and J.F. Foss, Springer, 2007.
14 J. K. Holt, H. G. Park, Y. M. Wang, M. Staderrnann,
A. B. Artyukhin, C. P. Grigoropoulos, A. Noy and O. Bakajin,
Science, 2006, 312, 1034-1037.
15 M. Majumder, N. Chopra, R. Andrews and B. J. Hinds, Nature, 2005,
438,44.
16 K. G. H. Janssen, H. T. Hoang, J. Floris, J. de Vries, N. R. Tas,
J. C. T. Eijkel and T. Hankemeier, Anal. Chem., 2008,80,8095-8101.
17 C. Cottin-Bizonne, A. Steinberger, B. Cross, O. Raccurt and
E. Charlaix, Langmuir, 2008,24, 1165-1172.
18 J. S. Hansen, J. C. Dyre, P.J. Daivis, B.D. Todd and H. Bruus, Phys.
Rev. E: Stat., Nonlinear, Soft Matter Phys., 2011,84, 036311.
19 V. R. Lucas, Kolloid-Z., 1918, 23, 15-22.
20 E. Washbum, Phys. Rev., 1921, 17, 273-283.
21 D. Quere, Europhys. Lett., 1997, 39, 533-538.
22 M. Stange, M. E. Dreyer and H. J. Rath, Phys. Fluids, 2003, 15,
2587-2601.
23 P. Joos, P. Vanremoortere and M. Bracke, J. Colloid Interface Sei.,
1990, 136, 189-197.
24 P. R. Waghmare and S. K. Mitra, Microjluid. Nanojluid., 2012, 12,
53--63.
25 M. Hultmark, J. M. Aristoff and H. A. Stone, J. Fluid Mech., 2011,
678, 600--606.
26 J. Schoelkopf, P. A. C. Gane, C. J. Ridgway and G. P. Matthews,
Colloids Surf, A, 2002, 206, 445-454.
27 F. Leoni, E. Kierlik, M. L. Rosinberg and G. Tarjus, Langmuir, 2011,
27, 8160--8170.
28 D. Ben Jazia, L. Vonna, G. Schrodj, H. Bonnet, Y. Holl and
H. Haidara, Colloids Surf, A, 2011, 384, 643--652.
29 G. Martic, F. Gentner, D. Seveno, D. Coulon, J. De Coninck and
T.D. Blake, Langmuir, 2002, 18, 7971-7976.
30 S. Gruener, T. Hofmann, D. Wallacher, A. V. Kityk and P. Huber,
Phys. Rev. E: Stat., Nonlinear, Soft Matter Phys., 2009, 79, 067301.
31 S. Gruener and P. Huber, Phys. Rev. Lett., 2009, 103, 174501.
32 K. Bucior, L. Yelash and K. Binder, Phys. Rev. E: Stat., Nonlinear,
Soft Matter Phys., 2009,79, 031604.
33 L. Joly, J. Chem. Phys., 2011, 135, 214705.
34 B. Henrich, C. Cupelli, M. Santer and M. Moseler, New J. Phys.,
2008, 10, 113022.
35 N. R. Tas, J. Haneveld, H. V. Jansen, M. Elwenspoek and A. van den
Berg, Appl. Phys. Lett., 2004, 85, 3274-3276.
36 J. Haneveld, H. Jansen, E. Berenschot, N. Tas and M. Elwenspoek, J.