Does ownership matter? : Asia and the global operations of multinational corporations
67
0
0
Texte intégral
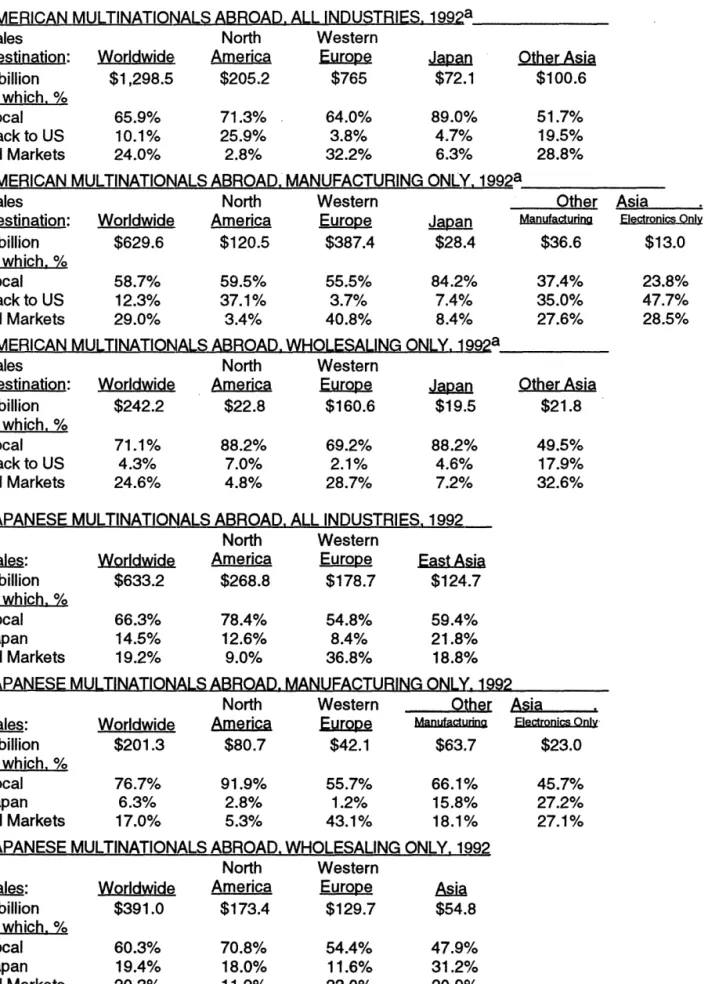
Figure
Documents relatifs