To cite this this version : Kamsu-Foguem, Bernard and
Tchuenté Foguem, Germaine and Foguem, Clovis Conceptual
graph operations for formal visual reasoning in the medical
domain. (2014) IRBM, vol. 35 (n° 5). pp. 262-270. ISSN
1959-0318
O
pen
A
rchive
T
OULOUSE
A
rchive
O
uverte (
OATAO
)
OATAO is an open access repository that collects the work of Toulouse researchers and
makes it freely available over the web where possible.
This is an author-deposited version published in :
http://oatao.univ-toulouse.fr/
Eprints ID : 12272
To link to this article
: DOI: 10.1016/j.irbm.2014.04.001
http://dx.doi.org/10.1016/j.irbm.2014.04.001
Any correspondance concerning this service should be sent to the repository
administrator:
staff-oatao@listes-diff.inp-toulouse.fr
Conceptual graph operations for formal visual reasoning in the medical
domain
B. Kamsu-Foguem
a,∗, G. Tchuenté-Foguem
b, C. Foguem
caLaboratory of Production Engineering (LGP), EA 1905, ENIT-INPT University of Toulouse, 47, avenue d’Azereix, BP 1629, 65016 Tarbes cedex, France bMAT Laboratory, UMI 209, Unit for Mathematical and Computer Modeling of Complex Systems - UMMISCO, Faculty of Science, University of Yaoundé I,
PO Box 812, Yaoundé, Cameroon
cCenter for Food and Taste sciences (CSGA), UMR 6265 CNRS, UMR 1324 INRA, University of Burgundy, 9 E, boulevard Jeanne-d’Arc, 21000 Dijon, France
Abstract Objective.!–!Conceptual!graphs!(CGs)!are!used!to!represent!clinical!guidelines!because!they!support!visual!reasoning!with!a!logical!background,! making!them!a!potentially!valuable!representation!for!guidelines. Materials!and!methods.!–!Conceptual!graph!formalism!has!an!essential!and!basic!component:!a!formal!vocabulary!that!drives!all!of!the!other! mechanisms,!notably!specialization!and!projection.!The!graph’s!theoretical!operations,!such!as!projection,!rules,!derivation,!constraints,!probabilities! and!uncertainty,!support!diagrammatic!reasoning. Results.!–!A!conceptual!graph’s!graphical!user!interface!includes!a!multilingual!vocabulary!management,!some!query!and!decision-making!facilities! and!visual!graph!representations!that!are!simple!and!interesting!for!user!interactions.!The!described!proposition!using!the!Conceptual!Graph!user! interface!(CoGui)!improves!the!performance!of!the!actors!in!the!diagnostic!context!of!heart!failure!with!preserved!ejection!fraction.
Discussion.! –! CGs! capture! the! essential! features! of! the! medical! processes! underlying! clinical! reasoning.! CGs! are! indeed! useful! as! a! way! for! the!physician!to!represent!guidelines,!and!well-defined!semantic!representations!allow!users!to!have!a!maximal!understanding!of!the!knowledge! reasoning!process.
Conclusion.!–!CG!operations!of!visual!representations!that!uncover!some!of!the!actual!complexities!of!clinicians’!reasoning!have!been!tested!in! clinical!guideline!comprehension!and!used!to!translate!text!and!diagrammatic!guidelines!into!computer!interpretable!representations.
Keywords: Knowledge representation; Conceptual graphs; Visual reasoning; Formal semantics; Clinical guidelines and protocols; Heart failure
1. Introduction: background and significance
Currently, computer systems are ubiquitous in the medical domain and are important components in health information sys-tems. Especially within the field of medical decision-making, these systems are designed to support the decision-making of junior and senior clinicians by providing a comprehensive monitoring of data analysis and understandable therapy recom-mendations[1]. Intelligent patient monitoring systems estimate the patient’s health status with its evolution and make therapy
∗Corresponding author.
E-mail address:bernard.kamsu-foguem@enit.fr(B. Kamsu-Foguem).
management suggestions[2]. The graphical user interface sup-ports the display of information for the native target platform on different workstations and the transmission of commands. These associated user interfaces can provide a clinician a dis-crete overview of a patient’s status (through clinical phases) with the detection of clinically meaningful abnormalities (e.g., a state of decreased blood volume known as hypovolemia). In such situations, the progression of hemodynamic abnor-mality is represented by a sequence of clinical phases, which reflect the involved predominant physiological process (e.g., increased pericardial pressure, vasodilatation, and hypotension)
[3]. Clinical guidelines are a valuable means of standardizing and improving health care. The computerization of the guide-line execution process is a basic step towards its pervasive use
in health care systems. Therefore, some projects focus on the direct execution of guidelines for related tasks, such as the recognition of care providers’ intentions and assessing their actions (for a review see [4]). These projects encompass the description of a machine-readable language for sharing clinical guidelines and for useful and flexible automated assistance in the execution of these guidelines. In automation initiatives, the guideline support architecture includes, among other modules, a temporal-abstraction module, a task-specific reasoning module and a domain-specific knowledge basis. As a knowledge-driven guideline enactment, the expressiveness of modern ontology languages is used to provide the semantics required to sup-port the execution of clinical guidelines[5]. Meanwhile, there are some issues that restrict their application, such as therapeu-tic recommendations that do not illustrate very comprehensive expressions. One of the most fundamental questions is how to specify a visual language. Indeed, many approaches have been used in textual logic formalisms for reasoning with a declarative specification of control. Another option is the direct incor-poration of visual expressions into a logical formalism, thus connecting the reasoning capabilities of logical systems with the expressiveness of graphical communication. The roots of formal visual reasoning date back to Charles Sanders Peirce and his existential graphs, which are a visual notation for first-order logic [6]. Sowa’s work defines a formal reasoning system of well-formed diagrams as conceptual graphs that can be used as a valid basis of formal proofs[7]. The work of Chein and Mug-nier extends this idea by integrating graph theory operations into conceptual graph formalism, thus obtaining the ability to visually specify consistent knowledge representations and for-mal reasoning[8]. These authors formulate valid transformation rules for reasoning with conceptual graph operations that are defined by mapping them to predicate calculus theory. Thus, graphical reasoning rules are just as powerful and valid as their textual counterparts. For this reason, we are interested in using visual expressions as a means of logical reasoning instead of the desire to use logic for reasoning about visual expressions. Therefore, our work is considerably concerned with the formal syntactic specifications of diagrams that are well-founded and complete with respect to logical semantics, precisely in the con-text of medical knowledge representation. The remainder of this paper is organized as follows: Section2presents materials and methods with conceptual graph formalism. Section3provides useful reasoning principles from effective CGP modeling appli-cations. Sections4 and 5 present discussions with concluding statements about the proposed formal visual approach for the medical domain.
2. Materials and methods
2.1. Conceptual graph formalism
2.1.1. Formal vocabulary with support
A support is a 3-tuple S = (TC, TR, I) [9]. TC and TR are
two partially ordered finite sets, respectively, of concept types and relations types. TRis partitioned into subsets TR1. . .TRkof
relation types of arity 1. . .k, respectively (k ≥ 1). Both orders on
TCand TRare denoted by ≤ (x ≤ y means that x is a subtype of
y). I is a countable set of individual markers describing specific entities. TC, TRand I are pairwise disjoints. All supports also
possess the marker *, known as a generic marker describing an unspecified entity. The set I ∪{*} is partially ordered in the following manner: * is the greatest element and elements of I are pairwise incomparable.
2.1.2. Definition of a simple conceptual graph
A simple conceptual graph G, defined over a support S, is a finite bipartite multigraph (V = (VC, VR), E, L)[8]:
• VC and VRare the node sets, respectively, of the concepts
nodes and of the relations nodes;
• E is the multi-set of edges. Edges incident to a relation node are totally ordered;
• each node has a label given by the mapping l. A relation node
ris labeled by type (r), an element of TR, and the degree of r
must be equal to the arity of type (r);
• a concept node c is labeled by a pair (type (c), marker (c)), where type (c) is an element of TC known as its type, and
marker (c) is an element of I ∪{*}.
2.2. Conceptual graph operations
Conceptual graph operations provide operational mecha-nisms, such as inference mechamecha-nisms, allowing for manipula-tions to which the knowledge-based system is dedicated. For instance, to perform automatic reasoning, the conceptual graph operations allow for the representation of derivation rules and for the effective application of these rules to a set of facts with constraints. This application is useful for specifying and sharing decision and eligibility criteria, patient state definitions, condi-tions, and system actions.
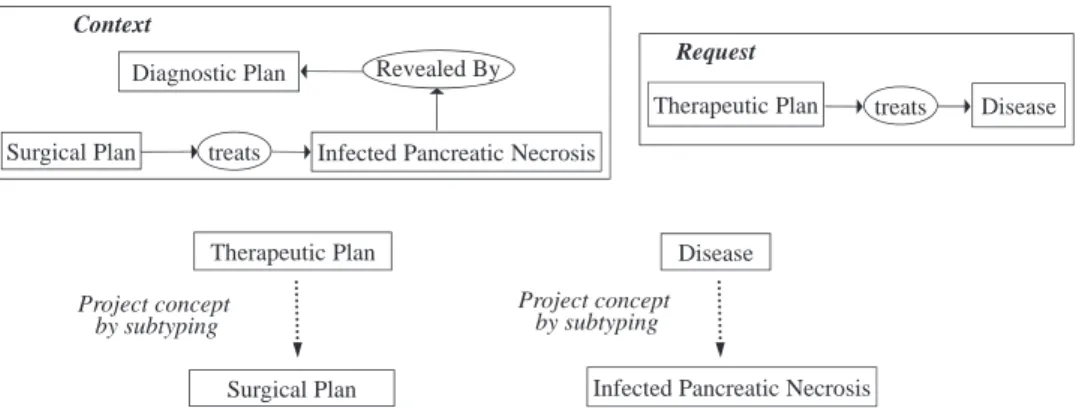
The fundamental operation for performing these reasoning mechanisms is the projection, which leads to a calculation in the specialization between two graphs. Indeed, the projection search of a graph G (request graph) in a graph H (context graph) can be observed as the inclusion search of the knowledge repre-sented by G in H. Intuitively, the existence of a projection from G to H means that the knowledge represented by G is contained in (or implied by) the knowledge represented by H, and the projection operation is a global view of a specialization opera-tion sequence (the elementary specializaopera-tion operaopera-tions [disjoint sum, join, restrict, relation simplify and copy] that is graphi-cally and logigraphi-cally defined in[10]). The reasoning processes are logically founded because the projection is well-founded and complete with respect to the deduction in first-order logic[11]. Another essential point is that the reasoning processes operate directly on the defined pieces of knowledge and can be visually explained to the end user. Within our work, the projection oper-ation is used to search for the existence or absence of certain states/plans in a CGP representation. InFig. 1, a projection is feasible because the concept “Surgical Plan” is a specialization of the concept “Therapeutic Plan” and because the “Infected Pancreatic Necrosis” concept is a specific type of “Disease”. The context graph can be interpreted as “There is an Infected
Context
Diagnostic Plan Revealed By
Therapeutic Plan treats
Request Disease Disease Surgical Plan Therapeutic Plan Project concept by subtyping Project concept by subtyping treats Surgical Plan
This subgraph is obtained from context graph
by projection of request graph
treats Infected Pancreatic Necrosis Surgical Plan
Infected Pancreatic Necrosis
Infected Pancreatic Necrosis
Fig. 1. Example of a projection search.
Pancreatic Necrosis revealed by a Diagnostic Plan, and a Sur-gical Plan treats this disease (Infected Pancreatic Necrosis, the most severe form of acute pancreatitis, which is responsible for most cases of pancreatitis-related morbidity and mortality)”. The request can be interpreted as “is there a Therapeutic Plan treating a disease?” The projection graph provides the response, which can be interpreted as “There is Surgical Plan that is treating an Infected Pancreatic Necrosis”. The current medical philosophy is to perform surgery in a later phase of the acute necrotizing pan-creatitis when the intensive non-surgical treatment fails[12]. An example of a projection operation is described in the following (Fig. 1).
This conceptual graph projection can be extended with an implementation of a depth-attenuated distance (between types in the vocabulary) or graph transformations, allowing for an approximate search[13,14].
2.3. Graph rules and derivation
The conceptual graph rules allow for the addition of new knowledge. The graph rule is composed of a hypothesis and a conclusion and is used in the classical way. Given a simple graph, if the hypothesis of the rule projects to the graph, then the information contained in the conclusion is added to the graph. Logical semantics: it has previously been demonstrated that conceptual graph rules can be described by means of a first-order logic augmented with temporal operators[15]. A conceptual rule
R(G1⇒G2) is a pair of l-abstractions (lx1,. . .,xnG1,kx1,. . .,xn
G2), where x1,. . .,xn, known as connection points, enable one
to link concept vertices of the same label of G1 and G2. The
logical interpretation of a conceptual rule R (G1⇒G2) is defined
as follows: 8 (R) = ∀x1 . . . ∀xn 8(lx1 . . . xnG1) ⇒ 8 (lx1
. . .xnG2). The semantic 8 (provided in [Sowa 84]) maps each
simple conceptual graph G into a first-order logic formula 8 (G). When a rule is applied in a forward chaining to a conceptual graph, the information of the rule is added to the conceptual graph.
Rules are categorized as static rules and dynamic rules.
2.3.1. Static rules
Static rules express some immutable domain laws, and their utilization completes word descriptions. For a medical knowl-edge model to support common-sense query processing, it must provide a set of rules of deduction, known as axioms. Some specific mathematical relations (such as symmetry, transitiv-ity) can be defined with static rules expressing knowledge, which is valid every time and reflects the common sense of the medical domain. For example, the notion of a symmetric relation is described with the conceptual graph type, which semantically characterizes the class of all relations that are symmetric. For this purpose, a rewrite rule is implemented to reflect the semantics of a symmetric relation. According to the rule notation in conceptual graphs, the explicit repre-sentation of this symmetry property of a relation is shown in
Fig. 2. The logical interpretation of the conceptual graph rule R for a symmetry property of a relation is defined as fol-lows:
8(R) = ∀x, ∀y (Concept Type (x) ∧ symmetric relation (x, y) ∧ ConceptType (y) ⇒ ConceptType (x) ∧ symmetric relation (y, x) ∧ Concept Type (y)).
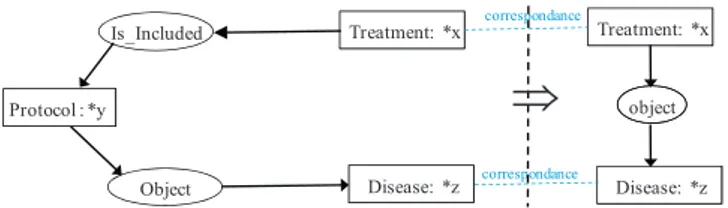
InFig. 3, another rule is presented in the style of the diagram-matic representation of conceptual graphs. More formally, this rule says: “for all treatments x, protocols y and diseases z, if y has for object z, then x and y are pertaining to a common disease z”.
Fig. 2. The CG rule that encodes for the symmetry property of symmetric relations.
Fig. 3. Example of a static rule in a diagrammatic representation of CGs.
2.3.2. Dynamic rules
Dynamic rules define possible transitions from one word to another. The successor of a valid word is obtained by a single application of a transformation rule on this word. The condition of an ICU patient often changes, and the medical support that he/she requires can vary at any time. Therefore, it is vital to review major medical measurements frequently and to change the treatment settings accordingly with respect to the appli-cation of a guideline. Capturing CGPs in ICUs also includes treating time-oriented, dynamically changing, and vague infor-mation and data due to the time critical situation, which asks for time critical actions. Likewise, dynamic graph rules are useful to explicitly express some temporal properties, which include concurrent, cyclical and sequential actions (e.g., to perform his-tory and physical examinations before ordering certain tests). Experimental results will show the major rules according to the efficiency of the execution devices corresponding to medi-cal decision-making, such as a respiratory monitoring expert system that recommends action be taken to avoid breathing complications[16]. Rules are of the form: “If qualitative state then action”, where qualitative state can be a symbolic represen-tation of a change in pulmonary arterial pressure over time (e.g., “pressure is rising rapidly”,Fig. 4). Pulmonary hypertension is present when the mean pulmonary artery pressure exceeds 25 mm Hg (3300 Pa) at rest or 30 mm Hg (4000 Pa) with exer-cise[17]. More generally, it is possible to model the fact that (1) a state in the guideline is active, (2) an action has been performed or (3) the patient has a specific clinical condition.
Medical rules such as IF [Diagnosis: Infection] THEN [Order] → (Object) → [Therapy Plan: X] certainly have a dynamic interpretation: if at a time interval [t1 t2] a diagnosis of a state (e.g., a qualitative state of rising fever, or a rising concen-tration of antibodies) of infection has been reached, then the therapy plan X for diagnostics of the infection should be started after t2. Some specific heuristics are defined with rules express-ing knowledge, which are valid only after a longer time period
Fig. 4. Example of a dynamic rule of the form “If a qualitative state, then action”.
and reflect very individual experiences with patients. Due to the correspondence between conceptual graphs and RDFS (resource description framework schema) language[18], conceptual graph rules can also be represented in SWRL (Semantic Web Rule Lan-guage[19]) rules and vice versa without losing their semantic meaning. Rules expressed in formalisms such as RuleML (Rule Markup Language[20]) or SWRL additionally allow for one to specify the actions to take, knowledge to derive, or constraints to enforce. This approach suffers from a series of drawbacks due to the expressiveness and visual capabilities of SWRL. In addition, there are some mappings between subsets of CGs and subsets of description logics (DLs)[21,22]and its different ver-sions, including Web Ontology Language-DL (OWL-DL)[23], because of their common ancestral existential graphs.
2.4. Positive and negative constraints
A constraint defines conditions for a simple graph to be valid. It is composed of a conditional part and a mandatory part. Roughly speaking, a graph satisfies a constraint if for every pro-jection of its conditional part, its mandatory part also projects on the graph[15]. We consider positive and negative constraints. A positive constraint expresses a property such as “if informa-tion A is present, then informainforma-tion B must also be present”. For example, “any patient with impaired lung function must have a medical assistance to maintain artificial oxygen and normal car-bon dioxide levels or patients should be managed in the intensive care environment if they have any cardiovascular instability, are unable to maintain an airway, have obtundation or acute abdom-inal symptoms”[24]. A negative constraint expresses a property such as “if information A is present, then information B must be absent”. An example of a negative constraint is “a patient must not receive two incompatible treatments”. Another example is “a therapy failure context that leads to a rather unsatisfactory situation in which the treatment is incompatible with the current diagnosis”. InFig. 5, the first part of the previous example fits to the “therapy failure context” box because it describes a situation in which the therapeutic plan (start 2/3/2012 and end 5/6/2012) is unsatisfactory because the disease is not regressive (no ame-lioration in the state of a patient) and because the second part contains an incompatibility with the current diagnosis.
More generally, conflict contexts express that data are viewed to be inconsistent or that medical plans may raise conflicts and that certain links between them are then not allowed due to their characteristics. The semantic verification of a guideline repre-sentation consists in checking that the guideline reprerepre-sentation
respects a set of constraints given by a medical expert. This ver-ification is performed by means of the projection operation of conceptual graphs.
The mechanism of the semantic verification of a conceptual graph consists of checking that a projection from any positive constraint exists and that a projection from any negative constraint does not exist in this conceptual graph[15]. Thus, it becomes easy to visually show to the user where the anomalies occur with the identification of the constraints that are not satisfied in terms of conceptual graphs, which is very similar to the manner CGPs are modeled. In turn, this fact simplifies the application of our approach because the medical expert does not have to take care of the technical details of a complex logic formula. Additionally, it is possible to study the refinement restoring the coherence and completeness of a conceptual graph knowledge base, which is not semantically valid with respect to constraints[25].
2.5. Modeling probabilities and uncertainty
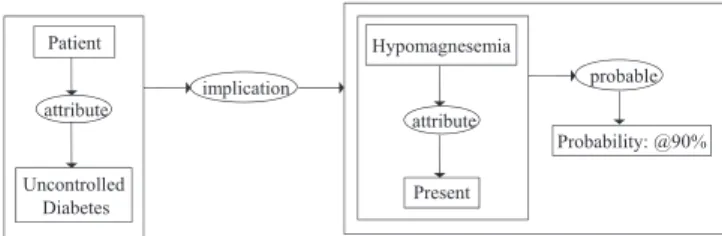
Conceptual graphs support the modeling of probabilistic or uncertain knowledge: knowledge about which we are not com-pletely sure, or where we can only make predictive statements based on our past observations. There are at least two differ-ent ways to consider probabilistic situations from a knowledge point-of-view. One is that we know for certain that the situ-ation will exist in a certain percentage of the time. Another is that there is some causal relationship between the situa-tion and some other situasitua-tion(s). Complex and multifactorial metabolic changes very often lead to damage and the functional impairment of many organs, such as blood vessels (angiopa-thy) or the hypomagnesemia in diabetes mellitus. During diabetes, metabolic remodeling precedes the microangiopathy (retinopathy, neuropathy, nephropathy or cardiomyopathy) and the hypomagnesemia that may manifest as arrhythmias, mus-cle weakness, convulsions, stupor, and agitation. In particular, it is possible to represent in a conceptual graph form probabilis-tic situations, such as the “hypomagnesemia may be present in up to 90 percent of patients with uncontrolled diabetes[26]” (Fig. 6). Unless the patient is in renal failure, the administration of magnesium is safe and physiological[27]. An important fea-ture of a conceptual graph system for probabilistic reasoning is that its active relations (computer codes with pragmatic intent) can glean probabilities from available external sources, either from tables, previously performed correlations or by the data mining of relevant information from databases[28].
In addition, Thomopoulos et al. have introduced an extension of the conceptual graph model suitable for the representation of
Fig. 6. Example of probabilistic effect modeling.
data, which are modeled using fuzzy sets[29]. This extension introduces a new way of comparing conceptual graphs, which uses a more flexible comparison of fuzzy conceptual graphs and allows us to exploit the semantic similarity of knowledge in prediction methods. From reasoning and problem solving view-points, the resulting advantage is the ability to reach conclusions from some modeled situations even if some of the conditions are not really precise or uncertain[30].
3. Results
The proposed methodology is implemented in the Concep-tual Graph user interface (CoGui). CoGui is a user-friendly tool for building conceptual graph knowledge bases with a semantic query mechanism as well as an inference and verification ser-vices, which are provided by the projection operation, inference rules and constraints[31].
3.1. Verification of CGPs’ properties
CoGui provides a tool suite for formal specification and auto-matic model-based verification[32]. The verification approach, in the sense of formal evidence, consists of proving properties by implementing a set of reasoning mechanisms (backward, forward and consistency checking). In other words, function-alities for proving the CGP’s logical properties will result in the application of graph rules and constraints to other graphs representing the process of the CGP until we obtain the graph describing the property. The demonstration of a property is per-formed in two steps[33]. It consists of applying the effective rules to the graph describing a process of the CGP and then considers domain constraints to establish the consistency of the resulting graph. Finally, such proof shall be established because there is a projection of the property in the last graph constructed.
3.2. Interpretation of the verification findings
The purpose of verification is to prove (or disprove) that a CGP or its model satisfies specified properties, and it is instruc-tive to interpret failures of proof. Failures of proof relating to the result of a model do not satisfy a property, can highlight a failure (redundancy, inconsistency, incompleteness) in the considered model and can help remove undesirable situations that interfere with a coherent approach to interventions[34]. For example, contradictions in the model can mean some interesting ideas about the review and update of the protocol. These contradic-tions may reflect conflicting or infeasible specificacontradic-tions in the current functioning, the confusion of terminology and objectives or the limits of resource capacity. In the formalization of our case studies, we considered failures resulting in proof verification as a means to discover problems and then we acquired new knowl-edge to supplement or redefine the description of the processes implemented by the protocol.
3.3. Details of the implementation
The implementation of this model in the CoGui software allows the automatic processing of reasoning that can be viewed
as graph operations: response to a question by selecting a sub-graph, enrichment of knowledge through the insertion of a sub-graph or verification of a knowledge base with constraints checking. In our contextual case, trained physicians can use the CoGui editing tool to translate structured textual form of information into an executable model of formalized knowledge (production rules for typical medical procedures).
Furthermore, the integration of the CoGui software tool into the work processes of all users requires a socio-technical approach taking into account the human, organizational and technological factors that influence the “usability”, adoption and ownership by clinicians.
Beyond the work processes of clinicians, the consideration of the attributes associated to local context in the deployment of a medical information system greatly affect the success or failure of the system. In particular, in our context, the following factors have a positive impact on physician performance:
• system integration with other applications in the clinical infor-mation system;
• the incorporation of the objectives of quality, safety and effi-ciency of care, useful feedback to the clinician;
• presentation by the system of elements and recommendations that can assist the clinicians in addressing complex problems; • their possible insertion points in the clinical work processes
through reviews, documented policies and procedures. The semantic verification of a compliance checking between clinical guidelines and specified requirements consists in checking that the clinical guideline models respects a set of specifications described in a target list of medical procedures. This verification is done by means of the reasoning operations of conceptual graphs (specifically semantic graph mapping). Structure-preserving mappings between two conceptual graph structures are the major formal procedures for different reason-ing mechanisms with conceptual graph operations (projection, rules and constraints), and there are based on the logical sub-sumption when considering the logical formulas associated with conceptual graphs.
However, the running time of conceptual graph operations is in general exponential, for numerous special classes of graphs (e.g. Acyclic graphs, Planar graphs, Permutation graphs), the conceptual graph operations have polynomial-time algorithms, and in practice it can habitually be solved efficiently[35]. It has been showed that the query evaluation and query containment problems of relational structures and databases are equivalent to the fundamental reasoning (i.e. semantic graph mapping) with conceptual graph operations, in the case of conjunctive, positive and non-recursive queries[8].
3.4. Diagnosis of heart failure with preserved ejection fraction
The evaluation is conducted using a conceptual graph modelling applied to the diagnosis of Heart failure in the Elderly. The importance of early identification of a Heart failure in elderly patients cannot be overemphasized. Particularly,
the appropriate analysis of some features of heart failure with preserved ejection fraction (HFpEF) is an essential health issue. Four clinical queries have been established with a geriatric specialist and a co-author of this document. These queries are inspired by the diagnostic flow chart for heart failure with preserved ejection fraction[36]and the diagnostic criteria take account of clinical evaluation of haemodynamic and muscular pump performances. The specific details of these queries are inseparable from the level of complexity facing geriatricians and cardiologists today (Table 1).
A number of nine physicians have participated in the eval-uation of the proposed approach for semantic modelling and visual reasoning of medical knowledge with conceptual graph representation. The average consistency mark for query types answered with CoGui and classical textual way are compared with this preliminary evaluation done in the geriatric context. This is performed on patients with HFpEF to assess diagnosis and analysis elements to be taken into account together with the improvement of its interpretation to adapt to various clinical situations. CoGui has encouragingly greater consistency marks for all types of queries when compared to classical way with textual documents (Table 2).
According to the obtained results associated with the gathered opinions of the nine participating physicians, we can conclude the described proposition using the CoGui software improves the performance of the actors in the diagnostic context of heart failure with preserved ejection fraction.
Table 1
Instances of the four clinical queries used in the preliminary evaluation. Complexity Instances of queries
Easy evaluation To find the symptoms or clinical signs of heart failure (left-sided failure, right-sided failure or biventricular failure)
Moderate evaluation To verify the preserved haemodynamic pump performance in transthoracic echocardiography: LVEF > 50%, LVEDVI > 97 mL/m2
Hard evaluation To control the dysfunction of muscular pump performance resulting in impaired relaxation, suction and filling [blood flow Doppler, tissue Doppler imaging, Magnetic Resonance Imaging (MRI), invasive haemodynamic measurements and in some instance blood biomarkers (Natriuretic brain protein – BNP – and N-terminal pro-brain natriuretic peptide – NT-proBNP)]
Hardest evaluation To establish a diagnosis of heart failure with preserved ejection fraction
Table 2
Average consistency mark per query type in the evaluation. Complexity Average consistency mark
CoGui Classical way Easy evaluation 7/9 = 0.78 6/9 = 0.67 Moderate evaluation 8/9 = 0.89 4/9 = 0.45 Hard evaluation 8/9 = 0.89 6/9 = 0.67 Hardest evaluation 8/9 = 0.89 6/9 = 0.67
4. Discussion
In this section, we report on our observations during the mod-eling phase of the guideline. The proposed conceptual graph approach is currently being tested in a French Hospital Center. We have currently used this approach for guideline represen-tation only in collaboration with the medical doctors of this hospital. During the modeling phase with conceptual graphs, the preliminary results observed demonstrated that end-users have an easier time constructing usable guidelines and that this manner of representing machine-readable guidelines is interest-ing for enablinterest-ing appropriate decision support. The formalization of such guidelines in the conceptual graphs formalism is easily performed by knowledge engineers in a close collaboration with medical domain experts. This formal medical knowledge repre-sentation enables us to provide an unambiguous scheme of the medical decision process (causal and revision contexts), to draw the medical domain expert’s or knowledge engineer’s attention to data entries that do not exactly fit into the current view of the patient’s situation (e.g., it supports reminder messages about conflict contexts when a graph constraint is violated), and to sup-port the decision process by providing knowledge that is suitable for use in a plan of action for a patient. In addition, intuitive and visual descriptions have been shown to improve understanding and self-management in patients with chronic diseases[37].
4.1. Comparison to alternative clinical models
The conceptual graph models have advantages over frame-based models in expressing certain forms of modeling (e.g. mapping properties into nested contexts) and in providing a visual reasoning that facilitates an intuitive understanding. In addition, conceptual graphs can be easily translated into the ter-minology of some other approaches in knowledge engineering, such as Resource Description Framework Schema (RDFS)[18]
and the Web Ontology Language (OWL)[19]mainly applied in connection with the Semantic Web framework[38]. As a result, it generates the possibility to interact and exchange the modeled knowledge with internal and external collaborators.
In fact, modern terminologies (e.g., SNOMED-CT and NCI Thesaurus) are being formalized using Description Logics (DLs)
[39]. Since DLs and CGs are both rooted in semantic networks and logically founded, the question of their relationships has often been asked. As well as similarities between DLs and CGs, there are specific interesting features: cycles, n-ary relations, and type-hierarchy for CGs, the style of symbolic, variable-free formulas, variety of constructors with different levels of expres-siveness for DLs. Besides visual reasoning facilities, the syntac-tical possibilities of the graphs, including identity, graphs that contain circles, graphs that are not connected, etc., allow graphs to be constructed that do not have counterparts in DLs[40].
The work of Carloni et al. connects topic maps and concep-tual graphs. They show that the topic maps (and especially those describing the domain ontology and annotation base) can be reliably linked to a subfamily of conceptual graphs [32]. The transformation from topic maps to conceptual graphs is for-mal and reversible, which allows, on one hand, integration of
graphical reasoning outcomes into a knowledge management tool based on topic maps and, on the other hand, enrichment of this tool by conceptual graph operations (constraints and rules) for consistent verification and inference of useful knowledge.
4.2. Evaluation through experiences with clinicians
The formalized knowledge modeling approach can be imple-mented on various parts of clinical activities (prevention, diagnosis, treatment, medical follow-up of patients, etc.). Mean-while, we are primarily interested in the management of acute or chronic diseases (cardiovascular diseases, diabetes, neurodegen-erative diseases, etc.). In the purpose to standardized practices for doctors in the same country and across the world, medi-cal guidelines are established to benefit from emerging medimedi-cal advances, latest discoveries in others scientific fields and soci-etal evolution. These recommendations and guidelines based on evidence-healthcare, quality, consistency and costs, are gener-ated by associations of experts (“consensus conferences”) that disseminate up-to-date knowledge and best practices.
These guidelines are not static and need to be revisited when a discovery is done or new practices from a doctor or some doctors are approved by their colleagues during international or national consensus conferences or diseases consortium. The continued training of doctors allows also changes or new strategies for the prevention, diagnosis and treatment of diseases. The process of knowledge formalization requires the analysis, adaptation and progressive structuring of clinical guidelines and validation of resulting knowledge bases. This structuring process also allows identifying the ambiguities that need to be resolved; it also helps to identify incompleteness of guidelines on certain clinical situa-tions. These situations already need to be carefully examined and in many cases require explicit recommendations that per-tain to the type of information collected and the type of clinical guidelines being used.
For instance, with regard to conceptual graph modelling applied on diagnosis of Heart failure in the Elderly, the contin-uous identifications of some features of HFpEF is important. Conceptual graphs allow us to make dynamic knowledge modelling with visual interactions and this can contribute to providing appropriate medical care for this disease. HFpEF is the clinical syndrome of heart failure associated with normal or near-normal systolic function. HFpEF is particularly com-mon in older hypertensive women, and hypertension plays a key role in its pathophysiology[41]. Despite these worrisome epidemiological trends, pathophysiological mechanisms under-lying HFpEF and diagnostic or therapeutic strategies remain uncertain. Treatment of HFpEF remains empirical and centered around the control of blood pressure and volume status[42].
The formal knowledge representation with conceptual graph formalism is used to describe and understand the knowledge ele-ments extracted from clinical recommendations or expert advice as in the example above. In view of the reasoning operations through conceptual graph knowledge representation, we are in a dynamic process that invites the reader to participate in the con-struction of semantic modeling which facilitates identification of ambiguities, inconsistencies and incompleteness. Furthermore,
the integrated management of clinical guidelines, as the man-agement of the entire medical knowledge representation, is a pro-active process that has to be reactivated at regular intervals to keep up with the dynamic collaborations among the members of the medical scientific community in order to improve certain procedures in complex disease management.
5. Conclusion
In this document, we present an approach using the expres-sive power of visualization within conceptual graph formalism, and these graph operations are used as a valid basis of formal reasoning. This process defines a formal reasoning system of well-formed diagrams and specifies semantic relation-ships between these diagrams. Reasoning with diagrammatic representations enables a system to draw inferences from diagrammatic information, to solve problems posed diagram-matically, and to communicate visual findings and lessons learned[43]. The rigorous formalization of CGPs with diagrams of CGs is performed, and visual transformation procedures are applied. Therefore, provable CGP properties, defined by health care organizations, can be established using only visual proce-dures. The proposed approach makes a casual assessment of their potential benefit to the formal modeling of CGPs that can assist with the detection and the explanation of new and poten-tially threatening events. For example, the physician’s attention can be drawn to significant changes in the patient’s clinical signals, and the diagnostic conclusions provided by the CGP’s recommendations can be translated into CGs according to the particular setting (e.g. diagnosis of HFpEF). Likewise, the rea-soning process can follow the user’s natural cognitive processes and structures[44,45]. The advanced focus will be on the wide spread deployment of proposed reasoning systems for the inter-action between the CoGui tool and an intelligent monitoring system with large biomedical ontologies alignment[46]in oper-ating rooms and intensive care units. Further validation tests should be planned before evaluating the developed user inter-face during clinical testing in the operating theater. We are also interested in the emerging trends impacting on electronic healthcare reports in decision-making[47]. In addition, in other medical applications[48,49], we have emphasized the temporal reasoning formalization in conceptual graphs.
Disclosure of interest
The authors declare that they have no conflicts of interest concerning this article.
References
[1] German E, Leibowitz A, Shahar Y. An architecture for linking medical decision-support applications to clinical databases and its evaluation. J Biomed Inform 2009;42(2):203–18.
[2] Klimov, Shahar Y, Taieb-Maimon M. Intelligent querying, visualization, and exploration of the time-oriented data of multiple patients. Artif Intell Med 2010;49(1):11–31.
[3] Kamsu-Foguem B, Tchuenté-Foguem G, Allart L, Zennir Y, Vilhelm C, Mehdaoui H, et al. User-centered visual analysis using a hybrid
reasoning architecture for intensive care units. Decision Support Systems 2012;54(1):496–509.
[4] Isern D, Moreno A. Computer-based execution of clinical guidelines: a review. Int J Med Inform 2008;77(12):787–808.
[5] Isern D, Sánchez D, Moreno A. Ontology-driven execution of clinical guidelines. Comput Methods Programs Biomed 2012;107(2):122–39. [6] Don Roberts D. The existential graphs of Charles S. Peirce (Approaches to
semiotics). 1st ed De Gruyter Mouton; 2009.
[7] Sowa J. Conceptual structures: information processing in mind and machine. The Systems Programming Series (Hardcover) Boston, Mas-sachusetts, USA: Addison-Wesley Longman Publishing Co., Inc; 1984. p. 481.
[8] Chein M, Mugnier M-L. Graph-based knowledge representation: compu-tational foundations of conceptual graphs. Series: advanced information and knowledge processing. London, United Kingdom: Springer; 2008 [445 pages, Hardcover, ISBN 978-1-84800-285-2].
[9] Sowa JF. Knowledge representation: logical, philosophical, and computa-tional foundations. Pacific Grove: Brooks Cole Publishing Co; 2000. p. 608 [ISBN 0-534-94965-7].
[10] Mugnier ML. On generalization/specialization for conceptual graphs. J Exp Theoretical Artif Intell 1995;7(3):325–44.
[11] Chein M, Mugnier M-L. Conceptual graphs: fundamental notions. Artif Intell Rev 1992;6(4):365–406.
[12] Uomo G. Nonsurgical treatment of infected pancreatic necrosis: a falling myth or a still impassable frontier? JOP 2007;8(4):468–70.
[13] Achour SL, Dojat M, Rieux C, Bierling P, Lepage E. A UMLS-based knowledge acquisition tool for rule-based clinical decision support system development. J Am Med Inform Assoc 2001;8(4):351–60.
[14] Genest D, Chein M. A content-search information retrieval process based on conceptual graphs. Knowledge Inform Syst 2005;8(3):292–309. [15] Baget J-F, Mugnier M-L. Extensions of simple conceptual graphs: the
complexity of rules and constraints. J Artif Intell Res (JAIR) 2002;16: 425–65.
[16] Guyet T, Garbay C, Dojat M. Knowledge construction from time series data using a collaborative exploration approach. J Biomed Inform 2007;40(2007):672–87.
[17] Nauser TD, Stites SW. Diagnosis and treatment of pulmonary hypertension. Am Fam Physician 2001;63(9):1789–98 [PMID 11352291].
[18] Yao H, Etzkorn L. Automated conversion between different knowledge representation formats. Knowledge Based Syst 2006;19(6):404–12. [19] Horrocks I, Patel-Schneider PF, Bechhofer S, Tsarkov D. OWL rules: a
proposal and prototype implementation. Web Semantics: Science, Services and Agents on the World Wide Web 2005;3(1):23–40.
[20] Park S, Kyu Lee J. Rule identification using ontology while acquiring rules from Web pages. Int J Hum Comp Stud 2007;65(7):659–73.
[21] Borgida A. On the relative expressiveness of description logics and predi-cate logics. Artif Intell 1996;82(1/2):353–67.
[22] Motik B, Cuenca Grau B, Horrocks I, Sattler U. Representing ontolo-gies using description logics, description graphs, and rules. Artif Intell 2009;173(14):1275–309.
[23] Jiménez Ruiz E, Cuenca Grau B, Horrocks I, Berlanga R. Supporting concurrent ontology development: framework, algorithms and tool. Data Knowledge Eng 2011;70(1):146–64.
[24] Magee MF, Bhatt BA. Management of decompensated diabetes. Diabetic ketoacidosis and hyperglycemic hyperosmolar syndrome. Crit Care Clin 2001;17(1):75–106.
[25] Dibie-Barthélemy J, Haemmerlé O, Salvat E. A semantic validation of conceptual graphs. Knowledge Based Syst 2006;19(7):498–510. [26] Regg D, Stoner MD. Hyperosmolar hyperglycemic state. Am Fam
Physi-cian 2005;71(9).
[27] Kitabchi AE, Nyenwe EA. Hyperglycemic crises in diabetes mellitus: diabetic ketoacidosis and hyperglycemic hyperosmolar state. Endocrinol Metab Clin North Am 2006;35(4):725–51.
[28] Delugach HS, Rochowiak D. Grounded Conceptual Graph Models. Proceedings of the 16th International Conference on Conceptual Structures (ICCS 2008). In: Eklund P, Haemmerlé O, editors. Conceptual structures: knowledge visualization and reasoning. Toulouse (France): LNAI 5113; 2008. p. 269–81.
[29] Thomopoulos R, Buche P, Hammerlé O. Representation of weakly struc-tured imprecise data for fuzzy querying. Fuzzy Sets Syst 2003;140(1): 111–28.
[30] Buche P, Dibie-Barthélemy J, Hammerlé O, Thomopoulos R. Fuzzy con-cepts applied to the design of a database in predictive microbiology. Fuzzy Sets Syst 2006;157(9):1188–200.
[31] Team GraphIK. CoGui (Conceptual Graphs user interface); 2012 [User guide, document available at the following web site:http://www2.lirmm. fr/cogui/index.php. Last accessed April 04, 2014].
[32] Carloni O, Leclère M, Mugnier M-L. Introducing reasoning into an indus-trial knowledge management tool. Appl Intell 2009;31(3):211–24. [33] Kamsu-Foguem B, Chapurlat V. Requirements modeling and formal
anal-ysis using graph operations. Int J Prod Res 2006;44(17):3451–70. [34] Kamsu Foguem B, Tchuenté Foguem G, Foguem C. Using conceptual
graphs for clinical guidelines representation and knowledge visual-ization. Inf Syst Front 2012 [Impact Factor: 1.596 (2010), Article accepted for publication: Online FirstTM, 15 July 2012, DOI information:
10.1007/s10796-012-9360-2].
[35] Arvind V, Torán J. Isomorphism testing: perspectives and open problems. Bull Eur Assoc Theoretical Comp Sci 2005;86:66–84.
[36] De Keulenaer GW, Brutsaert DL. Heart failure with preserved ejection fraction. Eur Cardiol Rev 2008;4(1):31–3.
[37] Frøisland DH, Årsand E, Skårderud F. Improving diabetes care for young people with type 1 diabetes through visual learning on mobile phones: mixed-methods study. J Med Internet Res 2012;14(4):e111.
[38] Shadbolt N, Hall W, Berners-Lee T. The semantic web revisited. IEEE Intell Syst 2006;21(3):96–101.
[39] Baader F, Calvanese D, McGuinness DL, Nardi D, Patel-Schneider PF. The description logic handbook: theory, implementation, applications. Cambridge, UK: Cambridge University Press; 2003 [ISBN 0-521-78176-0].
[40] Dau F, Eklund P. A diagrammatic reasoning system for the description logic. J Vis Lang Comput 2008;19:539–73.
[41] Chen MA. Heart failure with preserved ejection fraction in older adults. Am J Med 2009;122(8):713–23.
[42] Oghlakian GO, Sipahi I, Fang JC. Treatment of heart failure with preserved ejection fraction: have we been pursuing the wrong paradigm? Mayo Clin Proc 2011;86(6):531–9.
[43] Anderson M, McCartney R. Diagram processing: computing with dia-grams. Artif Intell 2003;145(1–2):181–226.
[44] Patel VL, Arocha JF, Diermeier M, How J, Mottur-Pilson C. Cognitive psy-chological studies of representation and use of clinical practice guidelines. Int J Med Inform 2001;63(3):147–67.
[45] Arocha JF, Wang D, Patel VL. Identifying reasoning strategies in medical decision making: a methodological guide. J Biomed Inform 2005;38(2):154–71.
[46] Ba M, Diallo G. Large-scale biomedical ontology matching with Ser-vOMap. IRBM 2013;34(1):56–9.
[47] Bricon-Souf N, Verdier C, Flory A, Jaulent MC. Theme C: medical information systems and databases – results and future work. IRBM 2013;34(1):1–90 [Digital Technologies for Healthcare].
[48] Kamsu-Foguem B, Diallo G, Foguem C. Conceptual graph-based knowl-edge representation for supporting reasoning in African traditional medicine. Eng Appl Artif Intell 2013;26(4):1348–65.
[49] Kamsu Foguem B, Tchuenté Foguem G, Foguem C. Verifying a medical protocol with temporal graphs: The case of a nosocomial disease. J Crit Care 2014,http://dx.doi.org/10.1016/j.jcrc.2014.02.006[Available online 14 February 2014].
Bernard Kamsu-Foguem: he has a PhD in Computer Science and Engineering
from the University of Montpellier 2 in 2004. He got the “accreditation to super-vise research”, abbreviated HDR from INPT in 2013. His current interests are in Knowledge Discovery and Data Mining, Knowledge Representation, Formal Visual Reasoning, Ontology-based Semantic Analysis, Knowledge Exploitation for Collaboration, Decision Support Systems and Intelligent Systems. Applica-tion domains include Continuous Improvement process and Health InformaApplica-tion Systems. He is a reviewer for a large number of international scientific journals such as Computers in Biology and Medicine, Knowledge Management Research & Practice, Interacting with Computers, Sensors, Engineering Applications of Artificial Intelligence and Knowledge-Based Systems. He is a member of the thematic group: e-Health of InterOP-VLab (International Virtual Laboratory for Enterprise Interoperability).
Germaine Tchuenté-Foguem: she has a Master of Advanced Studies from the
University of Yaoundé I (Cameroon) in 2007, in the domain of synchronization in dynamic distributed systems. She has a Research Master in automatic and decisional systems obtained in 2010 from ENIT-INPT of Tarbes (France) on Fuzzy logic in competence management. She is preparing a PhD thesis focused on a knowledge-based information system for visual support in critical decision-making. She currently takes an active interest in Computer information system(s) (e.g. algorithmic processes), information and communication technology, Data Warehouse, Data mining (Sequential rule mining, Sequential pattern mining or Association rule mining), Knowledge acquisition and Knowledge discovery.
Clovis Foguem (MD): he is grounded in medical research applications of ICT.
He is an Internal Medicine and Geriatric medical doctor and has undertaken a PhD on “Olfaction and Elderly: study of the olfactory (CN I) and trigeminal (CN V) sensitivities interactions in a geriatric population; constants and pathological specificities”. He is also particularly interested in neurodegenerative diseases (as Parkinson disease or Lewy Body dementia), elderly epilepsy and whether pathogenic inflammatory or autoimmune responses can contribute to these dis-orders in the elderly. Moreover he is also interested in medical knowledge representation and medical clinic design guidelines. For his work on “Olfaction and Elderly”, Dr C. Foguem was laureate of Health Research Award for emerging health researchers from the corporate foundation “Groupe Pasteur Mutualité” in 2011. Former Faculty of Medicine’s Clinical Instructor, he is now Hospital Practitioner in France. He is peer-reviewer of many scientist journals among which: Clinical Interventions in Aging; Degenerative Neurological and Neu-romuscular Disease; International Medical Case Reports Journal; Neuroscience and Neuroeconomics; Clinical Medicine Insights; Journal of the Pancreas; Inter-national Scholars Journals (ISJ); Cancer Therapy; Indian Journal of Critical Care Medicine and, African Journal of Environmental Science and Technology.