HAL Id: hal-02155532
https://hal-centralesupelec.archives-ouvertes.fr/hal-02155532
Submitted on 5 Jan 2021
HAL is a multi-disciplinary open access
archive for the deposit and dissemination of
sci-entific research documents, whether they are
pub-lished or not. The documents may come from
teaching and research institutions in France or
abroad, or from public or private research centers.
L’archive ouverte pluridisciplinaire HAL, est
destinée au dépôt et à la diffusion de documents
scientifiques de niveau recherche, publiés ou non,
émanant des établissements d’enseignement et de
recherche français ou étrangers, des laboratoires
publics ou privés.
Observation of metallurgical changes induced by an
electric arc to Ag-SnO2-CuO electrodes
Aurélien Fouque, Georges Cailletaud, Vladimir A. Esin, Romaric Landfried,
Philippe Testé, Frédéric Houzé, Alexandre Bonhomme, Jean-Luc Ponthenier,
François Chaudot, Marina Lisnyak
To cite this version:
Aurélien Fouque, Georges Cailletaud, Vladimir A. Esin, Romaric Landfried, Philippe Testé, et al..
Observation of metallurgical changes induced by an electric arc to Ag-SnO2-CuO electrodes. 65th
IEEE Holm Conference on Electrical Contacts, Sep 2019, Milwaukee, United States. pp.239-244,
�10.1109/HOLM.2019.8923681�. �hal-02155532�
Observation of metallurgical changes induced by an
electric arc on Ag-SnO
2
electrodes
Aurélien Fouque GeePs CNRS, CentraleSupelec Gif-sur-Yvette, France aurelien.fouque@centralesupelec.fr Romaric Landfried GeePs CNRS, CentraleSupelec Gif-sur-Yvette, France romaric.landfried@centralesupelec.fr Alexandre Bonhomme Schneider Electric Grenoble, France alexandre.bonhomme@se.com Georges Cailletaud
Centre des Matériaux MINES ParisTech Évry, France georges.cailletaud@mines-paristech.fr Philippe Testé GeePs CNRS, CentraleSupelec Gif-sur-Yvette, France philippe.teste@centralesupelec.fr Jean-Luc Ponthenier Schneider Electric Grenoble, France jean-luc.ponthenier@se.com Vladimir Esin
Centre des Matériaux MINES ParisTech Évry, France vladimir.esin@mines-paristech.fr Frédéric Houzé GeePs CNRS, CentraleSupelec Gif-sur-Yvette, France frederic.houze@centralesupelec.fr François Chaudot Schneider Electric Grenoble, France francois.chaudot@se.com
Abstract — Understanding the erosion of contact materials caused by electric arcs is a major challenge to improve the lifetime of switching devices. The main purpose of this study is to determine how the silver-tin oxide material (Ag-SnO2
12%w.) evolves under the action of a unique arc and multiple arcs (up to 50,000). Pairs of electrodes were submitted to an opening arc at room atmosphere for current intensity of 150, 300 and 600 A rms and typical duration of 4 ms. Different means of characterization were used: optical microscopy, optical profilometry, energy dispersive spectroscopy (EDS) of the electrode surface, electron backscatter diffraction (EBSD). For a unique arc, it was possible to observe a resolidified molten zone and estimate its dimensions. The influence of the number of arcs has been studied and a gradual evolution of the damage nature has been demonstrated as a function of the arc numbers.
Keywords — Ag-SnO2 electrical contact, electric arc, optical
profilometry, SEM, EDS, EBSD analysis.
I. INTRODUCTION
Contactors are devices whose sizing requires an understanding of electrical and electromagnetic, metallurgical, thermal, fluidic, and mechanical phenomena. The contact electrodes are submitted to repeated arcing, which gradually damages them and can lead to ruin. During the life of a contactor, all these operations can lead to the failure of the component for various reasons: welding of the contact, unacceptable increase in contact resistance, partial or total destruction of the contact electrodes. There is then a competition between several degradation mechanisms such as surface erosion, development of a network of cracks, spatial change in the composition of the material. Indeed, as the oxide particles of the silver-based composite are likely to disappear near the surface, that may cause a risk of welding.
Numerous experimental studies [1-7] have been carried out on the degradation of contact electrodes of Ag-SnO2. They concern the phenomena of electrode erosion (either by
weighing the contacts at the end of a large number of arcs, or by observing the different craters and the evolution of the surface during the tests with an optical profilometer, for example), welding the contact electrodes, etc. Some modelling work has also been proposed [8].
The long-term objective of the work presented here is to propose a model of the damage of a contactor over its lifetime (after several thousand opening and closing arcs). To achieve such an objective requires knowledge in many fields concerning both the thermodynamic properties of the contact material, the characteristics of the power flux brought by the arc to the electrodes, the structure and behaviour of the arc root during the opening and closing phases, the metallurgical evolution of the contact material, the thermo-mechanical effects experienced by the material. This also requires a detailed phenomenological study based on precise observations not only of the topographical evolution of the contact surface but also of the metallurgical and structural evolution of the contact material in its mass. Different works have already addressed different phenomena mentioned above [9-10]. These works made it possible to measure the thermodynamic properties of the Ag-SnO2 material and to estimate the power flux supplied to the electrodes. Therefore, the aim of the present paper is to show the different damages occurring on the electrical contact made of Ag-SnO2 impacted by electric arcs as a function of their numbers and their current intensity values.
In section II, the experimental device is described and a typical example of electrical signals is given. In section III, we focus on the damages resulting from a single arc as a reference. Then, in section IV the damages created by many arcs will be compared to the ones obtained for one arc.
II. EXPERIMENTAL DEVICE PRESENTATION
A schematic description of the electrical circuit considered in this work is shown in Fig. 1. The power supply is an alternative voltage source (230 V rms at 50 Hz) which can deliver a current up to 600 A rms. The current value is fixed by the choice of the resistor value. In this work, we focus on three current intensity values: 150, 300 and 600 A rms. The current in the circuit and the voltage measured between electrodes are recorded. The mobile part of the device is constituted of an electrode, a spring and a mobile electrode carrier. The spring ensures a contact force of 10 N. A laser measures the displacement of the mobile electrode carrier. As soon as the contact is open (contact force equals 0), this displacement corresponds to the electrode gap and it opens at a constant speed of around 0.4 m/s. This device has been used to generate a controlled number of opening arcs: from 1 to 50,000 arcs. Each making-breaking cycle lasts 1 second.
Fig. 1. Electrical circuit diagram; three values of resistances are used to get three current values 150, 300 and 600 A rms; the inductance value is set to get cos(φ)=0.35; this machine enables to generate one or several arcs.
A program based on LabView collects all the data. An example of current, voltage and displacement recorded is shown in Fig. 2. The calculator takes into account the spring characteristics so that the displacement of the mobile electrode carrier causes an opening leading to a 4 ms arc duration. It starts opening around 6 ms. At 14 ms, the contact is effectively opening and an arc is generated. The arc extends until it is extinguished when the current reaches zero at around 18 ms.
Fig. 2. Typical oscillogram of a/ current intensity, b/ contact voltage and c/ displacement of the mobile electrode carrier with a 150 A rms current; (1) mobile electrode carrier displacement begins, (2) contact opening and arc appearance, (3) arc disappearance.
Fig. 3. Schematic representation of the different layers constituting the electrodes (static and mobile).
In fig. 3 is presented a schematic representation of the electrodes (static and mobile) with the different layers and their respective thickness.
In the next part of this paper, the effect of a single arc on a cathode is presented.
III. DAMAGES OF THE CONTACT MATERIAL FOR A SINGLE ARC
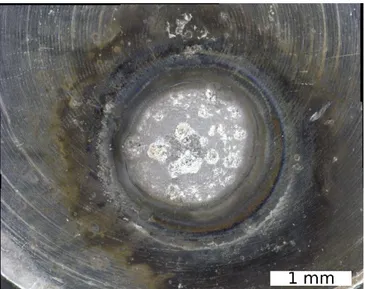
The observation of a cathode surface has been made by optical microscopy (Fig.4). A crater on an initial flat cathode surface was formed after a single arc of 300 A rms. The inner part of the crater, of 1.6 mm in diameter, appears very bright. The surrounding area has clearly been affected by the arc.
Fig. 4. A crater formed on an initially flat cathode surface after a single arc of 300 A rms.
Beyond this qualitative approach, an analysis by optical profilometry allows a more quantitative estimation of the surface damages. An example of such measurement is given in Fig. 5 which is a topography map. The zero altitude in white corresponds to the surface reference before the arc. After a single arc, two zones are visible. In the center of the crater, the height is negative and appears in blue. Around the crater, a red ring is visible (positive heights) which corresponds to displaced material within which there might be a presence of some gas bubbles. An estimation of the displaced volume (negative altitudes) gives a value of about 10-2 mm3. This volume corresponds to a minimum of fused Ag-SnO2 material. The fusion of such a volume requires an energy of 40 mJ, which is very few part of the total energy dissipated by the arc.
Fig. 5. Topography map of the initial flat cathode surface after a single electric arc (300 A rms) obtained with an optical profilometer.
The Fig. 5 allows to obtain a local altitude profile (Fig. 6), corresponding to the black line in Fig. 5. We observe that the bottom of the crater is quite irregular with hollows of 38 µm maximum depth and the minimum diameter of molten material under the reference surface (in dashed line in Fig. 6) is around 1.1 mm.
Fig. 6. Altitude surface profile obtained along the black line crossing the crater in Fig. 5.
A change in the topography can be possibly accompanied with a change in the concentration of the main elements. To get the chemical composition of the cathode surface (percentage of Ag, Sn and O elements) after a single arc, an energy dispersive spectroscopy (EDS) in scanning electron microscope (SEM) was used. The analysis was carried out along one of the crater diameters with a step of 2.5 µm (Fig. 7). The dashed lines give the reference concentrations for each element measured before the arc. One can see that inside the crater, the concentrations are very variable. On the crater periphery, an Ag depletion and an increase in concentration of Sn and O are noticed. For the ease of reading, a SEM micrograph obtained using backscatter electrons is superimposed with the EDS profiles. Thus, we can conclude that the regions of bright contrast (and bright regions in Fig. 4) correspond to areas of quasi-pure Ag due to demixing after the arc action. Moreover, increased O content on the surface in comparison with that obtained using the reference sample suggests an intensive surface oxidation during the arc.
Fig. 7. Atomic concentration of Ag (purple), Sn (red) and O (green) measured by EDS along one of the crater diameters after a single arc (300 A rms – case of a flat cathode); the dashed lines are the mean values for each element measured using initial material.
To get insight into different phenomena occurring during a single arc, the bulk of the samples close to the surface was observed using an optical microscope. The samples were cut along a diameter of the crater and further prepared by standard techniques. After polishing, a chemical etching (mix of ammoniac and hydrogen peroxide) was applied to reveal the cathode microstructure features (Fig. 8). A change
in the appearance of the material was observed on a lenticular sub surface volume whose dimensions are 1.9 mm in diameter and 200 µm in depth.
Fig. 8. Cathode microstructure in the cross section along a crater diameter after a single arc (300 A current – case of a flat cathode), observed with an optical microscope.
To understand the origin of the contrast change in the subsurface area in Fig. 8, an analysis by electron backscatter diffraction (EBSD) was carried out (Fig. 9). One can observe that the initial microstructure (not affected by the arc) consists of relatively small grains not well resolved in Fig. 9. However, the sub surface area under the crater center reveals large Ag grains of different morphology with the largest grains of hundred microns in diameter. Such a grain structure is typical for solidification of the metals [11]. It suggests that the area containing large grains revealed by EBSD was melted by the arc. It is worth noting, however, that due to a very short arc action, we do not expect any significant Ag grain growth and all microstructure changes are attributed thus to melting with subsequent resolidification. The dimensions of the melted area thus observed are 1.85 mm for the diameter and 220 µm for the depth. They are relatively similar to those obtained by optical microscopy (Fig. 8).
It is interesting to note that such observations make it possible to obtain the volume of molten material under the arc action. Thus we found a molten volume of around 0.3 mm3. The fusion of such a volume requires an energy of 1.2 J. It should also be noted that this volume is 30 times larger than the volume calculated from optical profilometer measurement. This shows that only a small amount of the molten liquid was set in motion by the action of the various arc-related forces (Laplace and Marangoni), probably due to the high viscosity of Ag-SnO2.
Fig. 9. Inverse pole figure for Ag in the direction normal to the sample surface obtained by EBSD analysis for the zone presented in figure 7. The colors indicate the orientation of the Ag grains.
The same experimental protocol was applied for the characterization of the corresponding anode (results not reported in detail here). Several differences were observed: the size (diameter and depth) of the crater obtained by optical profilometry was smaller for the anode with surface topography less rugged. Concerning the EDS observations, there are no significant variations in element concentrations at the periphery of the crater. Observations of the sections
(optical and EBSD) confirm smaller dimensions for the melted volume: 1.53 mm and 1.42 mm for the diameters, respectively and 180 µm for the depth.
IV. DAMAGES OF THE CONTACT MATERIAL FOR MULTIPLE ARCS
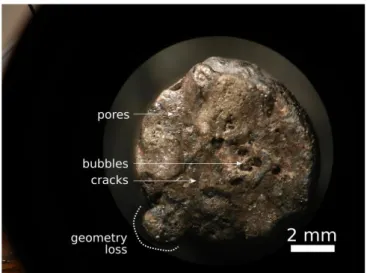
In this section, the influence of the number of arcs on the degradation of the contact material is assessed. In these endurance tests the polarity changes with each arc. We will therefore no longer make a distinction between anode and cathode. Fig. 10 gives an observation by optical microscope of an electrode surface after 50,000 arcs (300 A rms). Numerous bubbles, pores, cracks as well as geometry loss (circular shape) may be observed.
Fig. 10. Observation of an electrode surface impacted by 50,000 arcs at 300 A rms (optical microscopy).
Since the entire surface has been modified, an optical profilometry analysis is of no interest. To evaluate how the element concentration has been affected, an EDS analysis was performed. The atomic concentration of the Ag, Sn and O elements as a function of the position along the red line is shown in Fig. 11. Areas of demixing can be observed: darker areas richer in tin and oxygen and poorer in silver and white areas particularly rich in silver.
Fig. 11. Atomic concentration of Ag, Sn and O measured by EDS as a function of the position along the red line for an electrode was submitted to 50,000 arcs (300 A rms).
In Fig. 12, an optical view of the cross section of the electrode is given. This makes it possible to see more clearly what appeared in Fig. 10, namely multiple bubbles, cracks, pores. In addition, demixing and melting zones are clearly distinguished.
Fig. 12. Electrode microstructure in the cross section after 50,000 arcs (300 A rms) observed with an optical microscope.
The Fig. 13 shows on a summary diagram the depth of the deepest damage as a function of the energy dissipated in the arc cumulated on the successive arcs, named cumulative energy. It was obtained for different intensities of the arc current and also different numbers of successive arcs. Thus for the arc current intensities of 150, 300 and 600 A rms the average energy dissipated in the arc is respectively 10 J, 20 J and 40 J apart from a row. Two domains can be observed. From 10 to 3.103 J, the damage mainly observed is related to the existence of a molten volume that does not necessarily present demixing zones. The depth of this volume is almost constant and does not exceed 400 µm deep. Beyond 2.104 J damages are mainly related to vertical cracks formations. Cracks are growing quickly with the cumulative energy.
Fig. 13. Summary diagramm of the depth of the deepest damage observed in relation to the surface as a function of the cumulative energy dissipated in the arcs.
The following subsections present the damages appearing and propagating as the cumulative energy is increased.
A. Deepest damage type encountered at “lower” cumulative energies (domain 1)
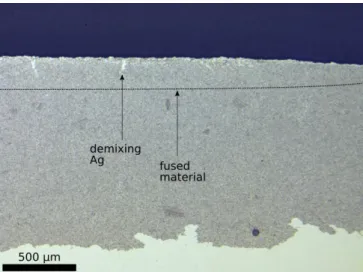
An electrode submitted to 10 arcs at 600 A rms is chosen to illustrate this case (Fig.14). The estimated cumulative energy is about 400 J. The cross section shows a little demixing. A fused zone is visible deeper than the demixing. The depth of the fused material is around 250 µm.
Fig. 14. Photography of an electrode cross-section submitted to 10 arcs at 600 A rms.
B. Damages types in the transition zone
Fig. 15 shows the cross section of an electrode submitted to 1,000 arcs at 150 A rms. The estimated cumulative energy is about 10 kJ. We can notice a clearer fusion front than in Fig. 14. The demixing is as deep as the fused material. Two vertical cracks can be observed in this figure from the surface towards the underlayer. The end of the deepest crack is 800 µm deep.
Fig. 15. Photography of an electrode cross-section submitted to 1,000 arcs at 150 A rms.
C. Deepest damage type at “higher” cumulative energies (domain 2)
Fig. 16 shows the cross section of an electrode submitted to 10,000 arcs at 300 A rms. The estimated cumulative energy is about 200 kJ. The deepest damages observed are cracks which can almost extend to the braze. Surface damages are particularly severe. In addition to vertical cracks, horizontal ones appear and huge cavities are formed. Solid blocks of demixed material also appear and a lot of bubbles and pores are visible. What remains of the surface appears to be mechanically fragile.
Fig. 16. Photography of an electrode cross-section submitted to 10,000 arcs at 300 A rms.
V. CONCLUSION
The objective of the paper presented here was to study the evolution of the damage suffered by a contact electrode as a function of the number of arcs (up to 50,000 arcs), for current intensities between 150 and 600 A rms and arc durations of about 4 ms.
The first step was to carefully explore the effect of a single arc on the electrode. Observations of the electrode surface have made it possible to identify and quantify the area of material displaced by an arc and the changes in chemical species concentration in the material. With the help of observations within the material (EBSD) the molten zone could be observed for one arc and the volume of this molten zone has been estimated. The molten volume is several tens of times larger than the crater volume observed in optical profilometry. Such observations constitute
first-rate information for determining the characteristics of the electrode power balance, an essential parameter for accurate and future modeling of contact material ageing.
The second phase of the process consisted in monitoring the evolution of the type of damage and its extent over time. The same means of observation were used. Two phases in the ageing of the electrode material were thus observed. A first phase dominated by material melting phenomena during which demixing begins to take place and a second phase during which the main damage observed is cracks, cavities and significant demixing areas.
REFERENCES
[1] M. Zhang, X. Wang, X. Yang, J. Zou and S. Liang, “Arc erosion behaviour of AgSnO2 contact materials prepared with different SnO2
particle sizes”, Trans. Nonferrous Met. Soc. China, vol. 26, no. 3, 2016, pp. 783−790.
[2] J. Swingler and J. McBride, “Modelling of energy transport in arcing electrical contacts to determine mass transfert”, IEEE Trans. on CPMT-Part A, 19 (3) , 1996, pp. 404-415.
[3] M. Hasegawa, K. Takahashi, D. Kawamura and Y. Hirano, “Comparison of transfert and erosion shapes on Ag and AgSnO2
contacts caused by break arc discharges in a DC inductive load circuit”, Proc. of the 59th IEEE Holm Conf., 2013, pp. 288-294. [4] C. Leung, E. Streicher and D. Fitzgerald, “Welding behaviour of
AgSnO2 contact material with microstructure and additive
modifications”, Proc. of the 50th IEEE Holm Conf., 2004, pp. 64-69. [5] H. Jiang and L. Zhenbiao, “A review on welding in make and break
operation of electrical contacts”, 3rd Int. Conf. on Electric Power
Equipment - Switching Technology (ICEPE-ST), 2015.
[6] J. Swingler and J. McBride, “Modeling of energy transport in arcing electrical contacts to determine mass loss”, IEEE Trans. on CPMT-Part A, vol. 21, no. 1, 1998, pp. 54-60.
[7] A.M. Gouega, Ph. Testé, R. Andlauer, T. Leblanc and J.-P. Chabrerie, “Study of the electrode gap influence on electrode erosion under the action of an electric arc”, Eur. Phys. J. AP 11, 2000, pp. 111-122. [8] M. Sun, Q. Wang and M. Lindmayer, “The model of interaction arc
and AgMeO contact materials”, IEEE Trans. on CPMT-Part A, vol. 17 no. 3, 1994, pp. 490-494.
[9] M. Hasegawa and K. Takahashi, “Observation of changes of contact surface profiles of Ag and AgSnO2 contacts during switching
operations with an optical cross-section method”, Proc. of IEEE Hom Conference, 2012, pp. 280-286.
[10] S. Kang and C. Brecher, “Cracking mechanisms in Ag-SnO2 contact
materials and their role in the erosion process”, IEEE on Electrical Contacts, 1988, pp. 37-46.
[11] D. A. Porter and K.E. Easterling, “Phase transformation in metals and alloys”, 6th ed., 2006.