HAL Id: hal-01259194
https://hal-mines-paristech.archives-ouvertes.fr/hal-01259194
Submitted on 28 Jan 2016
HAL is a multi-disciplinary open access
archive for the deposit and dissemination of sci-entific research documents, whether they are pub-lished or not. The documents may come from teaching and research institutions in France or abroad, or from public or private research centers.
L’archive ouverte pluridisciplinaire HAL, est destinée au dépôt et à la diffusion de documents scientifiques de niveau recherche, publiés ou non, émanant des établissements d’enseignement et de recherche français ou étrangers, des laboratoires publics ou privés.
A Simplified Approach to Risk Assessment Based on
System Dynamics: An Industrial Case Study
Emmanuel Garbolino, Jean-Pierre Chery, Franck Guarnieri
To cite this version:
Emmanuel Garbolino, Jean-Pierre Chery, Franck Guarnieri. A Simplified Approach to Risk Assess-ment Based on System Dynamics: An Industrial Case Study. Risk Analysis, Wiley, 2016, 36 (1), pp.16-29. �10.1111/risa.12534�. �hal-01259194�
1
A Simplified Approach to Risk Assessment Based on System
Dynamics: An Industrial Case Study
Emmanuel Garbolino
1,*, Jean-Pierre Chery
2, Franck Guarnieri
11MINES ParisTech, Crisis and Risk research Centre (CRC), 1 rue C. Daunesse, CS10207, 06904 Sophia Antipolis Cedex, France
2ENGREF/AgroParisTech, Maison de la Télédétection en Languedoc-Roussillon, 500 rue Jean-François Breton, 34093 Montpellier Cedex 5, France
ABSTRACT
SEVESO plants are installations with a risk of major accidents. They must provide safety reports to public authorities and inspection services in order to demonstrate their capability to manage risk and, in such reports, risk assessment is at the heart of these documents. The complexity of these sociotechnical systems makes it appropriate to support the formulation of this risk assessment with a model of the system. However, more often than not, this step is partially treated, simplified or avoided. At the same time, investigations have shown that the complexity of industrial systems is frequently a factor in accidents.
In order to handle both this complexity and changes in the system over time, this paper proposes an orginal risk analysis method based on the system dynamics theory developed by Forrester in the early 1960s. The methodology supports the development of a Dynamic Risk Assessment Framework dedicated to industrial activities. It consists of ten complementary steps grouped into two main activities: System Dynamics Modelling of the sociotechnical system and Risk Analysis. This System Dynamics Risk Analysis is applied to a case study on a chemical plant and provides a mean to assess the technological and organizational components of safety.
Keywords: system dynamics; risk assessment; sociotechnical system 1. INTRODUCTION
In Europe, management of industrial risk is based on the identification and prioritization of hazards. The aim is prevention, protection and safety; through organizational, technical and human means. Companies where there is risk of a major accident have an administrative duty to carry out a risk assessment of their activities and any hazardous materials used, produced or stored. Particularly complex industrial facilities should be frequently assessed using methods such as the Preliminary Risk Analysis (PRA) or the Fault Tree Method of Cause and Consequences, also known as the 'bowtie' method [1]. These modelling methods use diagrams to represent functions and relations between elements of an industrial system. However, they do not allow any kind of dynamic simulation; in most cases they do no more than represent workflow in a linear fashion. The results of the assessment are then applied to the formalization of accident scenarios that decision makers use as input to the formulation of the company’s safety measures.
The aim of this paper is to propose an original approach to risk analysis in industry. It uses dynamic modelling to simulate activity, both in normal and degraded mode. It does not aim to conduct a detailed analysis of the prevention and protection means in an industrial system, but rather presents a framework for industrial safety reasoning. This modelling approach is based on system concepts,
2 particularly those of ‘system dynamics’ identified by Forrester in the early 1960s [2]. Its application, using prevention and risk management reasoning, leads to the definition of a ‘dynamic risk analysis’ approach.
This article discusses the contribution of system concepts, in particular system dynamics, to industrial safety using a concrete example. It identifies the various steps involved in building a dynamic model of an industrial unit, and presents the results of behaviour simulations in normal mode and at the onset of failure. In conclusion it addresses the limitations and benefits of the approach and discusses potential improvements.
2. SYSTEM CONCEPTS RELATED TO SAFETY IN THE PROCESS INDUSTRIES This section discusses the contribution of system concepts and modelling processes of human activities as inputs for risk analysis. It also describes the proposed implementation of the dynamic risk analysis method.
2.1. Systems, models and systems’ models
Of all the keywords used for human activities and more precisely, industrial activities, the term ‘system’ holds pride of place. According to [3] a system is at the same time:
a set in relation to its environment, and the interactions that make it autonomous;
a set composed of interacting subsystems, and the interdependence that makes it coherent;
a set submitted to more or less significant alterations over time, while keeping the same
permanence.
The concept of the system is inseparable from the concept of the model, which is itself a representation of a concrete system. Any real system will only be known through its model. Conversely, a model may be considered as a specific system i.e. a system model.
Industrial processes are complex and comprise various components that interact at different levels and can provoke unexpected phenomena. Complex system is a “system composed of many parts that interact with and adapt each other. In most cases, the behavior of such systems cannot be adequately understood by only studying their component parts. This is because the behavior of such systems arises through the interactions among those parts”[4]. They generate hazardous situations due to technical, human or organisational failure or deviation like the investigation of famous accidents in the industries shown [5,6].
These phenomena occur in multiple space scales, as well as time scales. In order to understand risks due to these industrial activities, various phenomena must be simultaneously taken into account [7]. Some phenomena can be simulated with the help of classical modelling forms (mathematical, statistical, probabilities, system dynamics etc.). Others require specialist knowledge, (to identify human or organisational deviations etc.). In both cases, knowledge of the concerned phenomena must be taken into account. Consequently, the system can be modelled in many ways, which are more or less comprehensive, and emphasise all or part of the facts. These models differ in:
which property of the system they highlight;
which areas they identify as important;
the extent to which they use formalised languages.
This observation makes the concept of systems’ models a useful tool in understanding the complexity of industrial activities. On the one hand they provide a way to organise the data and on the other hand they provide a way to use it according to a pre-defined objective.
3 Given this context, this paper aims to use the concept of systems’ models to structure a dynamic risk assessment framework related to industrial activities.
2.2. Basic principles of system dynamics
Complex industrial systems must first be modelled before risk assessment methods, such as the Preliminary Risk Analysis (PRA) or the bow-tie analysis [1] can be applied. These methods usually show the functions and the relations between the components of an industrial system through appropriate diagrams [8]. However, they do not simulate its behaviour in a dynamic way.
This paper discusses the contribution of a dynamic modelling methodology applied to a chlorine (Cl2) transfer unit for plastics synthesis. The aim is to assess the efficiency of prevention and
protection means implemented at the site. The approach uses the system dynamics concept to model and simulate the processes that change or maintain the status, information, matter or energy of the system.
[2] defines ‘system dynamics’ as “a way of studying the behaviour of industrial systems to show how policies, decisions, structure, and delays are interrelated to influence growth and stability”. He describes in detail the procedure that should be followed in order to build a system dynamics model, which is based on the following five main steps:
Identify variables that continuously describe the state of interacting system elements.
Define the assumptions that underlie interactions with a view to formalizing the proposed system. This enables it to be distinguished from its environment.
Develop a model of causal relationships between variables using knowledge and assumptions. Identify feedback loops.
Using a top-down approach, identify the causative factors. This is to capture an appropriate level of complexity which enables consideration of the possible consequences of these factors on the dynamic evolution of the system.
Describe the relations established in the form of differential equations using simulation software.
System dynamics involves the study, modelling and simulation of phenomena that create a change in, or the maintenance of the state of a system (natural or artificial) over time. This change, or maintenance of the state of the system can be seen when it is possible to model it using ordinal or numerical values as indicators. The purpose of applying system dynamics to industrial safety is to provide a formal framework for decision support. This support benefits companies dedicated to the implementation of prevention and protection measures for workers, facilities, local populations and the environment.
At this stage it is appropriate to mention the work done by Nancy Leveson and her team in the Department of Aeronautics and Astronautics at MIT (the Massachusetts Institute of Technology). Leveson developed an accident model based both on systems and control theory: the STAMP model (Systems-Theoretic Accident Model and Process). Unlike traditional accident models that consider accidents as the result of a faulty chain of events, the STAMP model adopts a systems-based approach [9-15]. Industrial systems that embrace the STAMP method adopt a dynamic process in which they continuously adapt to internal and external changes to achieve their goals. Safety, an emergent property of the system, is seen as a control problem, and the goal is to strengthen safety constraints.
Other studies have used system dynamics principles to analyse the dynamics behind industrial accidents. [16] examines the causal structure of the Westray mining system by integrating the conditions that caused the explosion at the mine in 1992. [6] presents a model of the relationships
4 between managerial, organizational and functional factors of a system, using a causal diagram which is applied to the analysis of the Piper Alpha accident in 1988. [17] present a dynamic model to evaluate human and organizational factors that contribute to safety in a nuclear power plant. [18, 19] propose a system dynamics model, which focuses on technical dimensions, to improve risk analysis in the context of Seveso industries. Other studies that have focused on analysing the reliability of technical systems using system dynamics include the work of [20], which uses system dynamics to analyse the dynamic reliability of a nuclear power plant and to assess the limitations of its operation.
2.3. System Dynamics Risk Analysis: the proposed framework
The proposed approach, defined as a System Dynamics Risk Analysis [18, 19] is based on the following ten steps (see figure 1), which are grouped into two main activities (Risk Analysis and System Dynamics Modelling). The aim is to ensure continuous improvement in risk management at an industrial site.
Figure 1: Architecture and components of the Dynamic Risk Analysis Framework
Step 1: Sociotechnical system modelling. This step is based on the four tasks defined by Forrester for the study of system dynamics:
Identification of variables to represent the state of system components in interaction using data that describes the sociotechnical system (safety reports, piping & instrumentation diagrams, procedures etc.).
Definition of the assumptions that underlie the interactions in order to formalize the proposed system.
Development of a causal model of relations between the variables.
Description of the relations using differential equations, and their implementation in software (the STELLA® modelling platform [21]).
Step 2: Simulation of the normal operation of the system. This step aims to simulate the behaviour of the system assuming that no failure can occur. The aim is to create a reference model which reflects the ideal functioning of the system. This provides a first decision support for experts.
Step 3: Identification of failures. This step involves the identification of possible failures in the system (technical, human or organisational). It is based on classical risk assessment methods such as HAZOP [1].
Step 4: Modelling of failures. This step involves implementing, in the reference model, the various failures identified, from the point of view of the general behaviour of the system and its components. It is based on the modelling methodology proposed by Forrester and uses the modelling platform to integrate failures
Step 5: Simulation of abnormal operation. Once the various types of failures have been implemented in the modelling platform, the behaviour of the system in degraded (in safety terms) mode can be studied. The results of these simulations of system behaviour enable understanding of the evolving consequences of failures, in the context of the general behaviour of the system and its components.
Step 6: Simulation of hazardous phenomena. The results of the simulation provide information on system behaviour, over time, during a failure. The consequences of these failures can be simulated with software. This estimates the impact of hazards (e.g. overpressure, heat flows, and the release of toxic pollutants) on plant personnel, the local population, buildings and the natural environment for example. Distances and dangers are estimated using biophysical vulnerability thresholds for each hazard identified.
Step 7: Definition of prevention, protection and intervention means. The information provided by the simulation of the system in degraded mode, and of the consequences provides
5 the material for the identification of human, technical and organizational means for prevention, protection and safeguarding. These means are identified using risk analysis reasoning (based on the HAZOP approach) applied to our case study.
Step 8: Modelling of prevention, protection and intervention means. The safety means identified by the risk analysis are implemented in the model using the dynamic modelling procedure.
Step 9: Simulation of prevention, protection and intervention means. The safety means implemented in the modelling platform are used in simulations of the behaviour of the system. This is to test their effectiveness in various failure scenarios.
Step 10: Performance assessment of safety means. Simulations of system behaviour enable the study of the behaviour of safety devices over time. This step helps to understand the role of safety means and assess their performance based on the failure scenarios previously identified and modelled. Depending on the simulation results, it may be necessary to return to Step 7 to redefine safety means that are not sufficiently efficient.
The interrelations between the described models and approaches made it relevant to implement them in a framework. The framework gives a more comprehensive and integrated oversight of the organization of risk assessment and management activities, and can be used as a decision support system for risk prevention in the process industries. It is composed of models, tools and procedures which will be described in the following sections. The ultimate goal of this framework is to provide decision-makers with a method to assess safety performance, in order to support their choices on the strategy used to implement safety means.
The next section introduces the case study and the steps and models used to assess the efficiency of safety means. The results are presented in Section 4 and discussed in Section 5.
3. CASE STUDY METHODOLOGY
This section describes the application of the framework’s methodology and tools to the case study; a chlorine transfer unit. It describes the industrial site, its environment, the unit itself, and the methodology for modelling the normal operation of this unit. Existing safety devices are described and their efficiency is tested through simulation of the functioning of the system as a whole.
3.1. The chlorine transfer unit
Chlorine gas is heavier than air (3.2 g/l at 0 ºC) and tends to form a cloud at ground level. Its odour is suffocating and pungent at a concentration of less than 1ppm [22]. The effects of chlorine on human health are linked to its irritant properties; at an atmospheric concentration less than 15ppm, it irritates the eyes, the skin and the respiratory system cells. Longer exposure at higher concentrations (around 1,000 ppm) can cause a pulmonary oedema after a few minutes and causes the death of the contaminated person.
The industrial site is surrounded by a relatively dense population (more than 6,000 residents in a 1 km radius), near a highway (150m), and a railway (20m). Various economic and leisure facilities (supermarkets, businesses and a cinema etc.) are located within a 2km radius.
One of the activities at the industrial site is a chlorine transfer unit. Hazardous activities centre on this unit which dispatches chlorine to a plastics production unit. The transfer unit is composed of three subunits (Figure 2):
- The tank unit which provides a continuous flow of chlorine to the chlorine line via two tanks transported by rail.
6 - The chlorine line which maintains the flow of chlorine according to the demands of the
plastics production unit.
- The heat production unit which controls the physical conditions of the system. This consists of two boilers that regulate temperature in order to maintain the chlorine in a gaseous state. The two boilers are connected at the level of the evaporator and the superheater. The heat production unit receives information about chlorine formation from sensors on the chlorine line.
Figure 2: The chlorine transfer unit (W=Wagon; SV=Security valve; RV=Regulation valve; PC=Pressure sensor; P=Pump)
When it arrives at the site, the wagon transporting the chlorine tank is directed into an airtight bunker, sufficiently ventilated to create a slight vacuum. Connection, disconnection and draining of the chlorine tank are carried out in this enclosed space and chlorine leakage detectors continuously analyse the quality of the air. If there is a release of chlorine gas at a concentration of more than 5ppm, it is sucked out and directed towards a neutralisation column containing soda ash (not shown in Figure 2).
The air temperature in the bunker is maintained at 35°C by the heat production unit. At this temperature the internal pressure of the tank can be increased to 8-9 bars. At this pressure, the chlorine becomes liquid and it can be piped. This method allows the chlorine to be tapped and does not introduce inert gasses. It takes approximately 3-4 days to empty a tank, depending on consumption. The tank is replaced when pressure in the line drops; this indicates that the tank is almost empty. The process of switching from an empty tank to a full one takes approximately an hour and a half.
When a new tank enters the bunker it is first stabilized, then connected to a 25mm pipe which pipes the liquid chlorine towards the evaporator. The evaporator turns the liquid chlorine into a gas. It is situated in a building adjacent to the bunker. This building also houses a superheater. A regulation valve at the evaporator inflow ensures a constant flow of liquid chlorine. The liquid chlorine arriving from the tank enters the evaporator at 35ºC and is turned into a gas. The superheater then increases its temperature to 40ºC to compensate for the loss of heat in the production unit supply pipe, which could cause condensation. Both the evaporator and the superheater use warm water which circulates through a closed circuit and which is heated by means of a vapour exchanger. The warm water circuit is controlled by the water steam output. The water temperature (normally 36ºC) on the outlet side of the evaporator is controlled by the steam valve.
An entry valve is set at the superheater. This guarantees a pressure of 2.5 bars when the chlorine arrives at the plastics production unit. Other safety valves (completely opened or closed, ‘all or nothing’ valves) are placed along the chlorine line and are activated in response to changes in pressure, alarms indicating leakage, or other safety sensors. In this way, control and safety functions of the system are separated.
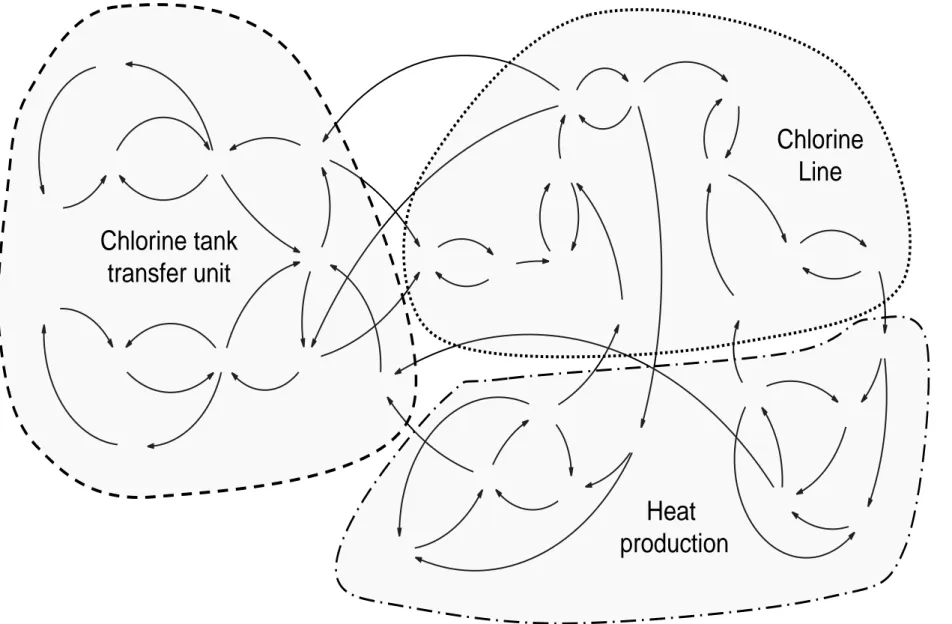
The causality relations between these three sub-systems and their components are shown in the following causal graphs (Figures 3 and 4).
3.2. Description of the causal graphs
The system dynamics modelling approach uses the three elements described above to form the basis for the model. The relationship between these three elements is evaluated using information about the organisation of the industrial site:
7 organisation (two tanks alternately filled and emptied, with safety precautions appropriate to this delicate operation).
- The chlorine line provides information to the tank unit about downstream production needs. This maintains a relatively constant flow of chlorine.
- The heat production unit regulates the physical conditions of this exchange. It consists of a heat exchanger which regulates the temperature in order to maintain the chlorine in a stable gaseous state. The exchange takes place at the level of the evaporator and the superheater. The heat production unit therefore, in turn, receives information about the state of the chlorine in the chlorine line.
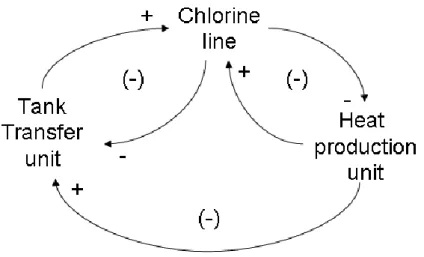
A high-level aggregated causal graph can therefore be established (Figure 3). Each arrow indicates the nature of the causal relationship. The tank unit supplies chlorine to the chlorine line. In this sense it tends to increase the presence of chlorine (+). However, supply is regulated because of the need for a steady flow of chlorine in the line. This creates the need to restrict supply to a defined level (-).
The chlorine line interacts with the heat production unit in the same way. The heat production unit tends to increase the flow of chlorine in the line (+). The line responds with data that regulates heat production to a level which creates a regular flow (-). A control station receives information about the chlorine line and the heat production unit and manages the safe emptying of the tanks and an appropriate chlorine flow rate. There is also a causal relationship between the heat production unit and the tank unit, which are linked by data (+). This link is not directly symmetrical: the heat production unit must only ensure that the chlorine remains in a gaseous state. It does not affect the flow of chlorine in the chlorine line. Therefore there is no causal arrow between the tank unit and the heat production unit.
Figure 3: High-level aggregate causal graph of the unloading and transfer of chlorine
Therefore, it can be seen that the system has at this very general level, three interacting control loops which ensure the overall safe delivery of chlorine to the plastics production unit. This simplified and aggregated description of the system forms the basis for the model, implemented using variables that can be quantified and correlated using the relations shown in these feedback loops.
Figure 4 (the detailed causal graph) shows all the variables used in the model and their causal relationships. This figure does not show other parameters, such as constants, which may appear in the stock-flow diagram. Constants are not involved in a feedback loop as causal elements; instead they are used in the simulation equations. The detailed causal graph enables a qualitative evaluation of the relations between elements of the system being modelled, and identification of those relations that can be expressed numerically.
Once the detailed causal graph has been established, the description of the elements and the rela-tions between them can then be translated into a stock-flow diagram. The symbols used by Forrester and the creation of mathematical formulae (such as differential equations, functions or parameters) enable the description and validation of the choice of variables. The following sections elaborate on the description of these variables for the three main areas: the tank unit, the chlorine line and the heat production unit.
8 3.3. Software implementation of the model
STELLA® software [21] was used to implement and simulate the model both in normal operation and in in the case of failure (e.g. a leak caused by the rupture of a pipeline). The user works in an environment consisting of three windows (interface, diagrams and equations) which enable the design of a model in various degrees of detail. The software is based on the principle of natural systems which seeks to describe systems in terms of their own structures (identification and linking of sub-systems) rather than from their initial state. Once the model is constructed, the software can provide graphical stock-flow diagram simulations (Figure 5) which identifies components according to their causal interactions.
Prevention (atmospheric chlorine sensors, alarms etc.) and protection (valves etc.) components are modelled using the same logic in order to check their relevance. Because of the complexity of the system, not all of the modelled components and variables are shown.
Figure 5: STELLA® modelling of stock, flow and converter variables.
Figure 6 models the chlorine discharge system starting from the tank unit. This figure shows the relations between the various stock, flow and control variables.
Figure 6: STELLA® modelling of the chlorine tank transfer unit
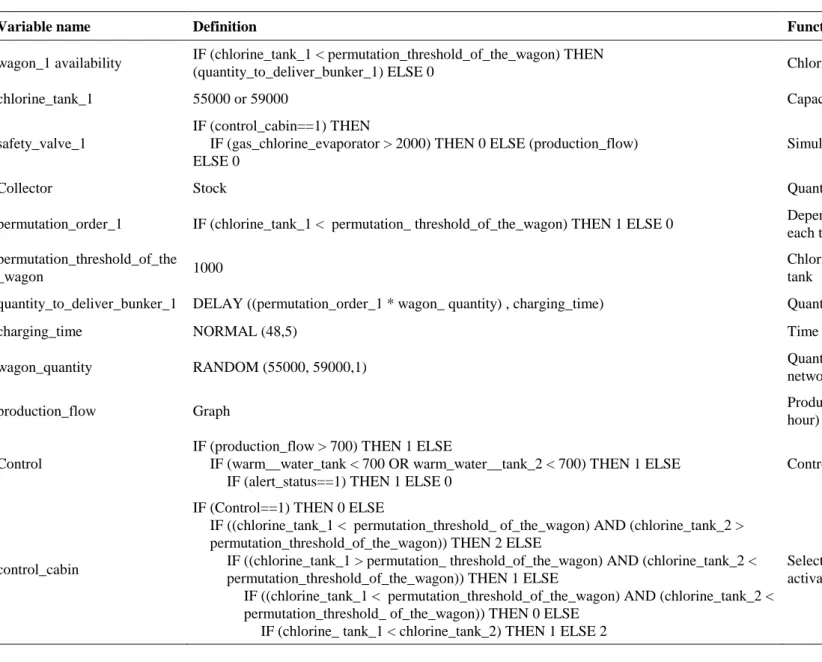
Table 1 describes a selection of the variables and their implementation used in the model. Table 1: Definition and role of a selection of variables used to model the tank transfer unit.
The next section highlights the results relating to the operations of the unit.
4. SIMULATION OF THE CHLORINE TRANSFER UNIT IN NORMAL AND ABNORMAL SITUATIONS
The STELLA® simulation of the operation of the unit is controlled by graphs representing the state of variables over time. This simulation is first run in normal mode, which provides a reference model describing the ideal operation of the unit. This is followed by a HAZOP (HAZard and OPerability) risk analysis of the entire industrial system. Any shortcomings identified are implemented in the software, along with the proposed prevention and protection means. The aim is to evaluate consistency and performance.
4.1. Simulation of the system in normal mode
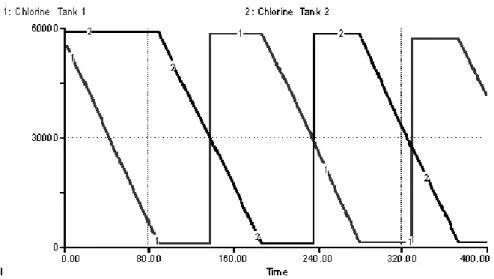
The time-frame for the case study is defined arbitrarily as 400 hours (just over 16 days). Figure 7 shows the variation in the quantity of chlorine in the tanks at the transfer units. Two types of variation are observed. The first relates to the quantity of chlorine discharged which is either 55 or 59 tonnes. This is accounted for by the difference in capacity between the two tanks. The second variation relates to the discharge time which varies according to the quantity of chlorine delivered and the requirements of the plastics production unit. The figure shows that chlorine tank 1 takes 90 hours to discharge, and tank 2 takes approximately 100 hours.
Figure 7: Simulation of chlorine tank discharge. 1=chlorine tank 1; 2=chlorine tank 2. The x-axis represents time in hours (0-400). The y-axis measures the quantity of chlorine in the tank (0-60,000kg)
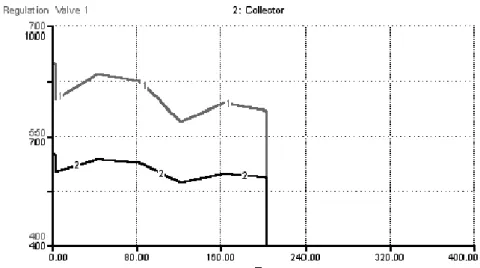
Figure 8 shows chlorine flow through regulation valve 1 (1) which is located at the point where chlorine is discharged from the tank in bunker 1. The flow varies according to the needs of the
9 plastics production unit. The chlorine flow through the collector (2) varies in the same proportions as it collects liquid chlorine leaving the bunker to send to the evaporator.
Figure 8: Simulation of liquid chlorine transfer from bunker 1 into the chlorine line for transformation into gas. The x=axis represents time in hours (0-400). 1=Regulation valve 1 where the liquid chlorine flow ranges from 400 to 700 kg/h. 2=Collector where liquid chlorine flow ranges from 400 to 1000 kg/h.
4.2. Risk assessment of the industrial system
The software model of the discharge and delivery of chlorine shown above represents the normal operation of the system. It forms a reference model from which it is possible to study failure modes. In our example, the identification of system failures is based on the HAZOP (HAZard and OPerability) method which is applied to the transfer unit.
The implementation of the HAZOP method [1] consists of the following phases:
1. Decompose the process or system according to nodes that correspond to a particular stage of the process. In the case in question, three nodes were identified: the tank unit, the chlorine line and heat production unit.
2. Identify the component involved (chlorine tank, safety valve, etc.).
3. Define the parameter of interest within the component (temperature, pressure, flow etc.) and identify its possible failures using a relevant keyword (flow too high or too low, pressure too high or low, early or late operation etc.).
4. Investigate the possible causes of failure (broken water mains, power-cut etc.).
5. Define possible preventive barriers to prevent or lessen the probability of the cause of failure (modify equipment or processes, establish preventive maintenance procedures etc.).
6. Investigate the effects and grade the severity of the event based upon its impact on health, the environment and operations.
7. Suggest protective barriers to prevent or limit the impact on vulnerable areas. Table 2 is a brief example of the analysis.
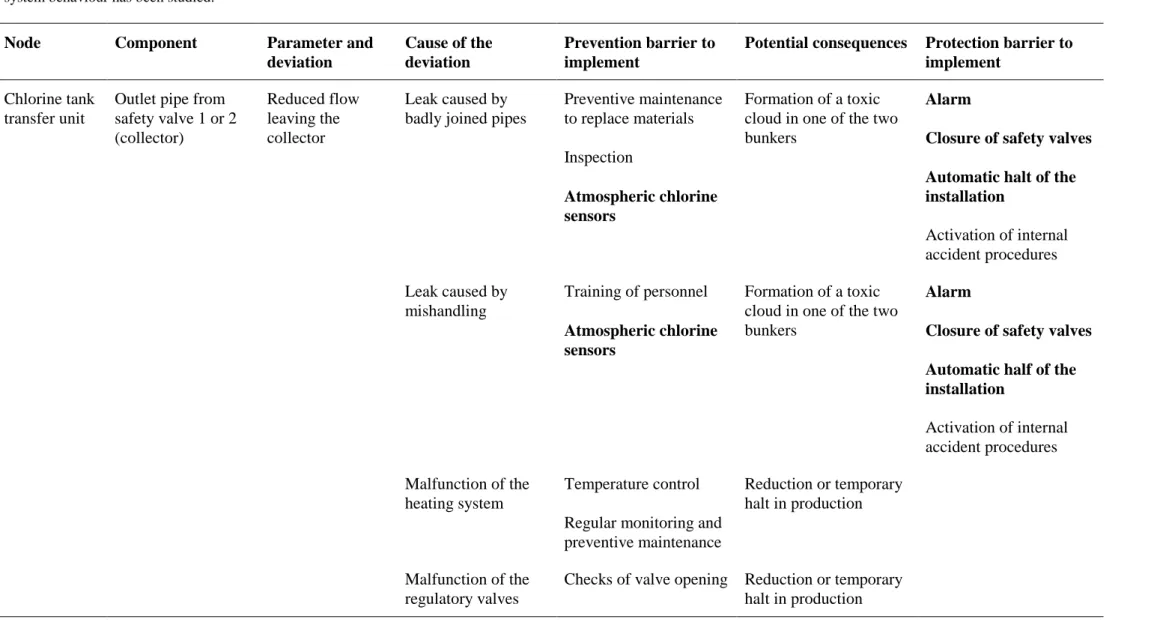
Table 2: An example of failure analysis in the event of a chlorine leak. Items in bold show the prevention and protection barriers that have been modelled and whose influence on the system behaviour has been studied.
The next section shows the results of a simulation which integrates the safety devices (prevention and protection barriers) activated by a failure. These results underline the efficiency of the accident prevention means that are implemented.
4.3. Implementation and simulation of safety devices in a failure scenario
The proposed failure scenario is a broken pipe at the end of the chlorine line as it enters the plastics production unit. As a first level of accident prevention and protection, the following safety devices were added into the model:
- An alert system which is activated when the chlorine flow into the plastics production unit is either 90% lower or 10% higher than the required flow. This alert system is connected to safety valves that are automatically closed when the alert system is triggered. This stops the flow of chlorine.
- Atmospheric sensors placed in the bunkers which detect chlorine gas emission in a confined environment. These sensors are connected to the alert system and their activation also triggers the valve system.
- An alarm which is activated by the alert system. The purpose of this alarm is to warn operators that there is an incident.
10 production unit at a rate of about 600 kg/h. Each tank holds around 55-59 tonnes of chlorine. It normally takes 72-96 hours to empty a tank depending on demand from the production unit.
In this scenario, the pipeline ruptures at t=200 hours. It causes an event that is detected by the system. A decrease in the flow of chlorine into the production unit activates the alert system. Activation of the alert system then triggers the immediate shut-down of safety valves 1 and 2 in the transfer unit.
Figure 9: Shutdown of the chlorine tanks following alert activation at t=200 hours.
The interruption continues throughout the remainder of the simulation as it requires major repairs taking more than 200 hours. The consequence of this decision is no more chlorine flowing to the collector and regulation valve 1 (Figure 10).
Figure 10: Chlorine flow in the collector (2) and regulation valve 1 (1) in normal mode, and after shutdown at t=200 hours.
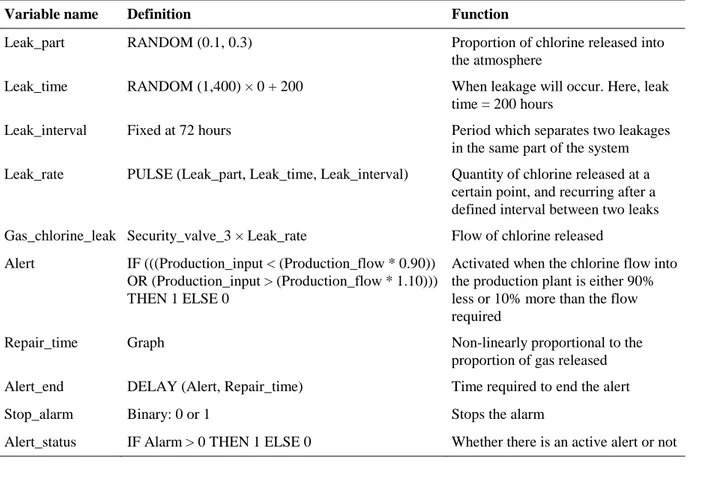
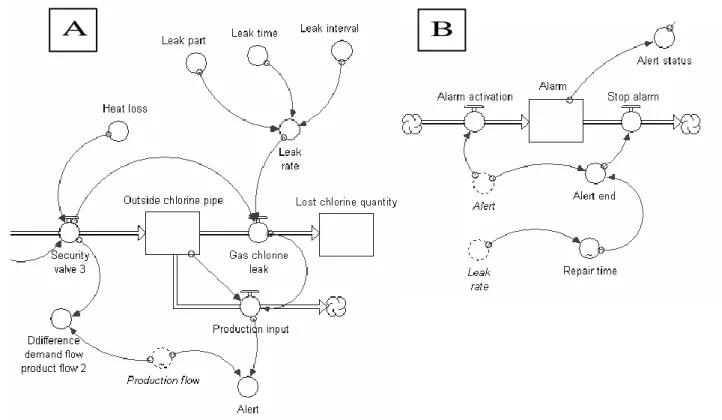
Figure 11 shows the software representation of the safety means and the failure. Figure 11: Software modelling of chlorine leakage (A) and safety measures (B) Table 3 defines the variables used to model the chlorine leakage and the alert methods. Table 3: Modelling prevention and protection barriers
This simulation of the behaviour of the system during a pipeline break highlights the role of prevention and protection barriers. Their activation allows the system to be quickly secured by closing the safety valves, which stops chlorine flowing into the atmosphere. In the simulation, it takes less than 1 minute to activate the safety valves. In this time, an ALOHA software simulation of atmospheric releases [23] estimates the formation of a toxic cloud which covers a 20m radius at a concentration of 910ppm (corresponding to a death rate of 1% for each minute of exposure).
5. CONCLUSION
The approach shown here brings together methods and tools to achieve a System Dynamics Risk Analysis of an industrial system, represented here by a chlorine transfer unit. The methodology used is based on dynamic modelling of the system. It uses software to simulate the behaviour of the sys-tem in normal operation and when failures occur.
The limitations of this approach are essentially linked to the desired degree of complexity, which affects the time needed to develop the model, define the variables, run the simulation and interpret the results.
The benefits of this approach are relevant both for industry and government departments responsible for monitoring high-risk installations. Its main contribution involves system simulation in various failure scenarios. This functionality enables the real-time evaluation of the consequences of failures for personnel, local populations or the environment. When coupled with a tool to estimate the impact of atmospheric toxic releases, dynamic modelling can demonstrate the physical consequences of events, e.g. the amount of hazardous materials released over a certain time, reaction times and measures for protecting operators. Further work on the representation of technical systems (the chlorine transfer network, alarms, sensors etc.) will make it possible to model
11 the human and organizational aspects related to activities, as well as prevention and protection efforts. These efforts include measures such as the implementation of maintenance and repair operations or the role of operators. It follows that the application of this systemic approach to modelling provides support for the definition of an integrated and dynamic risk management strategy.
Furthermore, the use of a software platform to model dynamic systems enables the behaviour of the system (and its sub-systems) to be both represented and simulated. It is also very easy to implement changes to the model and to test them to validate their relevance. Changes can be introduced either in the design or operation phase. For example when the hazard analysis is updated, when there is a technical or organisational change in system, or when safety plans are formalised. The system dynamics modelling approach therefore forms part of a continuous improvement strategy for the prevention and management of industrial risks.
System dynamics risk analysis identifies prevention and protection means that respond to accident scenarios. The implementation and simulation of these means within the model enables the study of their behaviour as the event unfolds. Dynamic modelling then provides a way for experts to evaluate the potential effectiveness of means to be integrated into the system. Specifically, it is a way of validating the effectiveness of barriers before their incorporation in situ.
Moreover, the effort that experts must make to create a model of the system requires them to deepen their knowledge of the industrial process. They must identify the elements to be modelled, define and set variables and run simulations to check consistency with the existing system (or, in the case of the development of a new system, expectations). All of these tasks provide a perspective on the system that complements a classical ‘process engineering’ vision. The approach demands that system functions and behaviour be considered from another angle, while still making use of process engineering expertise.
The approach also represents a formal support for communication and training. This is primarily due to the simple representation of the variables (stocks, flows, and auxiliary variables) and the graphical representation of results. It becomes relatively easy for the modeller to explain to company employees, consultants or government agencies the behaviour of the system and the role of safety barriers in the occurrence of failure, using scenarios defined in the risk assessment. This same material can also be used to create expert groups interested in the conduct or evaluation of hazard studies. Finally, it can be used to train company personnel by simulating the activities of each stakeholder.
REFERENCES
[1] Andrews J. D. and Moss T. R. Reliability and Risk Assessment. John Wiley and Sons Ltd, 2002. [2] Forrester J.W. Industrial dynamics. M.I.T. Press, 1961.
[3] Walliser, B. Systèmes et modèles. Introduction critique à l'analyse de systèmes. Seuil, 1977.
[4] International Risk Governance Council (2010), The Emergence of Risks: Contributing Factors, Report of International Risk Governance Council, Geneva, 2010.
[5] Jasanoff, S., 1994. Learning from Disaster: Risk Management after Bhopal. University of Pennsylvania Press, Philadelphia, 361.
[6] Paté-Cornell, M.E., 1999. A post mortem analysis of the piper alpha accident: technical and organizational factors. Risk Analysis 13 (2), 215–232.
[7] Bouloiz, H, Garbolino, E., Tkiouat, M. and Guarnieri, F. A system dynamics model for behavioral analysis of safety conditions in a chemical storage unit. Safety Science, 2013, 58, 32-40.
[8] Santos-Reyes, J. and Beard, A.N. A systemic approach to managing safety. Journal of Loss Prevention in the Process Industries, 2008; 21; 15-28.
[9] Leveson, N., Daouk, M., Dulac, N. and Marais, K. Applying STAMP in Accident Analysis. Workshop on Investigation and Reporting of Incidents and Accidents (IRIA), September 2003.
[10] Leveson, N. A New Accident Model for Engineering Safer Systems. Safety Science, 2004; 42, 4; 237-270.
[11] Leveson, N. and Dulac, N. Safety and Risk Driven Design in Complex Systems of Systems. 1st NASA/AIAA Space Exploration Conference, Orlando, February 2005.
[12] Stringfellow Herring, M., Owens, B.D., Leveson, N., Ingham, M. and Weiss, K.A.. A Safety-Driven, Model-Based System Engineering Methodology, Part I. MIT Technical Report, December 2007.
12 [14] Hardy K. et Guarnieri F. Modéliser les accidents et les catastrophes industrielles : la méthode STAMP. Edtions Tec 1 Doc, Lavoisier, 2012.
[15] Hardy H., Guarnieri F., 2011, Modelling and hazrd analysis for contaminated sediments using STAMP model. Chemical Engineering Transactions, 25, 737 – 742.
[16] Cooke, L.D. A System Dynamics Analysis of the Westray Mine Disaster. University of Calgary, Faculty of Management, 2002.
[17] Jaekook, Y., Namsung, A., and Moosung, J. A quantitative assessment of organizational factors affecting safety using System Dynamics Model. Journal of the Korean Nuclear Society, 2003; 36, 1; 64-72.
[18] Garbolino, E., Chery , J.P. and Guarnieri ,F. Dynamic systems modelling to improve risk analysis in the context of SEVESO industries. Chemical Engineering Transactions, 2009; 17; 373-378.
[19] Garbolino, E., Chery, J.P. and Guarnieri, F. Modélisation dynamique des systèmes industriels à risques. Collection « Sciences du Risque et du Danger », Notes de synthèse et de recherche, Lavoisier, 2010.
[20] Kyung, M.K, and Moosung, J. A quantitative assessment of LCOs for operations using system dynamics. Journal of Reliability Engineering and System Safety, 2004. 87, 2; 211-222.
[21] Richmond, B. An Introduction to Systems Thinking. ISEE Systems, 2005.
[22] CDC NIOSH. Center for Disease Control and Prevention. National Institute for Occupational Safety and Health, 2008, http://www.cdc.gov/niosh.
13
Tables and figures
Table 1: Definition and role of a selection of variables used to model the tank transfer unit.
Variable name Definition Function
wagon_1 availability IF (chlorine_tank_1 < permutation_threshold_of_the_wagon) THEN
(quantity_to_deliver_bunker_1) ELSE 0 Chlorine available in transfer tanks
chlorine_tank_1 55000 or 59000 Capacity of the transfer tank
safety_valve_1
IF (control_cabin==1) THEN
IF (gas_chlorine_evaporator > 2000) THEN 0 ELSE (production_flow) ELSE 0
Simulates the chlorine flow towards the collector
Collector Stock Quantity of chlorine leaving safety valves 1 and 2
permutation_order_1 IF (chlorine_tank_1 < permutation_ threshold_of_the_wagon) THEN 1 ELSE 0 Depends on the quantity of chlorine remaining in each tank
permutation_threshold_of_the
_wagon 1000
Chlorine threshold which activates the change of tank
quantity_to_deliver_bunker_1 DELAY ((permutation_order_1 * wagon_ quantity) , charging_time) Quantity of chlorine to be delivered to bunker 1
charging_time NORMAL (48,5) Time to change a tank (48 hours +/- 5 hours)
wagon_quantity RANDOM (55000, 59000,1) Quantity of liquid chlorine delivered by the rail
network (55 - 59 tonnes)
production_flow Graph Production plant chlorine needs (570 - 645 kg per
hour)
Control
IF (production_flow > 700) THEN 1 ELSE
IF (warm__water_tank < 700 OR warm_water__tank_2 < 700) THEN 1 ELSE IF (alert_status==1) THEN 1 ELSE 0
Controls chlorine flow rate
control_cabin
IF (Control==1) THEN 0 ELSE
IF ((chlorine_tank_1 < permutation_threshold_ of_the_wagon) AND (chlorine_tank_2 > permutation_threshold_of_the_wagon)) THEN 2 ELSE
IF ((chlorine_tank_1 > permutation_ threshold_of_the_wagon) AND (chlorine_tank_2 < permutation_threshold_of_the_wagon)) THEN 1 ELSE
IF ((chlorine_tank_1 < permutation_threshold_of_the_wagon) AND (chlorine_tank_2 < permutation_threshold_ of_the_wagon)) THEN 0 ELSE
IF (chlorine_ tank_1 < chlorine_tank_2) THEN 1 ELSE 2
Selects the tank to be emptied by the successive activation of the safety valves
14 Table 2: An example of failure analysis in the event of a chlorine leak. Items in bold show the prevention and protection barriers that have been modelled and whose influence on the system behaviour has been studied.
Node Component Parameter and
deviation
Cause of the deviation
Prevention barrier to implement
Potential consequences Protection barrier to implement
Chlorine tank transfer unit
Outlet pipe from safety valve 1 or 2 (collector) Reduced flow leaving the collector Leak caused by badly joined pipes
Preventive maintenance to replace materials Inspection Atmospheric chlorine sensors Formation of a toxic cloud in one of the two bunkers
Alarm
Closure of safety valves Automatic halt of the installation Activation of internal accident procedures Leak caused by mishandling Training of personnel Atmospheric chlorine sensors Formation of a toxic cloud in one of the two bunkers
Alarm
Closure of safety valves Automatic half of the installation Activation of internal accident procedures Malfunction of the heating system Temperature control Regular monitoring and preventive maintenance
Reduction or temporary halt in production
Malfunction of the regulatory valves
Checks of valve opening Reduction or temporary halt in production
15 Table 3: Modelling prevention and protection barriers
Variable name Definition Function
Leak_part RANDOM (0.1, 0.3) Proportion of chlorine released into
the atmosphere
Leak_time RANDOM (1,400) × 0 + 200 When leakage will occur. Here, leak time = 200 hours
Leak_interval Fixed at 72 hours Period which separates two leakages
in the same part of the system Leak_rate PULSE (Leak_part, Leak_time, Leak_interval) Quantity of chlorine released at a
certain point, and recurring after a defined interval between two leaks Gas_chlorine_leak Security_valve_3 × Leak_rate Flow of chlorine released
Alert IF (((Production_input < (Production_flow * 0.90)) OR (Production_input > (Production_flow * 1.10))) THEN 1 ELSE 0
Activated when the chlorine flow into the production plant is either 90% less or 10% more than the flow required
Repair_time Graph Non-linearly proportional to the
proportion of gas released Alert_end DELAY (Alert, Repair_time) Time required to end the alert
Stop_alarm Binary: 0 or 1 Stops the alarm
Alert_status IF Alarm > 0 THEN 1 ELSE 0 Whether there is an active alert or not
16 Figure 2: The chlorine transfer unit (W=Wagon; SV=Security valve; RV=Regulation valve; PC=Pressure sensor; P=Pump)
17
Chlorine tank
transfer unit
Chlorine
Line
Heat
production
18 Figure 5: STELLA® modelling of stock, flow and converter variables.
Figure 6: STELLA® modelling of the chlorine tank transfer unit
Figure 7: Simulation of chlorine tank discharge. 1=chlorine tank 1; 2=chlorine tank 2. The x-axis represents time in hours (0-400). The y-axis measures the quantity of chlorine in the tank (0-60,000kg)
19 Figure 8: Simulation of liquid chlorine transfer from bunker 1 into the chlorine line for transformation into gas. The x=axis represents time in hours (0-400). 1=Regulation valve 1 where the liquid chlorine flow ranges from 400 to 700 kg/h. 2=Collector where liquid chlorine flow ranges from 400 to 1000 kg/h.
Figure 9: Shutdown of the chlorine tanks following alert activation at t=200 hours.
Figure 10: Chlorine flow in the collector (2) and regulation valve 1 (1) in normal mode, and after shutdown at t=200 hours.
20 Figure 11: Software modelling of chlorine leakage (A) and safety measures (B)