HAL Id: hal-01593331
https://hal.archives-ouvertes.fr/hal-01593331
Submitted on 26 Apr 2019
HAL is a multi-disciplinary open access
archive for the deposit and dissemination of
sci-entific research documents, whether they are
pub-lished or not. The documents may come from
teaching and research institutions in France or
abroad, or from public or private research centers.
L’archive ouverte pluridisciplinaire HAL, est
destinée au dépôt et à la diffusion de documents
scientifiques de niveau recherche, publiés ou non,
émanant des établissements d’enseignement et de
recherche français ou étrangers, des laboratoires
publics ou privés.
Dry coating of talc particles with fumed silica: Influence
of the silica concentration on the wettability and
dispersibility of the composite particles
G. Lefebvre, Laurence Galet, Alain Chamayou
To cite this version:
G. Lefebvre, Laurence Galet, Alain Chamayou. Dry coating of talc particles with fumed silica:
Influ-ence of the silica concentration on the wettability and dispersibility of the composite particles. Powder
Technology, Elsevier, 2011, 208 (2, SI), pp.372-377. �10.1016/j.powtec.2010.08.031�. �hal-01593331�
Dry coating of talc particles with fumed silica: Influence of the silica concentration on
the wettability and dispersibility of the composite particles
G. Lefebvre
⁎
, L. Galet, A. Chamayou
Centre RAPSODEE, Ecole Nationale Supérieure des Techniques Industrielles et des Mines d'Albi-Carmaux, Campus Jarlard - 81013 Albi, France
a b s t r a c t
Keywords: Talc Silica Dry coating Dispersion Wettability Work of adhesionEven though dispersion operations have been the object of several investigations, the importance of the various parameters and especially the physicochemical and surface properties are rarely treated. Dry particle coating can be used to create new-generation materials by combining different powders exhibiting different physical and/or chemical properties. In such processes relatively large particles (host particles) are mechanically coated with fine particles (guest particles), without using solvents and subsequent drying, to create new functionalities or to improve initial characteristics. The purpose of this study is to modify the surface of Talc particles by dry coating with different concentrations of hydrophobic Silica (Aerosil R972®), to examine the effect of the coating on the wettability of the coated Talc particles and to study the effects on the dispersibility of these same composite particles. Dry coating is found to modify the surface of Talc particles and to control their wettability and dispersibility in aqueous solutions.
1. Introduction
Talc is widely used in many industrial areas such as paper, paints, ceramics, cosmetics and pharmaceutics; and is insoluble in water making it a good model material for this study. For economic and environmental reasons, dry particle coating is a very promising method for surface modification for many industries as it does not involve solvents and subsequent drying. In this process, materials with relatively large particle size (host particles; 1 μm–500 μm) are mechanically coated with fine particles (guest particles; 0.01 μm–50 μm) in order to create new functionalities or to improve their initial characteristics[1]. Typical applications of dry coating include modification of flowability, wettability (hydrophobic/hydrophilic properties), solubility, dispersi-bility, flavour, etc. The guest particles being necessarily small, means that Van der Waals interactions are strong enough to obtain a stable ordered mixture and the mechanical forces applied by the coating device keeps them firmly attached to the larger host particles. Either a discrete or continuous coating of guest particles (Fig. 1) can be achieved depending on the operating conditions such as processing time, mechanical action, weight fraction of guest to host particles and the physical properties of the used particles [2]. This process has been successfully used to modify the surface properties of Silica particles[3,4]. In a previous study on the kinetics of the dispersion of Talc powder in liquids, Galet et al. [5] showed that there was a relationship between the optimum stirring power and the total work of dispersion
of Talc. This study is extended here by examining the effects of changes in surface properties of Talc powder by dry coating with silica nano-particles. This type of Silica has two interesting properties. Firstly, such surface coatings by nano-silica guest particles bring only a negligible change in size of the Talc host particles. Secondly because of their very small size and their small refraction index, these Silica particles are not detectable by the optical fiber used for the dispersion kinetics measurements (see Experimental Part) and do not interfere with the measurement signal. The hydrophobicity of Talc particles, modified by coating with Silica, will be estimated by contact angles measurements of the different samples with pure water.
2. Materials and methods
2.1. Powders and their characterization
Talc, (Mg3Si4O10(OH)2), is a hydrated magnesium sheet Silicate
presenting a lamellar structure. Fine Talc powders with narrow particle size distributions are generally obtained by air jet milling and turbo classification. As grinding can change the surface properties of particles, a single type of Talc mined in France has been used: Talc 00 (Luzenac, France), micronized with a 100 AFG fluidized bed air jet mill. This Talc will be called Talc 9000 (in reference to the micronization conditions). The particle size (d50≈7 μm) of this Talc
has been determined using a Malvern Mastersizer 2000 (dry dispersion in air). Its specific surface area, calculated with the BET model using a Micrometrics® Asap 2010, is 5.2 m2/g. Fumed
hydrophobic silica (Aerosil R972® Silica) with a specific surface area of 114 m2/g has been supplied by Degussa. Its surface has been
⁎ Corresponding author.
modified by dimethyldichlorosilane to make it hydrophobic. The true solid densities of Talc 9000 and Aerosil R972® were obtained using a Micrometrics AccuPyc 1330 helium pycnometer, they are respective-ly: 2.75 g/cm3and 1.95 g/cm3.
The uncoated and coated Talc particles were examined with scanning electron microscopy (SEM) to study the surface morphology and particle shapes before and after coating. The lamellar shape of Talc particles can be seen on Fig. 2 a whereas image b shows highly agglomerated silica particles (agglomerates size≈250 nm). The primary particle size is about 16 nm.
2.2. Coating process
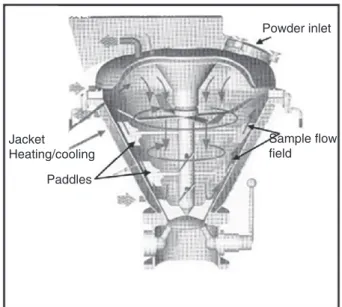
A Cyclomix high shear mixer has been successfully used to carry out coating[2,3,6]. The apparatus used here is a vertical high shear mixer (Fig. 3), supplied by Hosokawa Micron B.V. with a nominal volume capacity of 1 L. Industrial versions are available with capacities of up to 1 m3. The working principle of the Cyclomix differs
markedly from other mixing techniques by the specific interaction between the product being mixed and vessel wall. The powders (host and guest particles) are loaded at the top of the conical mixing vessel to a filling ratio 66%. The high rotation speed of the paddles (2240 rpm) forces the particles to the wall where the conical shape
of the vessel forces the product from the lower to the upper zone of the vessel. At the top, the product flows inwards and downwards into the centre of the vessel. This flow pattern gives fast macromixing. During the upward motion, the particles are accelerated by the paddles and intensively mixed by friction with the vessel wall. At the end of the process, the totality of the powder (Talc+Silica) contained in the Cyclomix is recovered for the experiments. The processing time used in this work was 10 min. The values of the Silica concentration were in the range from 0% to 10% in weight.
2.3. Wettability measurements
The critical surface energy of coated and uncoated Talc 9000 particles was first estimated by the Stevens Method[7]. In this the wettability of powders is determined by sprinkling the powder on liquids having a range of surface tensions obtained by varying the proportions of isopropanol and water (colored by methylene blue) mixtures. This test gives a “wetting number”, which is the surface tension γLVof the mixture with a minimum of isopropanol content,
that wets the powder in less than 1 min. A powder is considered as wetted by a liquid if it has either sunk into the liquid or if remains at the surface, but is colored by methylene blue. Surface tensions of the mixtures were measured with a tensiometer Kruss® K12 using the Wilhelmy plate method.
The contact angles of the powders were then measured by the sessile drop method (performed with a tensiometer ILMS-GBX) by deposing a small drop (five drops per sample) of 10 μL of pure water on tablets formed from powder. The tablets were made by a compression under a load of 30 kN using an Instron® press. The shape of the drops was observed and used to determine the contact angles. These contact angles values were used to calculate the work of adhesion using the Eq.(1):
Wa= γLV:ð1 + cos θÞ ð1Þ
2.4. Measurement of dispersion kinetics
Measurements of dispersion kinetics of uncoated and coated Talc particles in water were performed using a three baffled stainless steel reactor (10.5 cm diameter) with a 3.5 cm diameter dispersion stirrer (deflocculating). An optical fiber sensor was used to measure the dispersion rate of particles in water. This non-commercial device was Continuous
+
Guest particles
Host particle Mechanical Forces
Film Monolayer
Fig. 1. Dry particle coating principle.
10 µm
2 µm
Fig. 2. (a) Talc particles (×3200) and (b) Aerosil R972® particles (×12,600).
Powder inlet Jacket Heating/cooling Sample flow field Paddles
developed at Polytech'Marseille (see[8]for more information) for the measurement of particle concentrations. The technique is based upon the back-scattering of light by the particles. The optical fiber sensor comprises a bundle of seven fibers. The central fiber carries light into the liquid from an external LED source and the six other fibers are used to detect the backscattered light. The sample volume analyzed by the sensor (5 to 10 mL) depends on the suspension concentration. The
sensor is used in conjunction with a signal conditioner and a PC with Labview® data acquisition software. The light intensity, collected by each crown pf receiving fibers, is a function of the volume fraction of the dispersion and the scattering properties of particles (size, shape and refraction index). For a given concentration of particles, the signal decreases when the particles size increases[8]. Preliminary studies[9] show that the position of the sensor in the reactor has no influence on
a
h
g
f
e
d
c
b
Small Silica
agglomerates
Fig. 4. SEM pictures (×6400) of uncoated Talc particles (a) and coated particles with different concentrations of Silica: 1% (b), 2% (c), 3% (d), 4% (e), 5% (f), 7% (g) and 10% (h).
Table 1
Results of Stevens method.
Silica concentration (% w/w) 0 0.5 1 1.5 2 2.5 3 4 5 7 10
the relative dispersion kinetics. In our experiments the sensor was located at 2 cm from the bottom of the reactor. The linearity of sensor response to changes in solids concentration has been validated in separate experiments and the sensor calibrated to determine the response to a given concentration of powder. The maximum response when the powder is fully dispersed is used to normalize the results of each experiment to fractional dispersion values. To be sure that the signal obtained at the end of an experiment corresponds to the total dispersion, the stirring speed is increased to the maximum to disperse all the particles. This maximum response is referred to as R∞. The sensor response to the dispersion of the powder in a liquid, is merely an arbitrary voltage R which can be related to the concentration of
dispersed particles by calibration if the dispersion profile has to be developed. For a constant size, the extent of dispersion, X(t), is defined in Eq.(2).
X tð Þ = R tð Þ R∞ =
C tð Þ
C∞ ð2Þ
The stirring speed was 1500 rpm. According to the Eq. (3) the corresponding stirring power in the liquid is 1000 W m−3.
P= NPρN3d5 ð3Þ
Table 2
Results of wettability (contact angles measurements) and dispersion speed (S: slope at the origin of the kinetics). Silica concentration (% w/w) 0 0.5 1 1.5 2 2.5 3 4 5 7 10 Contact angle (°) 53.3 ±0.2 52.4±0.9 53.6±0.6 58.6 ±2.1 61.4 ±1.4 72.4 ±2.2 77.5 ±1.5 82.4 ±1.9 103.9 ±1.2 122.8 ±1.6 133.4 ±2 Work of adhesion Wa (mJ m−2) 116.3 ±1.5 117.2 ±2.2 116±1.9 110.7 ±3.5 107.7 ±2.8 94.9 ±3.8 88.5 ±2.8 82.4 ±3.3 55.3 ±2.1 33.4±2.1 22.8 ±2.1 S(ms−1) 2.59 ±0.10 2.75±0.39 1.95±0.25 2.05 ±0.25 1.45 ±0.31 1.19 ±0.10 1.06 ±0.40 0.68 ±0.23 0.41 ±0.10 0.19±0.15 0.17 ±0.10
a
h
g
f
e
d
c
b
i
h
θ
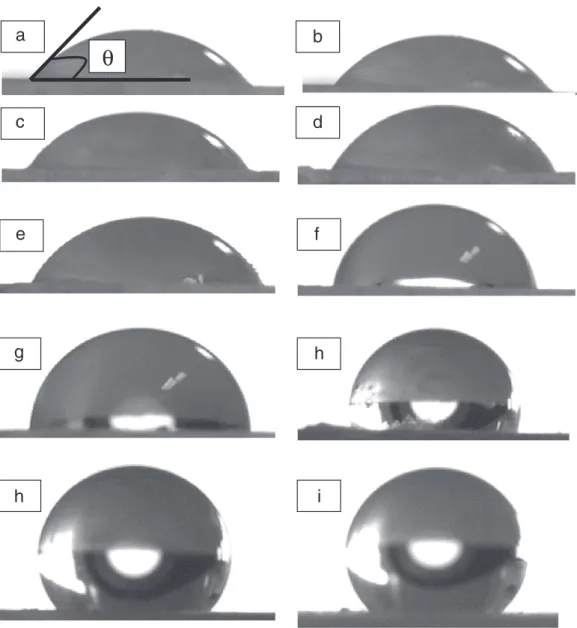
Fig. 5. Pictures at t0of water sessile drops on uncoated Talc tablet (a) and coated Talc tablets with different concentrations of Silica: 0.5% (b), 1% (c), 1.5% (d), 2% (e), 3% (f), 4% (g),
Where P =power dissipated (W m−3), N
P=power number given by
the stirrer supplier (1.06), ρ=liquid density (1000 kg m−3),
N=stir-ring speed (25 s−1), d =stirrer diameter (35.10−3m).
3. Results and discussion 3.1. Surface morphology
The SEM photos (Fig. 4) show a discrete and uniform coating in which all the Silica particles play a part. During the observations, no single or agglomerated free Silica particles were observed on the support. The increase of the silica concentration on the Talc surface appears clearly in these pictures. For all the samples, some parts of the Talc surface remain free except for the 10% concentration for which almost all the surface is recovered by Silica.
3.2. Wettability measurements
The results of wettability measurements as a function of Silica concentration are listed inTable 1(Stevens method) and Table 2 (Sessile drop method).
Table 1shows that the surface tension of the water/isopropanol mixture has to be decreased to wet the powder meaning that the wetting number decreases when the concentration of hydrophobic silica guest particles increases.Table 2presents the values of contact angles and work of adhesion as a function of the silica concentration. From 0% to 10%, the contact angles increases from 53° to 133°, which confirms the increase in hydrophobicity of the composite particles caused by the presence of hydrophobic Silica. This trend is illustrated by the behavior of water drops on the tablets (Fig. 5). The work of adhesion, related to the affinity between the particles and the liquid (water), decreases with increase in silica concentration.
In the following Section 3.3 (Dispersion kinetics) the relation between the work of adhesion and the dispersion kinetics will be discussed.
3.3. Dispersion kinetics
Fig. 6shows the dispersion kinetics of the uncoated and coated Talc particles with different silica concentrations. The presence of silica modifies the dispersion kinetics of Talc 9000: the higher the silica concentration, the lower is the rate of dispersion.
For 0.5% silica concentration, the dispersion stays unchanged and complete dispersion is obtained at the same time as with the uncoated particles (about 1200 s). When the silica concentration is increased from 1% to 10%, the work of adhesion decreases from 116.3 mJ m−2to
22.8 mJ m−2and the dispersion rate, characterized by the slope at the
origin (S) of the dispersion kinetics (see Fig. 6) decreases from 2.59 ms−1 to 0.17 ms−1(seeTable 2). For silica concentrations higher
than 5%, the general aspect of the dispersion kinetics is changed and for the 10% concentration a threshold value seems to have been reached at which the stirring power used is no longer sufficient to obtain a complete dispersion. For this silica concentration, a plateau is reached at about 80% dispersion (20% of the powder remains at the surface of the water) at between 5000 s and 7000 s (not shown in this figure), and the stirring power has to be increased to obtain a total dispersion.
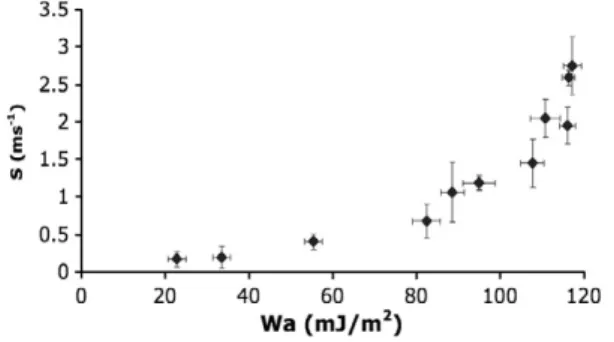
Increasing the silica concentration from 0 to 5% leads to a strong decrease of the work of adhesion (from 116.3 mJ m−2to 55.3 mJ/m2)
which is accompanied by a big decrease in the rate of dispersion characterized by S, from 2.59 ms−1to 0.41 ms−1(seeTable 2and
Fig. 7). The same increase of 5% in the silica coating (from 5% to 10%) leads to a smaller decrease of the work of adhesion from 55.3 mJ/m2to
22.8 mJ/m2 and a smaller decrease in the rate of dispersion (from
0.41 ms−1to 0.17 ms−1). Thus, the first modification of the surface of
Talc 9000, characterized by small additions of coating silica (0.5%–4%), has a strong influence on the rate of dispersion. The influence of larger quantities of silica (5%–10%) on S is less. For example in the experiments with 7% and 10% Silica, S is almost the same, but with 10% silica only 80% of the particles are dispersed and the stirring power has to be increased to complete the dispersion. One hypothesis
S = Slope at the origin dX(t)/dt at t=0
Fig. 6. Dispersion kinetics of Talc coated with different concentrations of Silica (P =1000 Wm−3).
Fig. 8. Correlation between raw data and the fit (2% Silica concentration).
is that for high concentrations of silica (greater than 4%), almost all the Talc is covered by silica and we reach a critical work of adhesion.
Up to the values of 4% silica concentration, the experimental curves can be fitted (Figs. 8 and 9) by a two parameter exponential model presented elsewhere[5,10,11]and given in Eq.(4), where k (ms−1) characterizes the dispersion rate and A corresponds to the
final stage of the dispersion. The value of A approaches 1 when all the particles are dispersed in the liquid.
X tð Þ = A 1−e! −kt" ð4Þ On the one hand, for silica concentrations from 0% to 4%, the decrease in the work of adhesion leads to a decrease in the rate of wetting (and also the rate dispersion) but the wetting is not considered as a “limiting step” at the stirrer speed used. On the other hand, for the silica concentrations greater than 4%, the shape of the dispersion kinetics changes, particularly over the first thousand seconds (for example between 0 s and 1000 s for the 10% concentra-tions inFig. 6). One of the future objectives will be to find another model for such kinetics, including another parameter characteristic of this limiting wetting step.
4. Conclusion
This study indicates that it is possible to change the dispersion properties of Talc particles by coating them with hydrophobic Silica (Aerosil R972®) using a Cyclomix as dry coating device. The coating obtained is a discrete coating of silica on the surface of Talc particles and it makes the Talc more hydrophobic. This is confirmed by the measurements of the work of adhesion determined by the sessile drop method on tablets of powder. An important result of this study is that the work of adhesion can be related to the dispersibility of the particles system in water. At silica concentrations of between 0 and 4%
Silica concentrations, the dispersion kinetics can be fitted by two parameter model where the values k and A relate respectively to the rate of dispersion and the height of the plateau. One of the future objectives is to determine a fit for higher Silica concentrations (between 5% and 10%) where there is an initial wetting step before the dispersion. This causes either an increase in the time for complete dispersion or a decrease of the quantity of powder finally dispersed. References
[1] I. Yoshihara, W. Pieper, Hybridization – technology for surface modification of powders without binders, Swiss Pharma 6 (1999) 21.
[2] R. Pfeffer, R.N. Dave, D.G. Wei, M. Ramlakhan, Synthesis of engineered particulates with tailored properties using dry particle coating, Powder Technology 117 (2001) 40–67.
[3] Y. Ouabbas, A. Chamayou, L. Galet, M. Baron, G. Thomas, R. Grosseau, et al., Surface modification of silica particles by dry coating: characterization and powder ageing, Powder Technology 190 (2009) 200–209.
[4] G. Thomas, Y. Ouabbas, P. Grosseau, M. Baron, A. Chamayou, L. Galet, Modeling the mean interaction forces between powder particles. Application to silica gel-magnesium stearate mixtures, Applied Surface Science 255 (2009) 7500–7507. [5] L. Galet, C. Goalard, J.A. Dodds, The importance of surface energy in the dispersion
behaviour of talc particles in aqueous media, Powder Technology 190 (2009) 242–246.
[6] Y. Ouabbas, J. Dodds, L. Galet, A. Chamayou, M. Baron, Particle–particle coating in a cyclomix impact mixer, Powder Technology 189 (2009) 245–252.
[7] P. Stevens, L. Gypen, Wettability of powders, Pharm Development, Belgium 51 (1974) 150–155.
[8] L. Bergougnoux, J. Misguich-Ripault, J.L. Firpo, Characterization of an optical fiber bundle sensor, Review of Scientific Instruments 69 (1998) 1985–1990. [9] C. Goalard. Etude physico-chimique du procédé de dispersion des poudres libres
et agglomérées en milieu liquide, PhD Thesis, Ecole des Mines d'Albi-Carmaux, France, 2005.
[10] T.P. Kravtchenko, J. Renoir, A. Parker, G. Brigand, A novel method for determining the dissolution kinetics of hydrocolloid powders, Food Hydrocolloids 13 (1999) 219–225.
[11] C.K. Larsen, O. Gaserod, O. Smidsrod, A novel method for measuring hydration and dissolution kinetics of alginate powders, Carbohydrate Polymers 51 (2003) 125–134.