HAL Id: hal-01845772
https://hal.archives-ouvertes.fr/hal-01845772
Submitted on 5 Sep 2018
HAL is a multi-disciplinary open access
archive for the deposit and dissemination of
sci-entific research documents, whether they are
pub-lished or not. The documents may come from
teaching and research institutions in France or
abroad, or from public or private research centers.
L’archive ouverte pluridisciplinaire HAL, est
destinée au dépôt et à la diffusion de documents
scientifiques de niveau recherche, publiés ou non,
émanant des établissements d’enseignement et de
recherche français ou étrangers, des laboratoires
publics ou privés.
Mechanism of formation of lysozyme crystals in
concentrated ammonium sulfate solution from
concentration profiles and equilibria : influence of the
2nd osmotic virial coefficient
Fabienne Espitalier, Yu Chia Cheng, Abraham M. Lenhoff
To cite this version:
Fabienne Espitalier, Yu Chia Cheng, Abraham M. Lenhoff. Mechanism of formation of lysozyme
crystals in concentrated ammonium sulfate solution from concentration profiles and equilibria :
influ-ence of the 2nd osmotic virial coefficient. Powder Technology, Elsevier, 2009, 190 (n° 1-2), p.112-117.
�10.1016/j.powtec.2008.04.085�. �hal-01845772�
Mechanism of formation of lysozyme crystals in concentrated ammonium sulfate
solution from concentration profiles and equilibria: Influence of the 2nd osmotic
virial coefficient
F. Espitalier
a,⁎
, Y.C. Cheng
b, A.M. Lenhoff
baRAPSODEE, UMR CNRS 2392 Ecole des Mines d'Albi-Carmaux, France bUniversity of Delaware, Newark, DE 19716 USA
A B S T R A C T
Keywords:
Moment of population Protein
Crystallization Second virial coefficient
We have modelled the nucleation of the orthorhombic crystal form of lysozyme and subsequent crystal growth from concentration profiles established during the measurement of equilibrium in concentrated solutions of ammonium sulphate. A BCF mechanism for the crystal growth has been assumed. The second osmotic virial coefficient is used to calculate the activity coefficient of the protein in solution. A steep decrease of B22is predicted for salt molalities higher than 6.8 m.
1. Introduction
During the determination of the solid–liquid phase diagram for lysozyme/ammonium sulfate solutions, the concentration profiles of lysozyme after the mixing of protein and ammonium sulfate solutions have been measured for salt molalities ranging between 3 and 8.5 m at pH 8 and 25 °C[1,2]. The concentration decreases very quickly initially to attain a first plateau (in a few seconds). At this point two phases are in equilibrium: a liquid containing ammonium sulfate, water and pro-tein, and a solid (dense) phase containing amorphous propro-tein, water and ammonium sulfate. After some hours, the concentration begins to decrease toward a second plateau. During the second decrease in concentration, a crystal phase detected by X-ray analysis is formed. At the end of the experiment, the supernatant concentration is assumed to be equal to the equilibrium solubility of the crystal phase (ortho-rhombic structure). Three phases are present in the vessel: crystal phase, dense phase and liquid phase. Two types of experiments have been performed. At low molality (Ib5.5 m), only a crystal phase is formed. At high molality (IN5.5 m) an amorphous phase appears immediately, and after a few hours the crystal phase is formed.
The aim of this study is to try to understand the mechanism of formation of the crystal phase and model it. The classical theories of nucleation and growth have been used. The knowledge of the kinetics of lysozyme crystallization provides information that can aid in understanding the interactions involved during crystallization and permits identification of favourable crystallization conditions for the design of large scale crystallization processes.
2. Model
2.1. Nucleation and growth rates
Solution of the population and mass balances permits calculation of the concentration profile as a function of time. The population balance has been written in terms of the moments of distribution; equations in terms of the normalized moments are given in the Appendix. Solution of these equations requires knowledge of the supersaturation ratio S and the nucleation and growth rates of the crystal phase (J and G).
In the following calculations, the crystals are considered to be spherical in shape.
The nucleation rate J has been calculated using[3]: J ¼ zf ⁎C0exp −ΔG⁎k
BT
! "
with ΔG⁎ the critical free enthalpy, ΔG⁎ ¼ 16πυ20σ3
3 kðBTÞ2ln2S; zthe Zeldovich
factor, z ¼ W⁎
3πkBT n⁎ð Þ2
# $1=2
. f⁎ is the monomer attachment frequency, which can be described, for attachment controlled by volume dif-fusion, by fdiffusion⁎=(48π2m0)1/3DCeq′ Sn⁎1/3, and, for attachment
con-trolled by interfacial transfer, by finterface⁎=(6π2m0)1/3DCeq′ Sn⁎2/3with
C0 the concentration of nucleation sites, Ceq′ the equilibrium molar
concentration of protein, D the diffusion coefficient of the protein in the medium, T the temperature, n⁎ the number of molecules in the critical cluster, v0the molecular volume of the protein in the solid
phase, and σ the crystal/solution surface energy.
A Burton–Cabreara–Frank (BCF) mechanism has been chosen to describe the crystal growth. The growth rate G is expressed by G ¼
Ksc1 Ksc2ðS−1Þ 2tanh Ksc2 S−1 ð Þ # $
where Ksc2is a function of surface energy,
tem-perature, diameter of the growth units, number of cooperating spirals
⁎ Corresponding author.
and Ksc1of temperature, retardation factor during adsorption of the
growth unit into a kink site in the step, shape of the spiral, number of growth units per unit volume of solution and activation energy of dehydratation.
The supersaturation ratio has been calculated by the classical expression, S ¼ γLC ′
γL eqCeq′.
The activity coefficient of the protein has been expressed in terms of the osmotic virial coefficients[4]
lnγL
¼ 2B22C ′ þ32B222C ′2þ 0 B% 2222C ′3&≈2B22C ′
where C′ is the protein molar concentration and the standard state for
the protein is taken such that γL→1 as C′→0, B
22and B222are the
second and third osmotic virial coefficients respectively. In a dilute
solution, binary interactions are much more probable than ternary interactions so it usually suffices to examine only interaction involving pairs of particles. When B22is negative, the net interaction between
protein molecules is attractive and when B22is positive, the net
in-teraction is repulsive.
Combining the equations for activity coefficients and supersatura-tion ratio gives an estimate of the thermodynamic driving force for crystallization:
S ¼ exp
⌊
ln CCeq
! "
þ 2B22Mprotein%C−Ceq&Wwaterρsolution
⌋
with C the concentration of protein expressed in molality (kg protein/
kg water), Mproteinthe molar weight of protein, wwaterthe weight
fraction of water in the solution and ρsolutionthe density of the solution.
2.2. Model assumptions
In the model, we have assumed that:
• One parameter permits description of the surface energy for
experi-ments in the presence or absence of the amorphous phase. The surface free energy can be expressed in terms of the interactions between protein molecules[5]. In the case of low solubility, the authors proposed
σ ¼ −K kBT d0=2 ð Þ2 ! ln !s m ! "
where K is a constant function of the stacking of molecules in the crystal lattice z (for instance, K=0.042 for z=6), !s is the volume
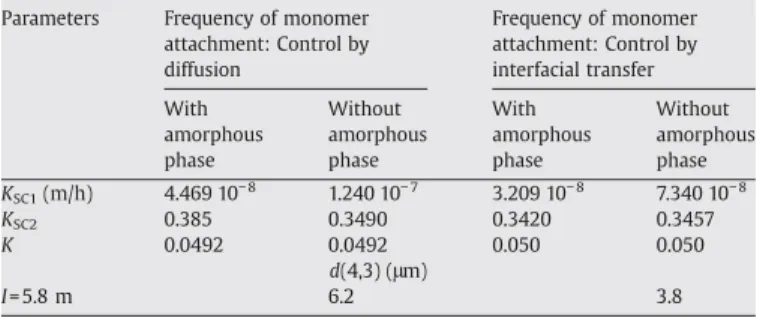
Table 1
B22 values, growth rate parameters from σ ¼ −K kBT
d0=2 ð Þ2 # $ ln!s m # $
for the surface energy, and mean volume diameters
Parameters Frequency of monomer attachment: Control by diffusion Frequency of monomer attachment: Control by interfacial transfer With amorphous phase Without amorphous phase With amorphous phase Without amorphous phase KSC1(m/h) 4.469 10− 8 1.240 10− 7 3.209 10− 8 7.340 10− 8 KSC2 0.385 0.3490 0.3420 0.3457 K 0.0492 0.0492 0.050 0.050 d(4,3) (μm) I= 5.8 m 6.2 3.8
Fig. 1. Evolution of the measured second osmotic virial coefficients (
◆
andw) as a function of the molality (parameter values inTable 1), the calculated second osmotic virial coefficients from crystallization model (■), and the calculated second osmotic virial coefficients from the correlation of Haas et al.[6]with A=1.47·10−5and z=2 (- - - -).fraction of protein in the liquid phase at equilibrium, m is the number of lattices sites occupied by a protein molecule (=Mprotein/Mwater/
ρprotein·ρwater) and d0 is the diameter of a protein molecule. The
volume fraction of protein in the liquid phase at equilibrium decreases as the salt concentration increases, as the ratio !s
m
# $
is lower than 1: the surface energy crystal/solution increases when the molality increases.
• The growth rate does not depend on salt concentration (same KSC1
and KSC2for all experiments) but is modified in the presence of
amorphous phase.
• The amorphous phase does not modify the nucleation rate (primary
nucleation), so the amorphous phase is assumed inert with respect to nucleation in these calculations.
For molalities higher than 7 m, experimental values of B22are not
available because of experimental difficulties, so we have chosen to estimate the missing values of B22.
Therefore the number of fitted parameters is 10: one parameter for the nucleation rate, two parameters for the growth rate without
Fig. 3. Concentration profiles with K = 0.0492, frequency of monomer attachment control by diffusion (a) without amorphous phase and (b) in presence of amorphous phase at different molalities I (m) and initial protein concentration Ci(g/kg) (points are experimental values and continuous lines are calculated values).
amorphous phase, two parameters for the growth rate in the presence of amorphous phase, and five virial coefficients with eleven independent concentration profiles.
The minimized function is: f ¼Nexperiment∑ k¼1 ∑ Npoint j¼1 Cexperimentalðj; kÞ−Ccalculatedðj; kÞ ' (2 variance j; kð ÞCcalculatedðj; kÞ2
The variance(j,k) represents the errors on each point j during the experiment k estimated from replicating experiments conducted at the same operating conditions.
The parameter estimation has been done in two steps. During the
first step, only experiments in the presence of the amorphous phase
are taken into account. One parameter for the nucleation rate K (con-stant necessary to calculate the surface energy), two parameters for the growth rate in the presence of amorphous phase and six virial coeffi-cients have been fitted with six independent concentration profiles. Different initial guesses were used for each of these parameters in order to verify that the same optimum was found in each case.
The second step makes it possible to estimate the two parameters for the growth rate in the absence of the amorphous phase as well as two virial coefficient values; four independent concentration profiles obtained in the absence of amorphous phase were used for this pur-pose. Again different initial guesses were tested.
3. Results
The values of the nucleation and growth rate parameters, and the constant K used to calculate the surface energy, are shown inTable 1. Two assumptions for the frequency of monomer attachment are considered. Modification of this law modifies the final size of the crystals: if the frequency of monomer attachment is the limiting step, the mean dia-meter is higher (6.2 µm instead of 3.8 µm).
The values of K (0.049 or 0.050 for attachment controlled by diffusion or by interfacial transfer respectively) are close to the value
of 0.042 proposed by Haas and Drenth[5]for a coordination number
of 6 and range between 0.042 for a cubic lattice and 0.066 for a
body-centred cubic lattice. The volume-mean diameter d43 obtained for
K=0.049 is 6.2 μm at the end of the experiment (I=5.8 m). This size
seems to be in better agreement with the experimental value than the 92 μm obtained by not considering the activity coefficient in the calculation of the supersaturation ratio (results not shown).
The calculated second virial coefficients are reported inFig. 1as a function of the ionic strength I. The net interaction between molecules is attractive and this net interaction increases steeply with the molality. InFig. 1, a simple model potential for interaction between protein molecules, B22Mprotein4ρprotein 1−A
!s m # $−2=z ′ −1 ) * + , , proposed by Haas et al.[6], is plotted. In this relation, z′ is the coordination number of a molecule in the crystal matrix and A is a parameter depending on anisotropy p and on the range of the interactions (a(λ−1)). Biswal
et al.[7]showed structure data for orthorhombic lysozyme and give
a coordination number of 4. So the correlation with A=0.033 has been chosen because the fit presents the lowest relative calculated mean error of 12% for I higher than 7 m (the calculation is done
with Mprotein=14,000 g/mol and ρprotein=1260 kg/m3). The virial
coefficient values seem to follow a reasonable trend based on conditions for which the values could in fact be measured. So although the number for adjustable parameters is high, the results show the plausibility of the model structure.
The values of growth rate are reported inFig. 2. The difference in
the value of the parameter Ksc2with and without dense phase present
is small (maximum 9%) in comparison with the variation of Ksc1. In
both cases, the calculated growth rates in the presence of amorphous phase are lower. This behaviour can be explained by a modification of the coefficient Ksc1due to a change in composition of the supernatant.
Moreover, in these calculations, the amorphous phase has been consi-dered to be inert. Simple dissolution of the amorphous phase would imply that the growth rate found is an apparent growth rate.
Fig. 3(a) presents the calculated concentration profiles obtained for different salt concentrations (ammonium sulfate 3.6bIb7.1 m) and with different initial protein concentration at pH 8 and 298 K in the
absence of the amorphous phase.Fig. 3(b) presents the concentration
profiles obtained for higher salt concentrations (IN7 m) at pH 8 and 298 K with formation of the amorphous phase. The experimental points are also shown in each figure.
The concentration profiles calculated with the model provide good agreement with the experimental concentration profiles for K=0.0492 (Fig. 3). These results are presented in term of the supersaturation ratio inFig. 3. The concentration or the supersaturation ratio profiles depend on the supersaturation ratio (which influences nucleation and growth rates) and on the ionic strength (which influences surface energy).
The model allows calculation of an energy surface ranging between 0.8 and 1.2 mJ/m2(Fig. 4). Our values of surface energy are in
agree-ment with the values of surface energy calculated for lysozyme in sodium chloride solution (between 2 and 7% NaCl) from an expression for the Gibbs free energy of an aqueous protein solution[8].
Some complementary experiments have been performed in order to validate the model in the absence of dense phase in the medium. The concentration profiles corresponding to these different experiments
Fig. 4. Supersaturation ratio profiles with K =0.0492, used to calculate the frequency of monomer attachment control by diffusion at different molalities I (m); the calculated surface energy is also indicated. (a) Without amorphous phase. (b) In presence of amorphous phase.
have been calculated for the case in which the frequency of monomer attachment is controlled by diffusion; the experimental points are re-ported as well (Fig. 5). Initially the value of B22was interpolated between
the values at ionic strengths of 3.6 and 5.8 m. However, for all expe-riments except that at 3.6 m, good agreement between the
experimen-tal and calculated profiles required B22to be adjusted. The relative
differences between the two values of B22are reported in the caption of
Fig. 5, which shows only the results at 5.5 m, in terms of concentration profiles for different initial concentrations. Interestingly, for given B22,
surface energy and growth parameters, crystallization seems possible only for a finite range of concentration due to the change in the super-saturation ratio when the initial concentration is increased.
The supersaturation ratio increases and decreases because of the product of ln [C/Ceq] and of the term [2B22Mprotein(C−Ceq)Wwaterρsolution]
for a given concentration C. When the difference (C−Ceq) increases, ln
[C/Ceq] increases but [2B22Mprotein(C−Ceq)Wwaterρsolution] decreases due
to the negative value of B22. In this case, the maximum concentration to
induce crystallization is below 20 g/kg water. This window of crystal-lization can explain why the crystalline phase does not appear despite
the high initial ratio C/Ceqused in the experiments where the
amor-phous phase appears. Formation of the crystal phase is possible only because of the formation of the metastable phase (amorphous protein), which leads to a decrease of the concentration C. Crystallization be-comes possible when C reaches the window for crystallization. 4. Conclusion
In this study we have investigated the nucleation of orthorhombic crystals of lysozyme and their subsequent growth from concentration profiles established during the measurement of the equilibrium concentration in concentrated solutions of ammonium sulphate.
We have shown that the second decrease in concentration observed in the concentration profiles can be explained by homogeneous nu-cleation of the crystal phase and growth of crystals formed (the dense phase is assumed inert). It seems that the supersaturation ratio can not be calculated by the classical hypothesis ofγL
γL
eqY1 in organic solution because of the strong protein–protein interactions. The use of this assumption induces a large dispersion in the overall growth rate. In order to take into account the ratio of activity coefficients in the supersaturation ratio, the second osmotic virial coefficient B22has been
used. Because of experimental difficulties, it is not possible to measure B22for molalities higher than 6.8 m ionic strength, so these values have
been fitted with two parameters for the growth rate and one parameter for the surface energy.
A sharp decrease in the fitted value of B22is observed for molalities
higher than 6.8 m. Moreover, the behaviour of B22seems to be
cor-rectly represented by the law of Haas et al.[5].
The overall growth rate seems to be in agreement with the face growth rate found in the literature. Two different overall growth rates have been identified with or without dense phase with the two laws for the surface energy. It seems that in the presence of the dense phase, the overall growth rate decreases at constant supersaturation. This result can be explained by dissolution of the amorphous phase. Preliminary dissolution experiments show that the dissolution is not the sole cause of the decrease in the growth rate.
Nomenclature
ai activity coefficient of species i (–)
A parameter (–)
B22 osmotic second virial coefficient (mol m3/kg2)
C protein mass concentration (kg/kg water)
Ceq protein mass concentration at saturation (kg/kg water)
C′ protein molar concentration (mol/m3)
D diffusion coefficient of protein molecule (m2/s)
dc critical diameter of nucleus (m)
d0 molecular diameter (m)
d(1,0) mean number diameter (m)
d(4,3) mean volume diameter (m)
f⁎ monomer attachment frequency (s− 1)
G overall growth rate (m/s)
J nucleation rate (1/m3/s)
K constant for the calculation of the surface energy (–)
KSC1 BCF growth rate parameter (m/s)
KSC2 BCF growth rate parameter (–)
kB Boltzmann constant (J/molecule/K)
Mprotein molar mass of protein (kg/mol)
Mwater molar mass of water (kg/mol)
n⁎ work necessary for the formation of a nucleus (J)
P constant for the calculation of the surface energy (–)
S supersaturation ratio (–)
T temperature (K)
t time (s)
Vm molar volume of protein (m3/mol)
wwater weight fraction of water (–)
W⁎ work necessary for the formation of a nucleus (J)
Z Zeldovitch factor (–)
z′ the coordination number of a molecule in the crystal matrix
Fig. 5. Calculated and experimental concentration profiles at 5.5 m. (a) B22=−32.71·10− 4mol ml/g2value interpolated between 3.6 and 5.8 m. (b) B22adjusted at−35·10− 4mol m/g2
Greek letters
α volume shape factor (–)
β volume shape factor (–)
γ surface energy crystal/solution (J/m2)
μ0 moment of order 0 (–)
μ1 moment of order 1 (m)
μ2 moment of order 2 (m2)
μ3 moment of order 3 (m3)
μ4 moment of order 4 (m4)
μi chemical potential of species i (J/mol)
θ dimensionless time (–)
m0 molecular volume (m3)
μk dimensionless moment of order k (–)
ρ density (kg/m3)
ρc density of solid (kg/m3)
ρprotein density of protein (kg/m3)
ρsolution density of solution (kg/m3)
ρwater density of water (kg/m3)
Subscript
eq equilibrium
Superscript
L liquid
Appendix A. Population balance normalized equations
The population balance equations written in terms of moments have been normalized using
θ ¼G0 L0t; μ0¼ μ0 N0; μ1¼ μ1 L0; μ2¼ μ2 S0; μ3¼ μ3 V0; μ4¼ μ4 Q0 and S ¼ C C⁎ For the calculation of N0, L0, S0, V0, and Q0, the total weight per kg of
water that can be crystallized (Ci−C⁎) has been chosen as a reference:
N0¼ðCi−C⁎Þ10 −3
αρcd3c0
dc0is the critical diameter of the nucleus at the initial supersaturation
ratio, Cibeing the initial concentration.
L0=N0dc0; S0=N0dc02; V0=N0dc03; Q0=N0dc04 dμ0 dθ ¼ J ρWwater L0 G0N0 dμ1 dθ ¼N0 G G0μ0þ dc L0 dμ0 dθ ! " dμ2 dθ ¼N0 2 G G0μ1þ d2 c S0 dμ0 dθ ! " dμ3 dθ ¼N0 3 G G0μ2þ d3 c V0 dμ0 dθ ! " dμ4 dθ ¼N0 4GG 0μ3þ d4 c Q0 dμ0 dθ ! "
The normalized mass balance equation is: dS
dθ ¼− Sðinit−1Þ dμ
%
3dθ References
[1] J.J. Moretti, S.I. Sandler, A.M. Lenhoff, Phase equilibria in the lysozyme-ammonium sulfate–water system, Biotechnol. Bioeng. 70 (5) (2000) 498–506.
[2] Y.C. Cheng, R.F. Lobo, S.I. Sandler, A.M. Lenhoff, Kinetics and equilibria of protein precipitation and crystallization in concentrated ammonium sulfate solutions, Biotechnol. Bioeng. 94 (2006) 177–188.
[3] D. Kashchiev, G.M. Van Rosmalen, Review: nucleation in solution revisited, Cryst. Res. Technol. 38 (7) (2003) 555–574.
[4] M.L. Grant, Effects of thermodynamic nonideality in protein crystal growth, J. Cryst. Growth 209 (2000) 130–137.
[5] C. Haas, J. Drenth, The interaction energy between two protein molecules related to physical properties of their solution and their crystals and implications for crystal growth, J. Cryst. Growth 154 (1995) 126–135.
[6] C. Haas, J. Drenth, W.W. Wilson, Relation between the solubility of proteins in aqueous solutions and the second virial coefficient of the solution, J. Phys. Chem. B 103 (1999) 2808–2811.
[7] B.K. Biswal, N. Sukumar, M. Vijayan, Hydration, mobility and accessibility of lysozyme: structures of a pH 6.5 orthorhombic form and its low-humidity variant and a comparative study involving 20 crystallographically independent molecules, Acta Cryst. D56 (2000) 1110–1119.
[8] C. Haas, J. Drenth, The interface between a protein crystal and an aqueous solution and its effects on nucleation and crystal growth, J. Phys. Chem. B 104 (2000) 368–377.