HAL Id: hal-00873160
https://hal.archives-ouvertes.fr/hal-00873160
Submitted on 15 Oct 2013
HAL is a multi-disciplinary open access
archive for the deposit and dissemination of
sci-entific research documents, whether they are
pub-lished or not. The documents may come from
teaching and research institutions in France or
abroad, or from public or private research centers.
L’archive ouverte pluridisciplinaire HAL, est
destinée au dépôt et à la diffusion de documents
scientifiques de niveau recherche, publiés ou non,
émanant des établissements d’enseignement et de
recherche français ou étrangers, des laboratoires
publics ou privés.
A realistic testing of a shipboard wireless sensor network
Hussein Kdouh, Christian Brousseau, Gheorghe Zaharia, Guy Grunfelder,
Ghaïs El Zein
To cite this version:
Hussein Kdouh, Christian Brousseau, Gheorghe Zaharia, Guy Grunfelder, Ghaïs El Zein. A realistic
testing of a shipboard wireless sensor network. Military Technical Academy Review, 2013, 23 (2),
pp.107-120. �10.1843.3391�. �hal-00873160�
A realistic testing of a shipboard wireless
sensor network
H. Kdouh
1,*, C. Brousseau
2, G. Zaharia
1, G. Grunfelder
1and G. El Zein
1IETR - Institut d’Electronique et de Télécommunications de Rennes
1
IETR-INSA de Rennes,
2IETR-Université de Rennes 1
UMR CNRS 6164, Rennes, France
*
E-mail : [email protected]
Abstract—Wireless Sensor Networks (WSN) may be a very useful technology for monitoring systems in hostile
environments. Few works have treated the use of this technology in the particular metallic shipboard environment. This paper reports on the deployment of a WSN on board a ferry in realistic conditions. The network was tested during sailings and stopovers for several days. The results of our previous papers reporting on the radio wave propagation on board ships are recalled. Network performance and its topology evolution with respect to previous results are presented. In spite of the metallic structure of ferries and the dynamic movement of crew and passengers on board, the results show a significant network reliability and connectivity. The previous conclusions have been also confirmed by the topology evolution of the network and the analysis of RSSI levels of links between sensor nodes.
Keywords-Wireless sensor network; ships; watertight doors.
I. Introduction
Standardized monitoring systems have been designed to ensure safe public use of structures such as bridges, aircrafts, ships and pipelines. Ships are one of the most used structures for commercial and military purposes. Existing shipboard monitoring system uses extensive lengths of cables to connect sensors and actuators to central control units. The reduction of the huge amount of cables using a wireless communication between sensors and central units would greatly reduce the cost, weight and architecture complexity of vessels [1]. However, wireless communication on board ships is limited by several factors such as metallic bulkheads, watertight doors and multipath propagation effects. A feasibility study of wireless communication on board vessels must be conducted to verify the possibility of replacing the current monitoring system by a Wireless Sensor Network (WSN). Few papers have studied the wireless communication on board ships. In [2], the authors have conducted ZigBee measurements on the passenger deck of a ship and a small WSN has been deployed between the main engine room and the control room. In [3], a WSN has also been tested successfully in the main engine room of a ship. In [4], we have tested a WSN on board a ferry. All these measurements have been carried out when the ships were moored to the harbor. To date, experiments during ship operation have not been carried out. Since the main engine or other equipment and the passengers’ movements can affect the quality of wireless communication, it is necessary to conduct measurements with a ship in operation. This paper investigates the feasibility of WSN on board vessels during realistic conditions. Based on the results of our previous studies, we have deployed a WSN in the three lower decks of a ferry called “Armorique”. The network has been tested for several days during sailings and stopovers between Roscoff (France) and Plymouth (United Kingdom). All realistic conditions (crew's and passengers' movements), fixed and mobile vehicles (“mobile” only during stopovers) in the parking, turned on motors and generators in engine rooms, etc…) have been considered. Sensing data (temperature, humidity, pressure, ambient light and acceleration), as well as data packets (sent and dropped packets, Received Signal Strength Indicator (RSSI), battery voltage) have been gathered and sent by sensor nodes to a base station placed in the control room. This paper is an extended version of the paper presented in [5].
The remainder of this paper is organized as follows: the considered environments and the measurement setup are described in Section II and Section III respectively. Section IV recalls the results obtained from our previous measurements. The network deployment procedure is presented in Section V and the results obtained are presented and analyzed in Section VI. Finally, several conclusions are drawn in Section VII.
II. Measurement sites
The network test has been carried out on board “Armorique” vessel (illustrated in Fig. 1), which is a modern ferry from the Brittany Ferries company. This 29500-tons vessel is characterized by a length of 168.3 m, a beam of 26.8 m and a capacity of 1500 passengers [6]. The deckhouse of “Armorique” consists of the bottom deck which contains the main and the auxiliary engine rooms; the second deck which houses the control room; the third, the forth and the fifth decks which are the vehicles parking; the sixth and the seventh deck which contain self service restaurants, shopping and entertainment areas; the eighth and the ninth decks which house the
passenger cabins and finally the tenth deck which houses the crew cabins and the wheel house. The tested network has mainly covered a part of the three lower decks including the parking (deck 3), the control room, the tank room, the rudder gear room, the changing room and the workshops room (deck 2), and the main and auxiliary engine rooms (decks 1 and 2). These configurations have been chosen for several reasons. Firstly, the considered environments are the most hostile for the wireless propagation on board the vessel (totally metallic bulkheads and watertight doors). Secondly, most of the sensors (and the most critical ones) of the monitoring system are located in these areas. Finally, a WSN deployed in these areas can be representative for all communication scenarios on board the vessel (communication between compartments or between decks, door opened or closed...).
The engine room of “Armorique” is composed of two adjacent rooms which are the Main Engine Room (MER) and the pump room. The common bulkhead of these adjacent rooms includes a sliding watertight door. Some equipment such as engines, generators, valves and pumps are arranged in a complex way within these two rooms. All equipment and walls in this environment are made of metals, mainly steel. The parking of “Armorique” is a big hall with metallic walls. A metallic wall located in the middle of “Armorique” parking divides it into two main parts. As measurements were performed aboard “Armorique” during sailing, vehicles of different types were parked in the parking (cars, buses, trucks, etc.).
During 105 hours test, the ferry has sailed 10 times between “Roscoff” (France) and “Plymouth” (UK). After each sailing, the ferry makes a stopover for discharge, charge and maintenance. During this period, vehicles enter to or exit from the parking. Crew members were in continuous movement between rooms and decks containing sensor nodes, which leads to a frequent doors opening and closing. This frequent motion on board the ferry changes characteristics of the propagation channel and modifies frequently the quality of the link between nodes.
Fig. 1 Picture of the Armorique ferry.
III. Measurement setup
MicaZ motes [7] developed by Memsic (previously developed by Crossbow Technology) have been used for the WSN deployment and tests. MicaZ is a 2.4 GHz IEEE 802.15.4 tiny wireless measurement system designed specifically for deeply embedded sensor networks. It has a 250 kbps data rate and is able to perform wireless communications with every node as router. Each MicaZ mote supports a processor/radio board platform MPR2400 based on the Atmel ATmega128L, MTS400 multi-sensors board including temperature, humidity, barometric pressure, acceleration and ambient light sensing capabilities. It is powered by two AA batteries. MicaZ mote operating as a Base Station (BS), supports a MIB520 gateway which provides a USB PC interface for data communications. PC runs “Moteview” monitoring software for historical and real time charting. “Moteview” provides topology map, data export capability, mote programming and a command interface to sensor networks. MicaZ motes are preprogrammed by Memsic’s XMesh routing protocol [8] which is a link-quality based dynamic routing protocol that uses periodic route update messages from each node for link quality estimation. This protocol has been used in these measurements as it allows nodes to select for routing the neighbor who has the minimal number of transmissions to the base station. This choice is not only based on the number of hops, but also on the link quality between nodes. The study of child-parent relationships between nodes will help us to analyze the effect of the environment on the establishment of connections. XMesh may be configured in one of three power modes: high power, low power and extended low power. As we are dealing with the problem of network connectivity, the high power mode with motes always powered has been used. This mode allows fixing a minimum value of 0.3 seconds to the period of data transmission by sensor nodes. A huge number of packets are sent by each sensor node during the network test, which simulates an emergency case where a large number of sensors send data frequently and simultaneously to the base station. Moreover, this mode gives a reliable statistical estimation on the links quality and the behavior of nodes with respect to the hostile and dynamic environment.
IV. Previous results
Point-to-point measurements have been previously conducted on board “Armorique” in the ISM 2.4 GHz band [9][10][10]. Different configurations and measurement scenarios have been analyzed. A communication was considered as possible if the power of the received signal was higher than the sensitivity of an IEEE 802.15.4 compliant receiver (-90 dBm) that will be used in the network test (the transmission power was 0 dBm). The most important drawn conclusions are the followings:
1) The link between two nodes placed in the same room is often possible with a good quality, whatever the configuration of communication between the transmitter and the receiver (Sight or No Line-of-Sight).
2) The communication is impossible between two nodes located inside two adjacent rooms which do not have a common door. Some exceptions may be found when many cables are installed between adjacent rooms.
3) The communication is possible between two nodes located in adjacent rooms that have a common door (even if the door was closed).
4) The excess path loss due to the closure of a watertight door is about 25 dB (~17 dB) if the door is near to (far from) the direct path between the transmitter and the receiver.
5) The communication is impossible between two nodes separated by two closed watertight doors.
6) The doors and the cables installed between adjacent rooms are probably the only sources of radio leakage for signal propagation between adjacent rooms.
7) The communication between two nodes located in two adjacent decks is possible only when they are placed near to a stairway relating the two decks. Stairways are probably the only source of radio leakage between adjacent decks.
V. Network deployment
Previous results show that doors and stairways are the main and probably unique sources for radio leakage between adjacent rooms and adjacent decks respectively. Based on these conclusions, sensor nodes of the WSN on board the “Armorique” are placed in front of doors and in stairways to maintain the connectivity in the network and to provide full radio coverage of studied area.
Although MicaZ motes have the same capacities and resources, three types of nodes in our deployment may be distinguished according to the node locations: “Stairway” nodes located in the stairway connecting Deck 2 and Deck 3, “hatches nodes” located in front of watertight doors, and “peripheral nodes” located in different rooms near the real sensors of the current monitoring system. The deployed WSN is composed of 25 sensor nodes. Table 1 shows the distribution of nodes between these three defined categories and Fig. 2 shows a planar view of nodes locations on a map of “Armorique”. The gateway node was placed in the control room in Deck 2 and connected to a laptop (running MoteView) via a USB connection.
Table 1 Types and distribution of sensor nodes.
Category Nodes
Stairway nodes 20, 21 and 22
Hatches nodes 1, 2, 3, 4, 6, 7, 8, 9, 10, 12, 14, 15 and 23
Fig. 2 Locations of the WSN nodes on board “Armorique”.
VI. Network test results
This section presents and analyzes the results obtained from the network test.
Deck 3
Deck 2
A. Sensing data
As mentioned before, MICAz motes are equipped with sensor boards measuring temperature, humidity, barometric pressure, ambient light and acceleration (horizontal and vertical). Some data samples (temperature and humidity) obtained from two sensor nodes placed in two different rooms are presented in this section. We recall that a period between two measurement samples is 300 ms (High power mode of XMesh).
Fig. 3 and Fig. 4 show the evolution of temperature and vertical acceleration in the tank room and the MER during tests. Blue curves are data sent by node N19 located in the MER and red curves are data sent by node N5 located in the tank room. As shown in Fig. 3, the temperature in the MER increases and decreases alternately. It can be noticed that the temperature in the MER increases during stopovers and decreases during sailings due to the location of N19 near to Air Conditioners (AC) of the MER. AC are used to compensate the increasing of temperature due to the machines in the MER. As these engines are turned off during stopovers, then AC are also stopped. Changes of temperature in the tank room which does not contain engines and AC are smaller and do not depend on the sailings schedule.
Fig. 3 Time-variation of the temperature (in °C) in MER and the tank rooms.
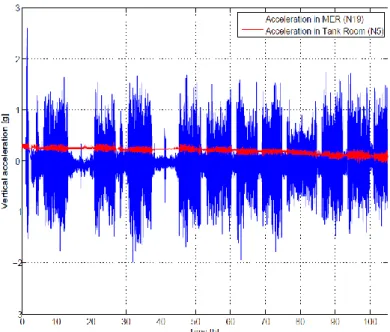
On the other hand, Fig. 4 shows the evolution of the vertical acceleration in the MER and tank room. The difference between the blue curve (MER) and the red one (tank room) is significant. Vertical acceleration in tank room is almost constant during the test. This value presents some small oscillations during sailings corresponding to vertical motion of the ship in the sea. However, the difference between sailings and stopovers is more significant in the MER. Machines oscillations in the MER during sailings cause this big difference between values of vertical acceleration in the two periods.
Fig. 4 Time-variation of vertical acceleration (in g) in the MER and the tank rooms.
B. Routing performance
Fig. 5 shows the percentage of originated packets, forwarded packets and dropped packets for each sensor node. Originated packets include all data, node health; neighbor health and route update packets originated by the node. Health packets contain information about how well the mote is performing in the mesh network, specifically radio traffic. Other health packet information includes battery voltage and the parent’s RSSI data. Forwarded packets are the packets that the node has forwarded from other nodes. Dropped packets are the packets that the node has dropped. According to the XMesh protocol, packets are considered to have been dropped when a packet has been retransmitted 8 times without receiving the acknowledgement.
The results of Fig. 5 show that more than 97% of data packets have successfully arrived to the base station, which reflects a significant reliability of the network. Results indicate also that the percentages of forwarded packets were high for nodes N1, N2, N3, N4, N7, N9, N10, N12, N14, N15, N16, N17, N20, N21, N22 and N23 (hatches and stairways nodes). These nodes were located near the watertight doors and in the stairways in order to route sensing data coming from rooms. Among these routers, N1, N2, N3, N12 and N20 have the maximum values of forwarded packets. This is explained by their locations in the radio range of the gateway node.
Although the dynamic environment on board “Armorique”, we can clearly remark that movement of persons (passengers and crew members) and objects (frequent door closing, charge and discharge of parking, etc.) did not affect the reliability of the network (in terms of packet delivery ratio). This shows the constructive aspect of the metallic shipboard environment, which creates multiple propagation paths for the radio waves, and allows the successful arrival of data packets even if the Line-of-Sight is blocked. Moreover, stairway nodes have been selected as parent nodes by peripheral nodes in the parking. Hatches nodes are also selected by peripheral nodes. This confirms the previous conclusion saying that paths followed by data packets are predictable.
Fig. 5 Percentage of dropped, forwarded and originated packets for each node after the network test on board “Armorique”.
C. Selection of parent nodes
Parent selection is launched periodically to identify the best routing neighbor. A sensor node selects the neighbor which has the minimum cost, i.e. the minimum number of transmissions to the base station. Preliminary analysis of results shows a very good agreement with previous conclusions. Peripheral nodes select hatches nodes to send their data to the base station. Nodes N18 and N19 for example have the path N14-N1-N0 as the most frequent path to the base station. Parking nodes (N23, N24 and N25) have mainly selected stairways nodes (N20, N21 and N22) as parent nodes.
We tried to close the maximum number of watertight doors during the test to simulate the worst case. However, some doors remained opened by the crew members. Therefore, some connections between nodes separated by more than one watertight door have been detected. Previous results have shown that two nodes separated by two closed watertight doors cannot communicate. For example, node N3 has selected the gateway node N0 as its parent node for 76 % of packets and nodes N1 and N12 for the remaining packets (Fig. 6). Establishment of links N3-N1 and N3-N12 is coherent, since the two sides of these connections are separated by only one watertight door. However, the connection between N3 and N0 is not possible if the watertight door of between the tank room and the control room was maintained closed.
Fig. 6 N3 and its parent nodes.
To verify the existing configuration when this link was established, the evolution of RSSI corresponding to links between N3 and its parent nodes is studied. Fig. 7 shows its time-evolution. It can be seen that N3 has selected N1 or N12 until t = 12 hours and it switches to N0 between t = 12 and t = 99 hours when it re-switches to N1 or N12. In addition, most of RSSI values corresponding to link N3-N1 are grouped around a mean value of -80 dBm. Some values increase to -55 dBm after t = 12 hours. N1 and N3 are separated by one door. The gap of 25 dB between the two levels of RSSI corresponding to link N3-N1 represents the power loss due to the closing of this door. The status of this door (opened or closed) can be simply determined by seeing the RSSI level of N3-N1. It can be noticed that N3 has switched to N0 when the door was opened and link N3-N0 remains established until the door closure at t = 100 hours. Therefore, when N0 was the parent node of N3, only one door (control room door) was closed and link N3-N0 has stopped when the second door was closed. It is also worth mentioning that
most of RSSI values of link N3-N0 are grouped around a mean value of -83 dBm. Some values reach -65 dBm. This gap of 18 dB is due to the opening of the control room door.
Fig. 7 Time-evolution of RSSI (in dBm) for the links between N3 and its parent nodes.
D. Estimation of the supplementary propagation path loss due to
watertight door closure
Although we tried to maintain most of watertight doors closed, the status of several doors has frequently changed during the measurement test. The analysis of RSSI measurements between the pairs of sensor nodes located in different rooms allows estimating the supplementary path loss due to the watertight door closure. For example, node N6 has mainly selected N3 and N1 as its parent nodes. The common watertight door between the tank room and the rudder gear room is placed on the direct path N6-N3. Similarly, as shown in Fig. 2, the watertight door between the tank room and “6000BL” room is placed on the direct path N6-N1. Fig. 8 shows the RSSI measurements of links N6-N1 and N6-N3. It can be seen that these two links have the same behavior with a slowly higher level of N6-N1. The little difference between RSSI levels proves that the watertight door of “6000BL” room was opened when N6-N1 was established. Therefore, the gap between the two main levels of RSSI in Fig. 8 corresponds to the excess path loss due to the closing of the door between the rudder gear room and the tank room. The link N6-N3 has an upper level with a mean value of -60 dBm and a lower level with a mean value of -84 dBm, which leads to an excess path loss of 24 dB. Similarly, the link N6-N1 has an upper level of -65 dBm and a lower level of -88 dBm, which leads to an excess path loss of 23 dB.
The same procedure has been followed to find the RSSI attenuation of all doors in the covered area. All these measurements have shown that the excess path loss due to closing a watertight door is bounded between 17 and 25 dB. This result is consistent with the value of excess path found with the previous measurement results.
E. Link quality and link stability
According to the fixed parameters in XMesh protocol, MicaZ nodes send sensing data packets every 0.3 second and “Health” data packets every 2 minutes. “Health” packets encapsulate the state of wireless mesh over time. They have information about how well the mote is performing in the mesh network, specifically radio traffic and contain the number of originated, dropped, and forwarded packets, retransmissions, battery voltage and other parameters related to the quality of the link between the node and its parent. In addition to its health data packets, a sensor node transmits a neighbor health packet.
Among the health data packets sent by sensor nodes, the number of retransmissions has been used to estimate the Link Quality (LQ) of each sensor node with its parent node using the following expression:
LQ(%) = (Originated + Forwarded) / (Originated + Forwarded + Retransmitted)
The link quality of each sensor node with all its parent nodes has been studied. All nodes have a mean value of link quality greater than 70 %. Critical nodes (N1, N3, N12 and N20) have a mean value higher than 90 % in spite of the huge traffic they have supported and the dynamic environment around the control room.
Moreover, the Link Stability (LS) of a node has been estimated as the percentage of parent changes with respect to the total number of node packets. A high percentage of parent changes would indicate highly time-variant channel around sensor nodes. LS was less than 7 % for most of nodes, which seems to be a good value with respect to the dynamic environment on board the ship (frequent movement of persons and objects, door opening and closing). The metallic environment is characterized by a large number of propagation paths due to multiple reflections and diffractions. Therefore, even in the presence of people and objects movement, significant link stability is ensured (it is worth mentioning here that nodes were initially located at relatively high levels to reduce the effect of movements on the link quality).
F. Power consumption
Although the high power consumption mode of XMesh was used, the evolution of power consumption of sensor nodes during the network test has been studied. The objective is not to determine the power consumption of nodes, but to compare the voltage evolution of peripheral and critical nodes. It is expected that power consumption of critical nodes such as N1, N3 and N20 will be clearly greater than that of peripheral nodes such as N18, N19 and N25. However, results indicate a small difference between power consumptions. The voltage drops of nodes N1 and N19 are depicted in Fig. 9. N1 and N19 have similar number of originated packets, but N1 has forwarded a number of packets 65 times greater than that forwarded by N19. Since the transmission and reception are the two main factors that increase the power consumption of a sensor node, N1 must have a greater consumption and it will die before N19. Nevertheless, Fig. 9 indicates a slightly larger power consumption and a slightly shorter lifetime for N1. This similarity may be explained by the overhearing problem, by which nodes waste energy in receiving all packets that are transmitted in their neighborhood even if they are intended for other nodes. Another factor may be the small route updates interval time where sensor nodes consume energy in collecting health data about their neighbors. A power control mechanism must be developed in order to enlarge the shipboard WSN lifetime. As sensor nodes send their sensing data mainly via hatches nodes or stairway nodes (critical nodes) and the links established have shown good stability and quality, it will be useful to reduce the route updates frequency to save energy.
Fig. 9 Time-evolution of the voltage for nodes N1 and N19.
VII. Conclusion
In this paper, we have investigated the performance of a WSN on board a ferry-type ship. The objective was the study of the effects of realistic circumstances (doors opening and closing, persons and objects movements …) on the network performance. The deployed network has been tested under realistic circumstances during five days. The results have shown a significant network reliability and robustness in spite of the dynamic and hostile covered environments. Moreover, the parent nodes selection was consistent with the previous conclusions and the same power attenuation due to watertight door closing, has been found from the values of RSSI. This test has also shown that link-based routing protocols may be a reliable solution for future shipboard WSN. However, some enhancements must be carried out on the power consumption mechanism. The results have indicated good links quality and stability, which allows reducing the frequency of routes updates of communications. Briefly, we proved in this paper the possibility to reduce the amount of wires of the shipboard monitoring system by using the WSN technology.
References
[1] J. P. Lynch and K. J. Loh, “A summary review of wireless sensors and sensor networks for structural health monitoring”, The Shock and Vibration Digest, 38 (2), pp.91-128, 2006.
[2] B-G. Paik, S-R. Cho, B-J. Park, D. Lee, B-D. Bae and J-H. Yun, “Characteristics of wireless sensor network for full-scale ship application”, Journal of Marine Science and Technology, Vol 14, No 1, pp.115-126, 2009.
[3] T. Pilsak, T. Schröder, J. Eichmann and J. L. Ter Haseborg, “Field test of a wireless sensor network inside the engine room of a vessel”, Hamburg University of Technology Institute of Measurement Technology, 2009.
[4] H. Kdouh, C. Brousseau, G. Zaharia, G. Grunfelder and G. El Zein, “Applying of ubiquitous wireless technologies for shipboard
monitoring systems”, WPMC’11 - 14th International Symposium on Wireless Personal Multimedia Communication, Brest, France,
October 2011.
[5] H. Kdouh, C. Brousseau, G. Zaharia, G. Grunfelder and G. El Zein, “A realistic experiment of a wireless sensor network on board a
vessel”, COMM2012 - 9th International Conference on Communications, Bucharest, Romania, June, 2012.
[6] http://www.brittany-feeries.co.uk
[7] Memsic Technology, “MicaZ motes datasheet”
http://www.memsic.com/support/documentation/wireless-sensornetworks/category/7-datasheets.html. [8] Memsic Technology, “Xmesh user’s manual”
http://www.memsic.com/support/documentation/wireless-sensornetworks/ category/6-user- manuals.html.
[9] H. Kdouh, G. Zaharia, C. Brousseau, G. Grunfelder, G. El Zein, “ZigBee-based sensor network for shipboard environments”,
ISSCS2011 - 10th International Symposium on Signals, Circuits and Systems, Iasi, Romania, July 2011.
[10] H. Kdouh, C. Brousseau, G. Zaharia, G. Grunfelder and G. El Zein, “Measurements and path loss models for shipboard environments at 2.4 GHz”, EuMC 2011 - European Microwave Conference, Manchester, UK, October 2011.
[11] H. Kdouh, H. Farhat, T. Tenoux, G. Zaharia, C. Brousseau, G. Grunfelder, Y. Lostanlen and G. El Zein, “Double directional characterisation of radio wave propagation through metallic watertight doors on board ships,” Electronics Letters, vol. 48, no. 6, pp. 307-309, March 2012.