OATAO is an open access repository that collects the work of Toulouse
researchers and makes it freely available over the web where possible
Any correspondence concerning this service should be sent
to the repository administrator:
[email protected]
This is an author’s version published in:
http://oatao.univ-toulouse.fr/23915
To cite this version:
Fabas, Aurélien
and Vande Put, Aurélie
and Doublet, Sébastien and
Domergue, Didier and Salem, Mehdi
and Monceau, Daniel
Metal dusting
corrosion of austenitic alloys at low and high pressure with the effects of Cr, Al,
Nb and Cu. (2017) Corrosion Science, 123. 310-318. ISSN 0010-938X
Metal dusting corrosion of austenitic alloys at low and high pressure with
the e
ffects of Cr, Al, Nb and Cu
Aurélien Fabas
a,⁎, Aurélie Rouaix-Vande Put
a, Sébastien Doublet
b, Didier Domergue
b,
Mehdi Salem
c, Daniel Monceau
aaCIRIMAT, Université de Toulouse, CNRS, INPT, UPS, ENSIACET, 4 allée Emile Monso BP 44362, 31030 Toulouse cedex 4, France bAir Liquide R & D, Paris-Saclay Research Center, 1 chemin de la porte des loges, BP-126, 78354 Jouy-en-Josas Cedex, France
cUniversité de Toulouse, CNRS, Mines Albi, INSA, UPS, ISAE-SUPAERO, ICA (Institut Clément Ader), Campus Jarlard, F-81013 Albi, France
A R T I C L E I N F O
Keywords: A. Superalloys
C. High temperature corrosion C. Carburization
C. Oxidation
A B S T R A C T
Commercial and model alloys were exposed at 570 °C to metal dusting conditions at 1 and 21 bar in CO-H2-H2O
and CO-H2-CO2-CH4-H2O atmospheres, respectively, with similar acand PO2.γ” precipitation beneath the surface
of 625 superalloy was due to Nb diffusion toward the Cr-depleted zone formed during oxidation. 693 superalloy was more carburised than 690 superalloy.α-Al2O3formation was believed to induce cracks through the oxide
scale, resulting in the alloy carburisation. Cu addition to a FeNiCr model alloy lead to the formation of an almost continuous Cu layer at the oxide/metal interface, greatly improving the metal dusting resistance.
1. Introduction
Metal dusting is a catastrophic type of corrosion affecting metallic materials in highly carburising atmospheres, characterised by a carbon activity (ac) greater than unity (ac≫ 1)[1,2]. This particular corrosion
phenomenon is encountered in several industrial processes, such as steam methane reforming[3], ammonia[4]and methanol production [5]and coal gasification[6]plants. The degradation processes and the degradation rates are highly dependent on the alloy composition[7 9] and microstructure [10,11], and also on the environment [6,12 14]. Many studies were performed to understand corrosion mechanisms, mainly at atmospheric pressure[5,7,15 19]. Some studies were also performed at high pressures[5,20]. Only a few publications dealt with a comparison between tests performed in both pressure domains [5,21 24]. The study of Rouaix Vande Put et al.[22]was carried out at constant ac and increasing total pressure with different oxygen
partial pressures (PO2). Nishiyama et al. studied the influence of carbon
and oxygen activities at low[25]and high[23]pressure. However, to assess the effect of the total pressure, new experiments at constant ac
and PO2are necessary since these two parameters are recognised as
important in the metal dusting literature. The resistance to metal dusting of several alloys in atmospheric pressure and high pressure environments at close carbon and close oxygen activities is reported in the following. A special attention is also given to the effects of Cr, Al, Cu and Nb. A discussion about the relevance of parameters other than the carbon activity, based on the current experiments, is already available
[24].
2. Materials and experiments
2.1. Materials
Two metal dusting experiments were performed at 570 °C. Thefirst one was carried out at atmospheric pressure (AP) in a 47.25%CO 47.25%H25.5%H2O gas mixture with a gas velocity of 1.8 × 10⁻⁵m/
s. The second test was operated at high pressure (HP) 21 bar in a 49.1%H212.8%CO 3.1%CO21.6%CH433.4%H2O gas mixture with a
gas velocity of 2.8 × 10⁻³m/s.
According to the syngas reaction, carbon activities of 33 and 32 were calculated for the AP and HP experiments, respectively. Oxygen partial pressures of 2.1 × 10⁻²⁷bar and 7.1 × 10⁻²⁶bar were esti mated for the AP and HP corrosion tests respectively, considering the water decomposition reaction. A more precise description of the AP and HP rigs and experiments is reported in references[26,27]respectively. Five commercial alloys (800HT, HR120, 625, 690 and 693) were tested in both rigs. Samples assigned to the AP and HP tests were made from different batches, except for the HR120 alloy. Two model alloys fabricated by Spark Plasma Sintering (SPS) were also tested under HP. A ternary FeNiCr alloy was made based on the composition of HR120 alloy, and a quaternary FeNiCrCu alloy was prepared substituting Ni by Cu. Model alloys were sintered from powders of the pure elements. Because of the initial oxidation of the Fe raw powder, the resulting
⁎Corresponding author.
E-mail address: [email protected](A. Fabas). http://dx.doi.org/10.1016/j.corsci.2017.04.015
microstructure contained a few volume percent of internal chromia. The chemical compositions of the alloys are reported inTable 1. All samples were ground to a P600 grit. The edges were chamfered to limit any edge effect. The samples for the AP experiment were 20 × 10 mm2
rectangles and 2 mm thick, except HR120 and 693 samples which were 1 mm thick. Samples tested at HP were disks with a diameter ranging between 10 and 14 mm and a thickness comprised between 1 and 2.6 mm. The central hole was about 1.5 mm wide. Samples made of the same material were placed upstream and downstream to ensure that the atmosphere conditions were constant along the reaction chamber in both corrosion rigs.
2.2. Sample characterisation
For both experiments, the test was interrupted about every 500 h. At every interruption samples were removed and cleaned in ethanol. Samples were systematically observed using an optical microscope in order to follow the evolution of the corrosion damage on the surface. The samples were also weighed to determine the mass change during the test. Afterfinal removal the specimens were characterised by X ray diffraction (XRD) on a Seifert 3000TT apparatus with a copper anti cathode (λ = 1.54056 Å), with a low angle of incidence of 2°, Raman spectroscopy analyses were performed on a 64000 Jobin Yvon spectro meter equipped with a confocal microscope (λ = 514 nm). Scanning Electron Microscopy (SEM) using Secondary Electron (SE) and Backscattered Electron (BSE) modes were carried out on a SEM/FIB (FEI HELIOS 600i), coupled with an Energy dispersive X ray (EDX) spectroscopy analyser (from Aztec Advanced) equipped with a SSD detector. Analyses were performed using a 5 keV accelerating voltage. The two above techniques were used on surface and cross sections of the samples. Cross sections were prepared cutting the sample after having protected the surface with a TEM resin and grounding and polishing to obtain a mirror polished surface. The experimental procedure for AP and HP tests is fully detailed in references [26,27] respectively.
3. Results
3.1. Overview
The net mass changes of the alloys during the AP and HP experiments are shown on Fig. 1. The Fe rich commercial alloys (800HT, HR120) presented large mass losses in both corrosion rigs while the Ni based superalloys (625, 690, 693) showed no significant mass change. The SPS FeNiCr samples were severely attacked, unlike the Cu enriched ones. The present paper focuses on the resistance of the three commercial superalloys and of the FeNiCr + Cu model alloy fabricated by SPS. The oxidation and the metal dusting degradation of 800HT and HR120 alloys will be studied in details in forthcoming articles see also references[24,26]. All samples presented atfirst a
mass gain, not visible due to the scale of thefigure. This mass gain can be linked to the oxidation and carburation of the samples, i.e. the incubation period before the large mass loss.
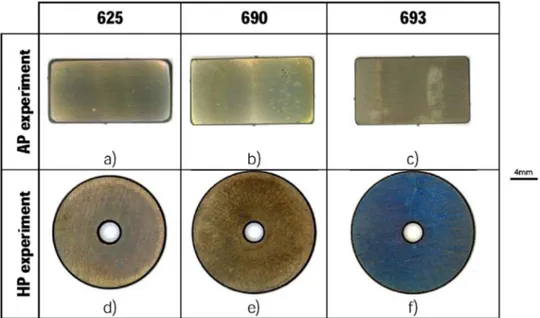
Macrophotographs of superalloy specimens exposed 6000 h in AP conditions and 7966 h under HP conditions are presented onFig. 2. For these materials no sign of degradation was visible. However, the oxide scale formed under HP seemed homogeneous, while variations in colours were visible on the AP specimens. Colour variations were localised where the samples rested on the sample holder. Thus, this is expected to be due to the modification of the gas flow in these areas.
As each material showed a similar behaviour in both conditions and for all exposure durations, only the superalloys exposed 7966 h in the HP environment will be presented.
3.2. Superalloys
3.2.1. Surface analyses
SEM observations showed that the oxide scale formed on the 625 (Fig. 3a) and 690 superalloys (Fig. 3b) was continuous, although having an inhomogeneous thickness. The oxide scale formed on the 693 superalloy exhibited Al and C rich areas (Fig. 3c) and locally a needle like morphology (Fig. 3d). Chromia and Fe Cr spinel were identified as the main constituents of the oxide scale for every material, based on XRD and Raman spectroscopy analyses. Thefluorescence of Cr3+inα Al2O3 i.e. the presence ofα Al2O3 was hardly detected
during Raman analyses on the 693 sample exposed 1987 h under HP. Its detection became easier after 7966 h in the same conditions, and even more after 14,177 h of exposure.
3.2.2. Cross sections
The cross section of the 625 sample exposed 7966 h at HP showed needle like precipitates (Fig. 4a and b). After 14,177 h of exposure, these precipitates can form locally a continuous layer at the alloy oxide interface. EDS maps obtained after FIB milling revealed that these needles contained Nb. They werefinally identified as being made of the γ” Ni3Nb phase, previously detected by XRD. These needles precipi
tated at or close to the Cr depleted zone that stemmed from the oxide scale formation (Fig. 4b andFig. 5). Other precipitates containing Cr or Si were also visible around theγ” needles. According to the work of Garcia Fresnillo et al.[28]on the oxidation of 625 superalloy at 700 °C and 800 °C, these precipitates could be Cr carbides and silica. Al rich oxide precipitates were also visible below the oxide scale. These ones are expected to be internal alumina, as observed earlier for the same alloy during oxidation tests at 760 °C[29], 900 °C and 1000 °C[30].
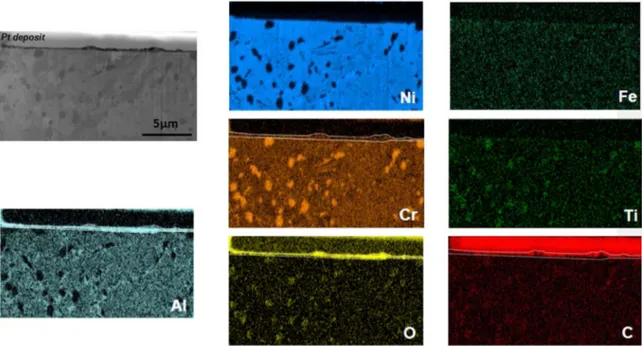
The cross sections of 690 and 693 superalloys exposed 7966 h under metal dusting conditions at HP showed a carburisation for both alloys (Fig. 4c and d). However, this carburisation is more severe for 693 alloy. In addition, the carburised depth of 693 increased with the exposure time, while it remained constant for 690. EDS maps performed on a 693 cross section obtained by FIB milling showed that the oxide
Alloy Ni Fe Cr Al Co Mo Nb Mn Si Ti Cu C V Technique 800HT AP 31.3 43.3 20.6 0.9 0.07 0.16 0.01 1.0 1.2 0.7 0.2 0.25 0.08 OESa HP 28.4 45.3 22.4 1.3 – – – 0.8 1.0 0.6 0.2 – – EDX HR120 38.2 33.3 25.6 0.2 0.02 0.13 0.4 0.8 0.8 0.02 0.07 0.33 0.08 OES 625 AP 65.7 4.4 22.3 0.5 0.04 4.2 1.7 0.1 0.4 0.4 0.01 0.17 0.03 OES HP 64.1 1.0 25.3 0.4 0.2 5.5 2.3 0.5 0.8 0.3 – – – Certificate 690 AP 60.1 9.4 28.4 0.6 0.02 0.02 – 0.3 0.6 0.4 0.01 0.09 0.04 OES HP 59.2 8.5 30.7 – – – – 0.1 0.6 – – 0.9 – Certificate 693 AP 58.0 3.0 30.8 7 – – – 0.3 0.1 0.5 – – – EDX HP 59.0 3.2 30.4 6.2 – – 0.4 0.2 0.1 0.5 0.03 0.08 – Certificate FeNiCr HP 35.3 40.8 23.9 – – – – – – – – – – EDX FeNiCr + Cu HP 29.2 36.0 26.5 – – – – – – – 8.3 – – EDX
aOptical Emissions Spectrometer.
Table 1
scale was mainly composed of Al and Cr (Fig. 6). No Cr depletion was visible beneath the oxide scale. The Ni and Al enrichments close to the Cr carbides were due to the local Cr consumption. It has to be noticed that the O detection at the location of Cr carbides is an artefact due to the overlap between the K band of O and the L band of Cr. Indeed, if the observed precipitates were Cr rich oxides, alumina would have formed, which was not the case.
3.3. SPS alloys
3.3.1. Surface analyses
As explained previously, the SPS FeNiCr alloy was deeply attacked, unlike SPS FeNiCr + Cu samples (Fig. 1). The degradation of the ternary specimens took place by pitting, while the Cu enriched alloy showed no macroscopic evidence of degradation (Fig. 7). The attack of the ternary material occurred preferentially at the edges of the sample. Its location could be explained by damage of the oxide scale during Fig. 1. Net mass change of the commercial and model alloys during metal dusting tests at (a) AP and (b) HP. (c) Higher magnification of the HP mass changes up to 7000 h.
temperature change as mechanical stress is more important at the edges or by chemical failure due to the larger Cr depletion at the sample edges. It could also be explained by the manufacturing process. Indeed, samples were taken in the transverse direction of a sintered bar fabricated in a graphite mold. The carbon could have diffused close the metal powder mold interface, leading to a pre carburisation of the external parts of the sample. To understand the resistance to metal dusting corrosion of the Cu rich material, its cross section was char acterised and compared to its initial microstructure.
3.3.2. Cross sections
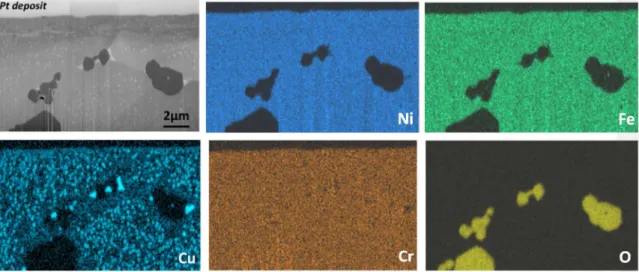
Before exposure, the Cu rich alloy showed the precipitation of a Cu rich phase at the grain boundaries (Fig. 8). In addition, muchfiner Cu rich precipitates were visible inside the grains and grain boundaries were surrounded by a precipitate free zone. These precipitates are believed to be almost pure FCC ε Cu. It is proposed that the intergranular precipitation took place during sintering, while the
intragranular precipitates formed during cooling.
The cross section characterisation of the sample exposed 7966 h under the HP conditions revealed the formation of a Cr rich oxide scale (Fig. 9). This oxide scale was identified as chromia by both XRD and Raman spectroscopy. Its formation led to a Cr depletion. EDS analyses measured between 10 to 15 at.% of Cr within the two micrometres beneath the alloy oxide interface. Beneath the oxide scale, i.e. in the Cr depleted alloy, the number of Cu rich precipitates was lower than in the bulk, and the precipitates were larger, forming an almost continuous layer. Thefine secondary precipitates observed before exposure are not present in the Cr depleted zone of the corroded alloy.
4. Discussion
4.1. Ni based superalloys
The precipitation of a Nb rich phase has already been reported in Fig. 2. Optical macrophotographs of the superalloys 625 (a and c), 690 (b and d) and 693 (c and f) exposed 6000 h at AP (a–c) and 7966 h at HP (d–f).
previous studies on 625 alloy under oxidising conditions above 700 °C [28 31]. Between 900 °C and 1000 °C, such precipitation was accom panied by the appearance of a precipitate free zone[30]. The authors explained the formation of this particular microstructure as the result of the Nb activity decrease due to the Cr depletion that stemmed from oxidation. The lower Nb activity in the Cr depleted zone induced the outward Nb diffusion toward the alloy oxide interface where it precipitated, forming a δ Ni3Nb layer. Such uphill diffusion induced
also a depletion in Nb below the Cr depleted zone, leading to the dissolution of the δ Ni3Nb precipitates, hence the formation of a
precipitate free zone. The experiments performed between 700 °C and 800 °C did not present such precipitate free zone[28,29,31]. However, the mechanism proposed by Chyrkin et al. [30] can be adapted to explain the current observations. The detection of γ” Ni3Nb in the
present study, instead of theδ phase, can be justified by the experi mental conditions. The TTT diagram of 625 alloy[32]shows that the γ” Ni3Nb phase is more likely to form at 570 °C than theδ phase, the
latter being expected for higher temperatures[28 31]. The presence of γ” Ni3Nb needles instead of a continuous layer can also be explained by
the experimental conditions. Indeed, the characteristic diffusion length Fig. 4. SEM (BSE) images of the FIB cross section of the superalloys (a) 625 before exposure and (b) 625, (c) 690 and (d) 693 after 7966 h of exposure at HP.
of Nb in pure Ni is at least one order of magnitude below the ones obtained for the conditions leading to a continuous layer formation (Table 2). The needle shape can be explained by the lattice misfit between theγ matrix (austenitic) and the γ” precipitates[33].
The reason for the great resistance to metal dusting corrosion of 625 alloy is then, as expected for high alloyed Ni based materials, its low carbon permeability [34]and its high Cr content which allows the formation and healing of a protective oxide scale[35]. In addition, its high Mo and Nb contents contribute to enhance its corrosion resistance, trapping carbon[8]and letting more Cr available to form the protective oxide scale. The effect of the Nb is believed to be enhanced by its uphill diffusion.
The severe carburisation of 693 alloy could be linked to its higher Al content compared to the 690 alloy. The increasing Cr3+fluorescence
signal of α Al2O3with exposure duration, coupled to the needle like
morphology observed for the oxide on the 693 specimen exposed 7966 h under HP, could be explained by the formation of transient alumina that turned intoα Al2O3in time. Such allotropic transforma
tion is accompanied by a large molar volume contraction [36]which may induce cracks through the oxide scale, as often observed during the oxidation of nickel aluminides at higher temperatures, e.g. by Tolpygo et al.[37]. Such cracks could constitute a direct access of the corrosive atmosphere to the metallic alloy, leading to the observed severe carburisation. Nevertheless, no transient alumina could be detected by Raman spectroscopy and XRD, but this may be due to the fact that the scale was very thin. EDS mapping onFig. 6did not discriminate the
presence of Al in the oxide scale, the latter being too thin compared to the interaction volume of the EDS analysis. As there is no clear evidence of transient alumina formation, it is also possible that α alumina formed directly from a Cr and Al rich oxide. Indeed, XRD coupled to EDS and Raman analysis suggested that the corundum phase was (Cr,Al)2O3. A second proposal can be made to explain the high level
of carburisation of 693 alloy. It is known that Al enrichment over the miscibility limit of the (Cr,Al)2O3leads to a spinodal decomposition
into chromia and α alumina [38] and is accompanied by a molar volume contraction. Then this could also be responsible for the crack formation within the oxide scale, explaining the severe carburisation of the alloy. This phenomenon would not occur on 690 because of its lower Al content. The slight carburisation of this material is supposed to stem from the early stages of exposure, when the initial competition between carburisation and oxidation took place. The resistance to metal dusting corrosion of both 690 and 693 alloys, despite the detrimental effect of Al for the latter, is explained by their high Cr content, allowing the formation and the healing of their protective chromia scale.
4.2. SPS fabricated alloys
The formation of Cu rich precipitates at the alloy oxide interface of the Cu rich specimen exposed 7966 h to the HP environment, forming an almost continuous FCC Cu rich layer, could be explained as follows. As Cr content diminished as it was consumed by the oxide growth, Cu concentration increased and the alloy composition entered in the Fig. 6. SEM (SE) micrograph of the FIB cross-section and its associated elementary maps of 693 superalloy after 7966 h of exposure at HP.
miscibility gap. This lead to the precipitation of a Cu rich phase[39]. This precipitation was also enhanced by the fact that interfaces are preferential sites for precipitation. As the oxidation of the sample continues, the Cr depletion increases, favouring the growth of the Cu precipitates and forming the observed microstructure at the alloy oxide interface. During cooling, it can be supposed that the growth of the precipitates was favoured to the detriment of the precipitation of secondary precipitates, explaining their absence in the Cr depleted zone. However, more experiments and characterisations are necessary tofirmly confirm the proposed mechanism for FCC Cu precipitation. Cu addition reduces carbon formation catalysis, as Cu possesses filled d orbitals[40,41]. It diminishes also graphite nucleation[42]and carbon solubility [42], improving metal dusting resistance. The resistance to metal dusting corrosion of the Cu rich samples can then be explained by their high Cu content which reduced the carbon transfer into the
material, favouring the formation and healing of the protective oxide scale. The formation of the Cu precipitates at the alloy oxide interface, where they could form an almost continuous layer for longer exposure times, is expected to enhance its effect. The influence of this precipita tion on the oxide adherence and thermodynamical stability, but also on the uphill Cr diffusion, have to be taken in consideration. Cu precipita tion could indeed be beneficial for metal dusting resistance but detrimental for the oxidation resistance. It has to be noticed that it was reported in the literature that Cu addition to commercial Fe Ni Cr alloys above the Cu solubility limit had a detrimental effect on metal dusting resistance[39]. The authors explained this behaviour by the precipitation of the Cu rich phase, whose interface with the matrix was considered as a preferential graphite germination site. This detrimental effect was not observed in the current study, despite a pronounced Cu rich phase precipitation. This difference could be explained by the use Fig. 8. SEM (SE) micrograph of the FIB cross-section and its associated elementary maps of the SPS FeNiCr + Cu alloy before exposure.
of model alloys, avoiding the detrimental effect of minor elements contained in the commercial alloys used by Zhang and Young[39]. The difference could also be explained by a different surface preparation, as the samples of Zhang and Young were polished to a 3μm finish while the specimens used in the present study were ground. Indeed, it is well known that grinding enhances the resistance to metal dusting of alloys which form a protective oxide scale[11].
5. Conclusions
The resistance to metal dusting of three commercial Ni based superalloys and of a Cu rich FeNiCr model alloy was investigated under high pressure for durations up to 14,000 h.
625 alloy showed great resistance to metal dusting due to its Cr rich composition, allowing the formation of a protective oxide scale. Cr depletion resulting from its selective oxidation lead to a Nb uphill diffusion and γ” Ni3Nb needles formed below the surface, beneficial for
the resistance to metal dusting.
Despite a more or less severe carburisation regarding the material, 690 and 693 alloys also showed no evidence of metal dusting degrada tion because of their high Cr content. The slight carburisation observed on 690 alloy is supposed to come from the early stages of exposure, during the initial competition between oxidation and carburisation. The severe carburisation of 693 alloy stemmed from a direct access of the atmosphere to the metallic material through cracks in the oxide scale. These cracks could be explained by the molar volume contraction induced either by a transient alumina formation that turned intoα Al2O3or by a Cr and Al rich oxide decomposition into chromia andα
Al2O3. Al is thought to be detrimental in the studied conditions.
The FeNiCrCu quaternary alloy resistance to metal dusting is explained by its Cu content, as this element decreases carbon transfer and graphite nucleation rates. The beneficial influence of Cu might be enhanced by its precipitation at the alloy oxide interface. The influence of the precipitation on the oxidation of the material should be investigated as it might influence the thermodynamics and the kinetics of the oxidation due to the localisation of the precipitates.
Acknowledgements
This work has been supported by the French national research agency through the project ANR SCAPAC 11 RNMP 0016 in partnership between Air Liquide, Veolia, Sedis, University of Nancy, CIRIMAT laboratory. The authors acknowledge Sabine Leroux of the ICA laboratory for daily monitoring of the atmospheric pressure experi ment.
References
[1] R.F. Hochman, Metal deterioration in carbon monoxide and hydrocarbons at
elevated temperatures, Third International Congress on Metallic Corrosion, University of Moscow Press, Moscow, USSR, 1966, pp. 119–133.
[2] R.F. Hochman, Catastrophic deterioration of high-temperature alloys in carbonac-eous atmospheres, Symposium on Properties of High Temperature Alloys with Emphasis on Environmental Effects, Las Vegas Nevada, 1976, pp. 715–732. [3] M.L. Holland, H.J.D. Bruyn, Metal dusting failures in methane reforming plant, Int.
J. Press. Vessels Pip. 66 (1996) 125–133.
[4] F. Eberle, R.D. Wylie, An industrial experience of attack on metals by synthesis gas from methane-oxygen combustion, Corrosion 15 (1959) 16–20.
[5] P. Szakálos, M. Lundberg, R. Pettersson, Metal dusting on an alumina forming Ni-base alloy, Corr. Sci. 48 (2006) 1695.
[6] R.A. Perkins, W.C. Coons, F.J. Radd, Metal-dusting corrosion in coal-gasification environments, J. Electrochem. Soc. 123 (1976) 733–749.
[7] H.J. Grabke, R. Krajak, E.M. Müller-Lorenz, S. Strauß, Metal dusting of nickel-base alloys, Mater. Corros. 47 (1996) 495–504.
[8] S. Strauß, H.J. Grabke, Role of alloying elements in steels on metal dusting, Mater. Corros. 49 (1998) 321–327.
[9] H.J. Grabke, Metal dusting, Mater. Corros. 54 (2003) 736–746.
[10] H.J. Grabke, E.M. Müller-Lorenz, B. Eltester, M. Lucas, D. Monceau, Resistance of 9–20%Cr-steels against metal dusting, Steel Res. 68 (1997) 179–185.
[11] H.J. Grabke, E.M. Müller-Lorenz, S. Strauss, E. Pippel, J. Woltersdorf, Effects of grain size, cold working, and surfacefinish on the metal-dusting resistance of steels, Oxid. Met. 50 (1998) 241–254.
[12] H.J. Grabke, C.B. Bracho-Troconis, E.M. Müller-Lorenz, Metal dusting of low alloy steels, Mater. Corros. 45 (1994) 215–221.
[13] A. Schneider, H. Viefhaus, G. Inden, H.J. Grabke, E.M. Müller-Lorenz, Influence of H2S on metal dusting, Mater. Corros. 49 (1998) 336–339.
[14] E.M. Müller-Lorenz, H.J. Grabke, Coking by metal dusting of steels, Mater. Corros. 50 (1999) 614–621.
[15] H.J. Grabke, R. Krajak, J.C. Nava Paz, Metal dusting of high-temperature alloys, Mater. Corros.– Werkstoffe und Korrosion 44 (1993) 89–97.
[16] P. Szakálos, R. Pettersson, S. Hertzman, An active corrosion mechanism for metal dusting on 304L stainless steel, Corr. Sci. 44 (2002) 2253–2270.
[17] P. Szakálos, Mechanisms and driving forces of metal dusting, Mater. Corros. 54 (2003) 752–762.
[18] M. Hansel, C.A. Boddington, D.J. Young, Internal oxidation and carburisation of heat-resistant alloys, Corr. Sci. 45 (2003) 967–981.
[19] Y. Nishiyama, T. Kudo, N. Otsuka, Effect of syngas composition on metal dusting of alloy 800H in simulated reforming gas atmospheres, Corrosion 62 (2006) 54–63. [20] J.Z. Albertsen, Ã. Grong, J.C. Walmsley, R.H. Mathiesen, W. Beek, A model for
high-temperature pitting corrosion in nickel-based alloys involving internal precipitation of carbides, oxides, and graphite, Metall. Mater. Trans. A 39 (2008) 1258–1276. [21] M. Maier, J.F. Norton, P.D. Frampton, Metal dusting of 9–20% Cr steels in increased
pressure environments at 560 °C, Mater. Corros.-Werkstoffe Und Korrosion 49 (1998) 330–335.
[22] A. Rouaix-Vande Put, K.A. Unocic, M.P. Brady, B.A. Pint, Performance of chromia-and alumina-forming Fe- chromia-and Ni-base alloys exposed to metal dusting environments: the effect of water vapor and temperature, Corr. Sci. 92 (2015) 58–68. [23] Y. Nishiyama, K. Kitamura, N. Otsuka, Metal dusting behaviour of alloy 800H in
laboratory carbonaceous environments under high pressure, Mater. Sci. Forum 595–598 (2008) 649–660.
[24] A.R.-V. Put, A. Fabas, S. Doublet, D. Monceau, Relevance of other parameters than carbon activity in defining the severity of a metal dusting environment, Oxid. Met. 87 (2017) 655–666.
[25] Y. Nishiyama, T. Kudo, N. Otsuka, Effect of syngas compositionon metal dusting of alloy 800H in simulated reforming gas atmospheres, Corrosion 62 (2006) 54–63. [26] A. Fabas, D. Monceau, C. Josse, P. Lamesle, A. Rouaix-Vande Put, Mechanism of
metal dusting corrosion by pitting of a chromia-forming alloy at atmospheric pressure and low gas velocity, Corr. Sci. 107 (2016) 204–2010.
[27] A. Fabas, D. Monceau, S. Doublet, A. Rouaix-Vande Put, Modelling of the kinetics of pitting corrosion by metal dusting, Corr. Sci. 98 (2015) 592–604.
[28] L. Garcia-Fresnillo, A. Chyrkin, C. Bohme, J. Barnikel, F. Schmitz, W.J. Quadakkers, Oxidation behaviour and microstructural stability of alloy 625 during long-term exposure in steam, J. Mater. Sci. 49 (2014) 6127–6142.
[29] V.P. Deodeshmukh, Long-Term Oxidation and Chromia Vaporization Behavior of High-Temperature Foil Alloys in Water vapor Containig Environment, (2012) Les Embiez, France pp. paper 158.
[30] A. Chyrkin, P. Huczkowski, V. Shemet, L. Singheiser, W.J. Quadakkers, Sub-scale depletion and enrichment processes during high temperature oxidation of the nickel base alloy 625 in the temperature range 900–1000 °C, Oxid. Met. 75 (2011) 143–166.
[31] D.M. Gorman, R.L. Higginson, H. Du, G. McColvin, A.T. Fry, R.C. Thomson, Microstructural analysis of IN617 and IN625 oxidised in the presence of steam for use in ultra-supercritical power plant, Oxid. Met. 79 (2013) 553–566.
[32] E. Schnabel, H.J. Schuller, P. Schwaab, The precipitation and recrystallization behavior of the nickel base alloy INCONEL alloy 625, Prakt. Metallogr. Paract. Metall. 8 (1971) 521–527.
[33] D.F. Paulonis, J.M. Oblak, D.S. Duvall, Precipitation in nickel-basealloy 718, ASM Trans. 62 (1969) 611–622.
[34] J. Zhang, D. Young, Coking and dusting of Fe-Ni alloys in CO-H2-H2O gas mixtures, Oxid. Met. 70 (2008) 189–211.
[35] J. Klöwer, H.J. Grabke, E.M. Müller-Lorenz, Metal dusting of nickel-base alloys, Mater. Corros. 49 (1998) 328–329.
[36] D.M. Lipkin, D.R. Clarke, M. Hollatz, M. Bobeth, W. Pompe, Stress development in alumina scales formes upon oxidation of (111) NiAl single crystals, Corr. Sci. 39 (1997) 231–242. Working temperature (°C) Time of exposure (h) DNb·t(nm) References Experimental observations
570 1987 14 This work γ” Needles No precipitate-free zone 7966 29 14,177 39 700 10,000 223 [28] δ-layer No precipitate-free zone 750 411 760 8760 432 [29] 800 1000 227 [28] 900 300 327 [30] δ-layer Precipitate-free zone 1000 1000 1349 Table 2
Characteristic diffusion length of Nb in pure Ni calculated for the current study and for references after extrapolation of the diffusion data by Patil et al. [43].
[37] V.K. Tolpygo, D.R. Clarke, Microstructural study of the theta-alpha transformation in alumina scales formed on nickel-aluminides, Mater. High Temp. 17 (2000) 59–70.
[38] A.H. Schultz, V.S. Stubican, Separation of phases by spinodal decomposition in the systems Al2O3-Cr2O3 and Al2O3-Cr2O3-Fe2O3, J. Am. Ceram. Soc. 53 (1970) 613–616.
[39] J. Zhang, D.J. Young, Effect of copper on metal dusting of austenitic stainless steels, Corr. Sci. 49 (2007) 1450–1467.
[40] W. Andreoni, C.M. Varma, Binding and dissociation of CO on transition-metal
surfaces, Phys. Rev. B 23 (1981) 437–444.
[41] Y. Nishiyama, K. Moriguchi, N. Otsuka, T. Kudo, Improving metal dusting resistance of transition-metals and Ni-Cu alloys, Mater. Corros.-Werkstoffe Und Korrosion 56 (2005) 806–813.
[42] J. Zhang, D.M.I. Cole, D.J. Young, Alloying with copper to reduce metal dusting of nickel, Mater. Corros.-Werkstoffe Und Korrosion 56 (2005) 756–764.
[43] R.V. Patil, G.B. Kale, Chemical diffusion of niobium in nickel, J. Nucl. Mater. 230 (1996) 57–60.