UNIVERSITÉ DU QUÉBEC EN ABITIBI-TÉMISCAMINGUE
FACTEURS ENVIRONNEMENTAUX INFLUENÇANT LA CROISSANCE ET LA RÉGÉNÉRATION DU BOULEAU JAUNE (BETULA ALLEGHANIENSIS
BRITTON) PRÈS DE SA LIMITE NORDIQUE DE RÉPARTITION
MÉMOIRE
PRÉSENTÉ
COMME EXIGENCE PARTIELLE DE LA MAITRISE EN BIOLOGIE
EXTENSIONNÉE DE
L'UNIVERSITÉ DU QUÉBEC À MONTRÉAL
PAR
MARC-ANTOINE GUITARD
UNIVERSITÉ DU QUÉBEC À MONTRÉAL Service des bibliothèques
Avertissement
La diffusion de ce mémoire se fait dans le respect des droits de son auteur, qui a signé le formulaire Autorisation de reproduire et de diffuser un travail de recherche de cycles supérieurs (SDU-522 - Rév.0?-2011 ). Cette autorisation stipule que «conformément à l'article 11 du Règlement no 8 des études de cycles supérieurs, [l'auteur] concède à l'Université du Québec à Montréal une licence non exclusive d'utilisation et de publication de la totalité ou d'une partie importante de [son] travail de recherche pour des fins pédagogiques et non commerciales. Plus précisément, [l'auteur] autorise l'Université du Québec à Montréal à reproduire, diffuser, prêter, distribuer ou vendre des copies de [son] travail de recherche à des fins non commerciales sur quelque support que ce soit, y compris l'Internet. Cette licence et cette autorisation n'entraînent pas une renonciation de [la] part [de l'auteur] à [ses] droits moraux ni à [ses] droits de propriété intellectuelle. Sauf entente contraire, (l'auteur] conserve la liberté de diffuser et de commercialiser ou non ce travail dont [il] possède un exemplaire.»
AVANT-PROPOS
Conformément aux exigences du programme de maîtrise en biologie, ce mémoire comprend un article rédigé en anglais, portant sur une étude visant à déterminer les facteurs environnementaux qui contrôlent la répartition nordique du bouleau jaune dans 1' est du Canada, ainsi qu'une introduction et une conclusion générale. Cet article a été soumis et approuvé à la revue scientifique « Canadian Journal of Forest Research ».
Je tiens à remercier Yves Bergeron qui a su tenir le cap dans ces longues années qui m'ont été nécessaires à terminer la rédaction de ce mémoire. Yves, ta persévérance a finalement porté fruit et je t'en suis très reconnaissant. Je souhaite dédier ce mémoire à Bernhard Denneler, qui a été mon codirecteur de maitrise durant les premières années de mes études de maîtrise. Il était non seulement un bon professeur pour moi, mais aussi un très bon ami. Je voudrais remercier également Igor Drobyshev, Hugo Asselin et Aurélie Gemies qui, par leur travail, ont rendu possible la rédaction et l'approbation de l'article scientifique. Et enfm, merci à la Chaire industrielle en aménagement forestier durable CRSNG-UQAT-UQAM pour le soutien fmancier.
Je voudrais spécialement remercier mon épouse Jennifer pour ta patience et ton soutien dans les derniers mois. Ce n'était pas facile avec deux petits enfants à la maison, mais nous avons réussi. Je l'ai enfin fini cette maîtrise-là!
TABLES DES MATIÈRES
AVANT-PROPOS ... II LISTE DES FIGURES ... V LISTE DES TABLEAUX ... VII RÉSUMÉ ... VIII CHAPITRE I
INTRODUCTION GÉNÉRALE ... 1
1.1. Problématique ... 1
1.2. État des connaissances ... 2
1.2.1. Caractéristiques de reproduction ... 2
1.2.2. Sols et substrat de germination ... 3
1.2.3. Compétition ... 4
1.2.4. Précipitations ... 5
1.2.5. Température ... 6
1.2.6. Perturbation ... 9
1.3. Objectifs de l'étude et hypothèses de travail.. ... 10
CHAPITRE II ENVIRONMENTAL CONTROLS OF THE NORTHERN DISTRIBUTION LIMIT OF YELLOW BIRCH IN EASTERN CANADA ... 12
2.1. Abstract. ... 14
2.2. Résun1é ... 15
2.3. Introduction ... 16
2.4. Material and Methods ... 20
2.4.1. Study area ... 20
2.4.2. Site selection and field sampling ... 21
2.4.3. Soil analyses ... 23
2.4.4. Statistical analysis of yellow birch regeneration ... 23
2.4.5. Dendrochronological analyses ofyellow birch growth ... 24
IV
2.5. Results ... 29
2.6. Discussion ... 44
2.6.1. Yellow birch regeneration and growth along a latitudinal gradient ... 45
2.6.2 Speculation on site-vs. domain-level effects on regeneration and growth ... 48 2. 7 Conclusion ... 51 2.8 Acknowledgements ... 52 2.9 References ... 53 CHAPITRE III CONCLUSION GÉNÉRALE ... 61
BIBLIOGRAPHIE POUR L'INTRODUCTION ET LA CONCLUSION GÉNÉRALE ... 69
LISTE DES FIGURES
Figure Page
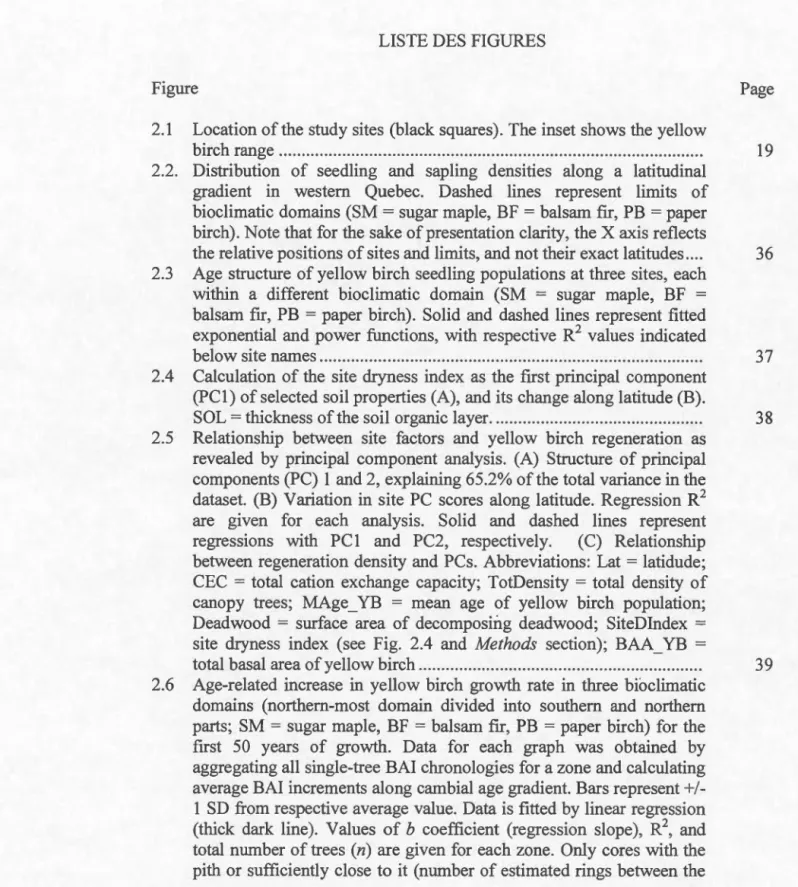
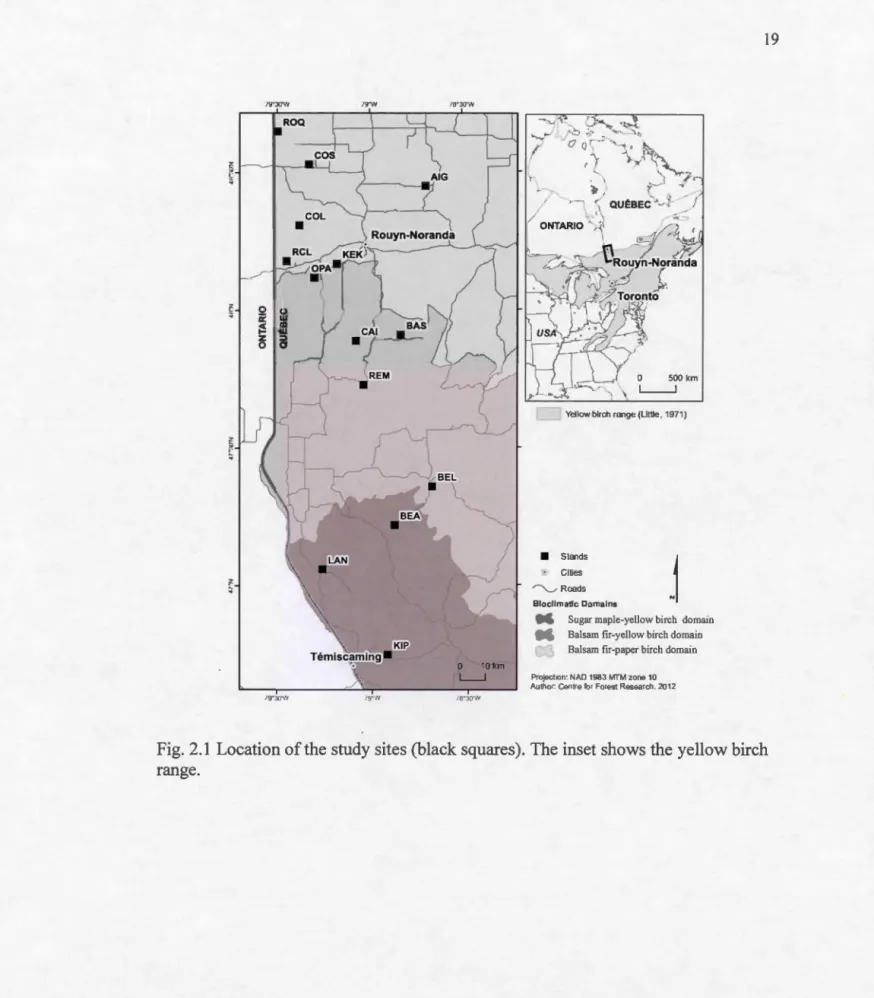
2.1 Location of the study sites (black squares). The inset shows the yellow
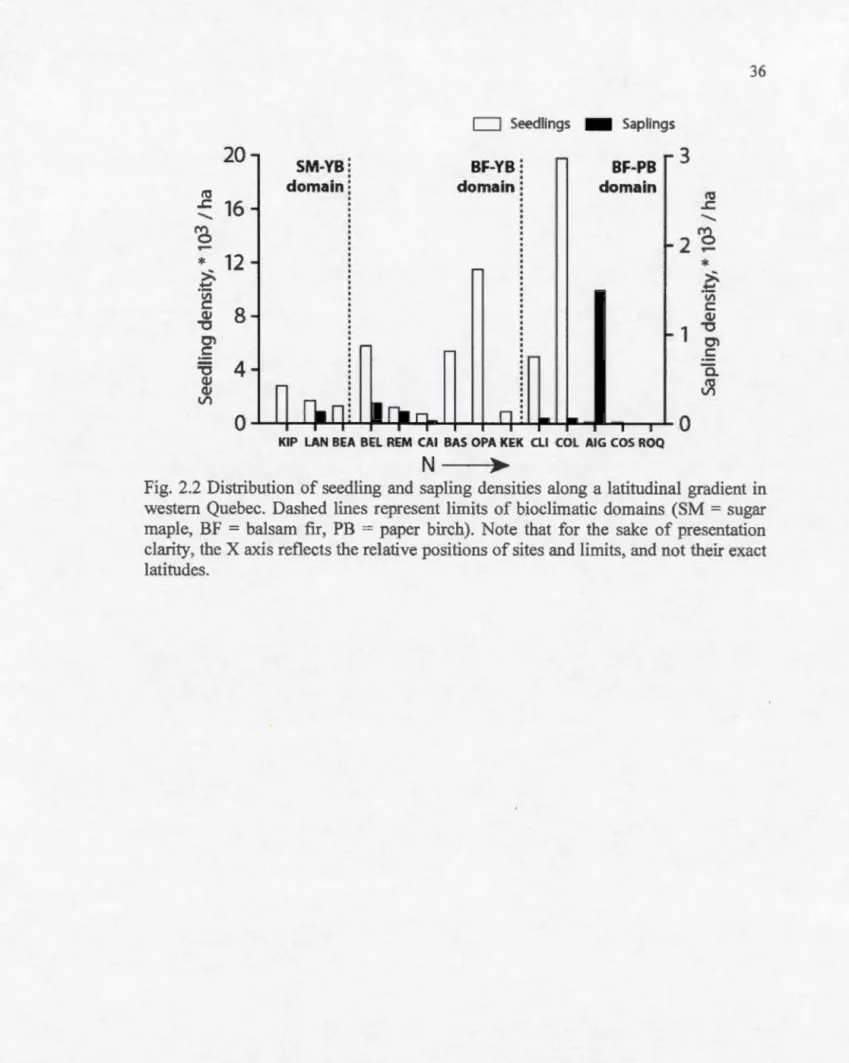
birch range . .. .. .. .. .. . .. .. .. .. .. . .. .. .. . .. .. . .. .. . .. . .. .. . .. .. .. .. . .. .. . .. .. .. .. . . .. .. . .. .. . . .. . .. . .. . .. 19 2.2. Distribution of seedling and sapling densities along a latitudinal
gradient in western Quebec. Dashed lines represent limits of bioclimatic domains (SM = sugar maple, BF = balsam fir, PB = paper birch). Note that for the sake of presentation clarity, the X axis reflects
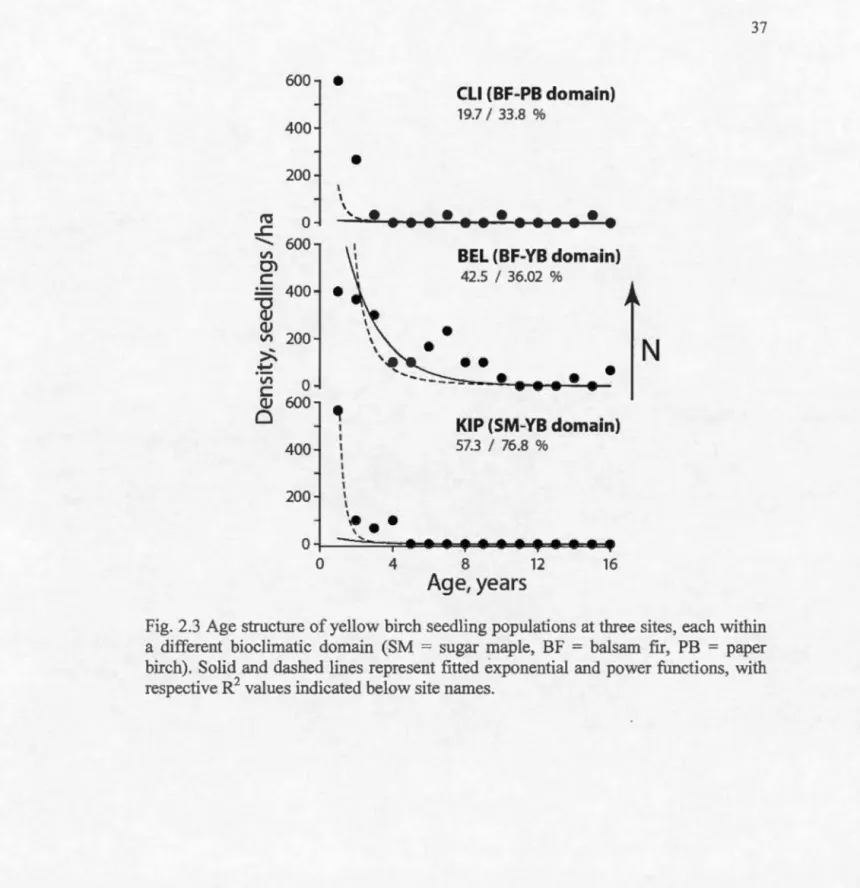
the relative positions of sites and limits, and not their exact latitudes.... 36 2.3 Age structure of yellow birch seedling populations at three sites, each
within a different bioclirnatic domain (SM = sugar maple, BF
=
balsam fir, PB= paper birch)
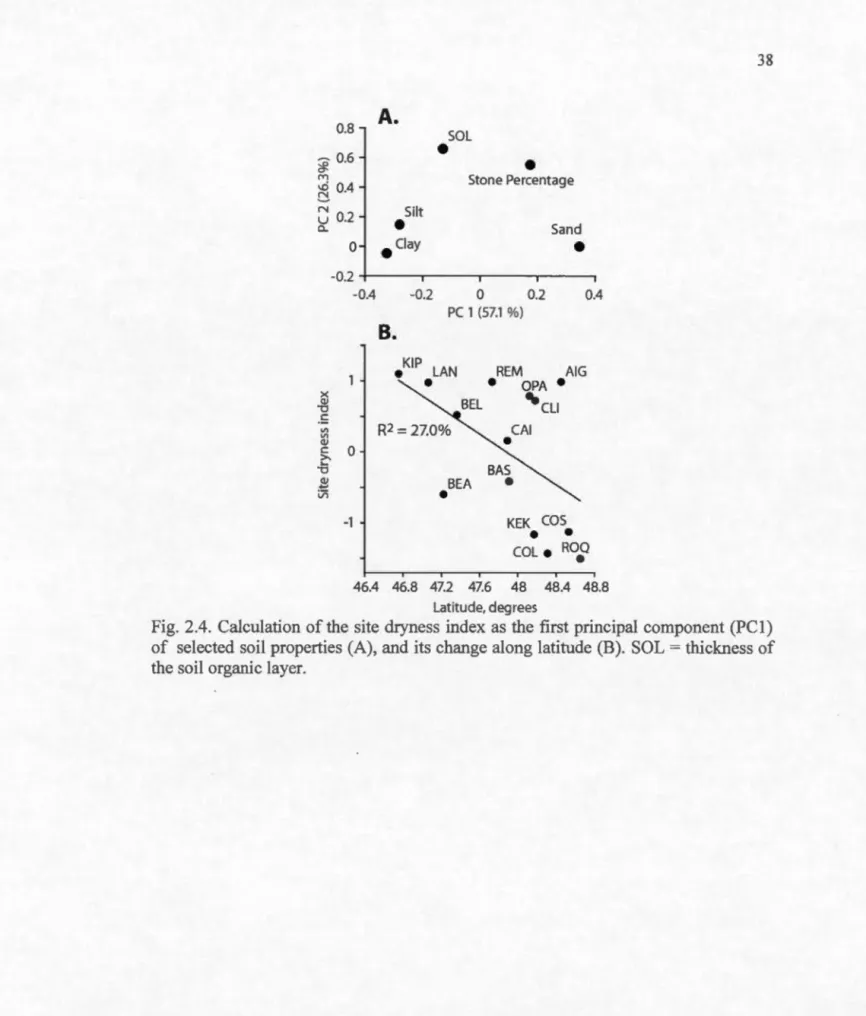
. Solid and dashed lines represent fitted exponential and power functions, with respective R2 values indicatedbelow site names ... 37 2.4 Calculation of the site dryness index as the first principal component
(PC 1) of selected soil properties (A), and its change along latitude (B).
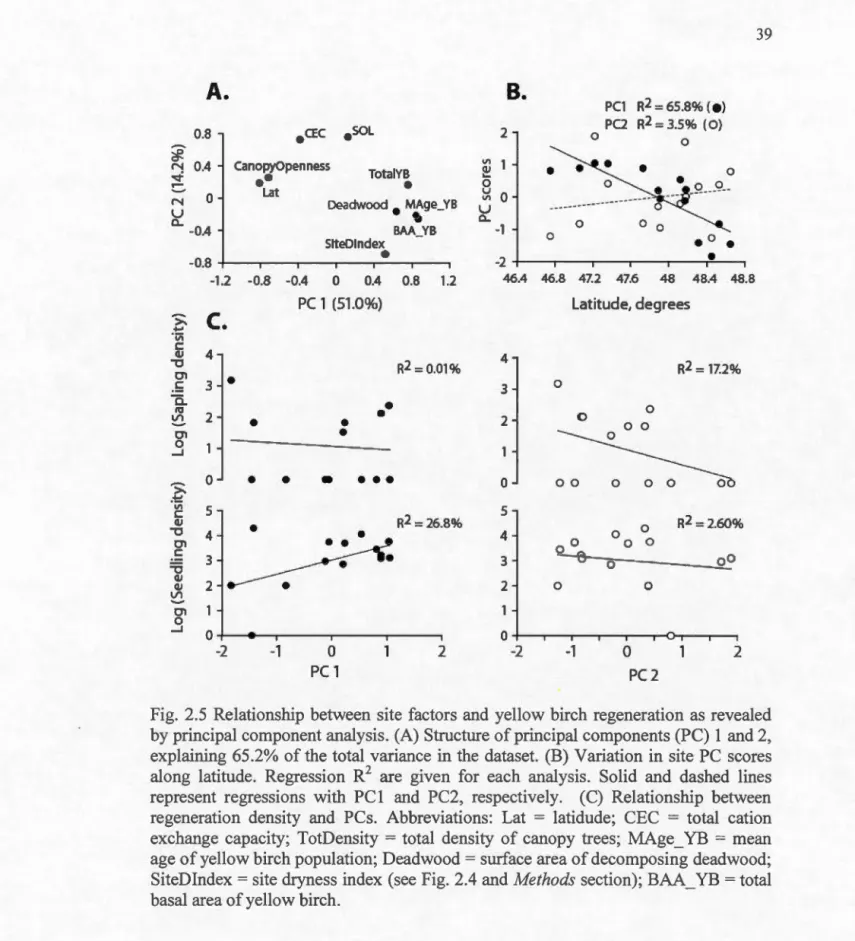
SOL= thickness of the soil organic layer... 38 2.5 Relationship between site factors and yellow birch regeneration as
revealed by principal component analysis. (A) Structure of principal components (PC) 1 and 2, explaining 65.2% of the total variance in the dataset. (B) Variation in site PC scores along latitude. Regression R2 are given for each analysis. Solid and dashed lines represent regressions with PCl and PC2, respectively. (C) Relationship between regeneration density and PCs. Abbreviations: Lat = latidude; CEC
= total
cation exchange capacity; TotDensity= total density
of canopy trees; MAge_ YB=
mean age of yellow birch population; Deadwood = surface area of decomposing deadwood; SiteDindex = site dryness index (see Fig. 2.4 and Methods section); BAA_ YB =total basal area of yellow birch .. .. .. .. .. .. .. .. .. .. .. .. .. .. .. .. .. .. .. .. .. .. .. .. .. .. .. .. .. .. .. . 3 9 2.6 Age-related increase in yellow birch growth rate in three bioclimatic
domains (northem-most domain divided into southem and northem parts; SM = sugar maple, BF = balsam fir, PB = paper birch) for the first 50 years of growth. Data for each graph was obtained by aggregating all single-tree BAI chronologies for a zone and calculating average BAI increments along cambial age gradient. Bars re present +/ -1 SD from respective average value. Data is fitted by linear regression (thick dark line). Values of b coefficient (regression slope), R2, and total number of trees (n) are given for each zone. Only cores with the pith or sufficiently close to it (number of estimated rings between the
VI
oldest measured ring and the pi th < 15 years) were used for this
analysis... 41 2. 7 Response function anal y sis of climate effects on yellow birch growth
in three bioclimatic domains (northem-most domain divided into southem and northem parts; SM = sugar maple, BF = balsam fir, PB = paper birch). DC, DDays, and GSL are average surnmer Monthly Drought Index, degree-days above 5°C, and length of the growing season, respectively. Snow refers to the total amount of solid precipitation for the period March through May. The prefix p indicates variables for the previous calendar year. Bars represent values of response coefficients and vertical lines a 95% confidence envelop around each coefficient. Significant (p < 0.05) response coefficients
are indicated by dark-grey color ... 42 2.8. Relationship between drought impact on yellow birch growth and
drought intensity in the northem part of the balsam fir - paper birch domain. The drought impact is expressed as response function coefficient between summer drought code (DC) and residual sub-regional chronology in 10-year moving periods over 1955-2003. A complete set of bioclimatic variables (see Fig. 7) was included in each
response function analysis. .... .... ... ... ... ... ... .... ... . . ... .. ... ... ... 43 2.9 Yellow birch growth response to drought along latitude. Response to
drought is represented by the b coefficient of the linear regression between DC ( drought code) and growth index. Shown are regressions between latitude and (A) raw b coefficients (R2 = 62.0%) , and (B) b coefficients adjusted for the differences in both soil conditions and age of yellow birch population (R2 = 6.3%). Labels in (A) indicate site codes and respective R2, in %, of the regression between DC and growth index. Black and white dots indicate non-significant and significant (p < 0.05) b coefficients, respectively. The vertical dashed line refers to the northem limit of yellow birch distribution in western
Quebec. ... 44 2.10 Long-term geographical distribution of the August drought code (DC)
values for an area in eastern Canada. Map was produced in BioSim software package (Regniere and Bol stad, 1994 ), using daily elima te
LISTE DES TABLEAUX
Tableau
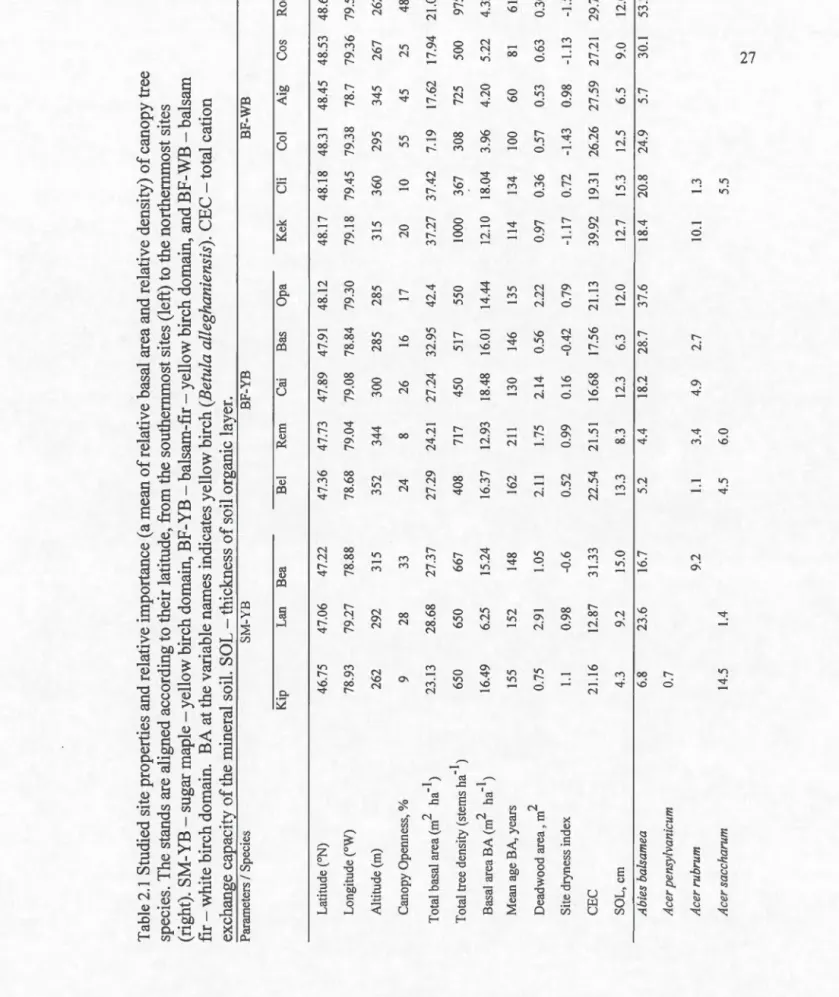
2.1 Studied site properties and relative importance (a mean of relative basal area and relative density) of canopy tree species. The stands are aligned according to their latitude, from the southernmost sites (left) to the northernmost sites (right). SM-YB - sugar maple - yellow birch domain, BF-YB - balsam-fir - yellow birch domain, and BF-WB -balsam fir - white birch domain. BA at the variable nan1es indicates yellow birch (Betula alleghaniensis). CEC - total cation exchange
Page
capacity of the mineral soil. SOL- thickness of soil organic layer... 27 2.2 Mean age of yellow birch trees (± standard deviation) in the sampled
stands and mean age of trees in surrounding stands within a 500 m radius from the centre of the san1pled stand. Data for surrounding stands are shown only for the balsam fu - paper birch bioclimatic domain. Fire year of the surrounding stands refers to fues observed at and around the sites since 1922, according to maps provided by the
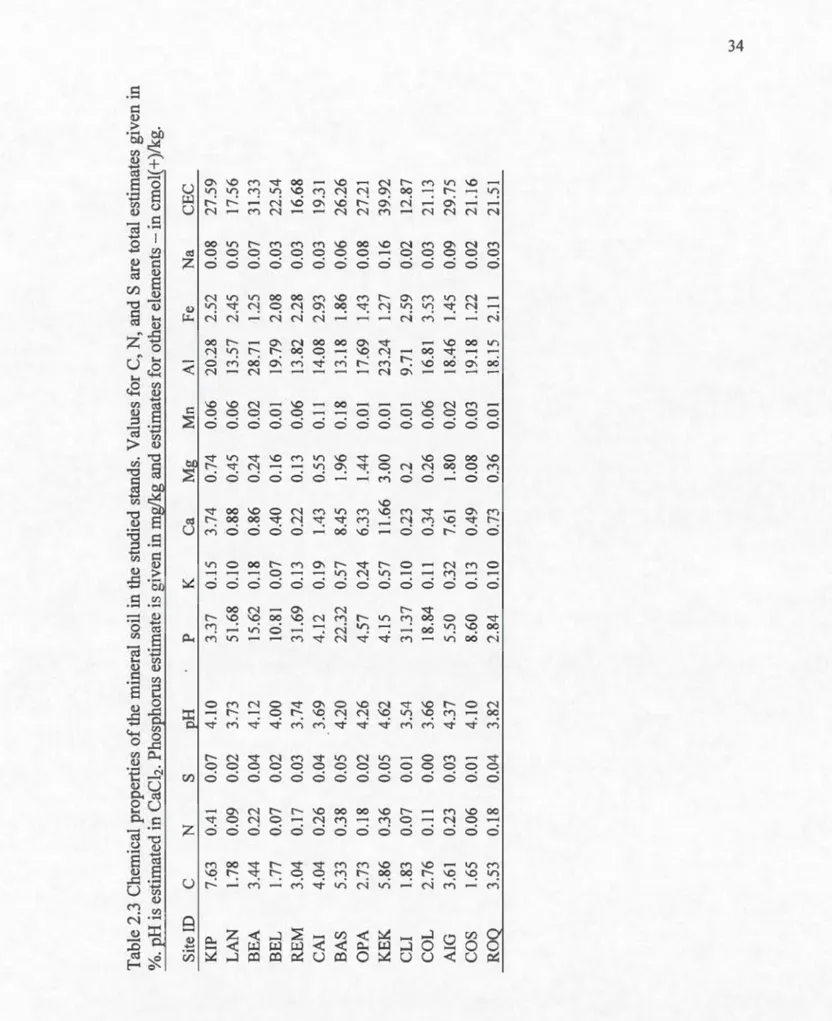
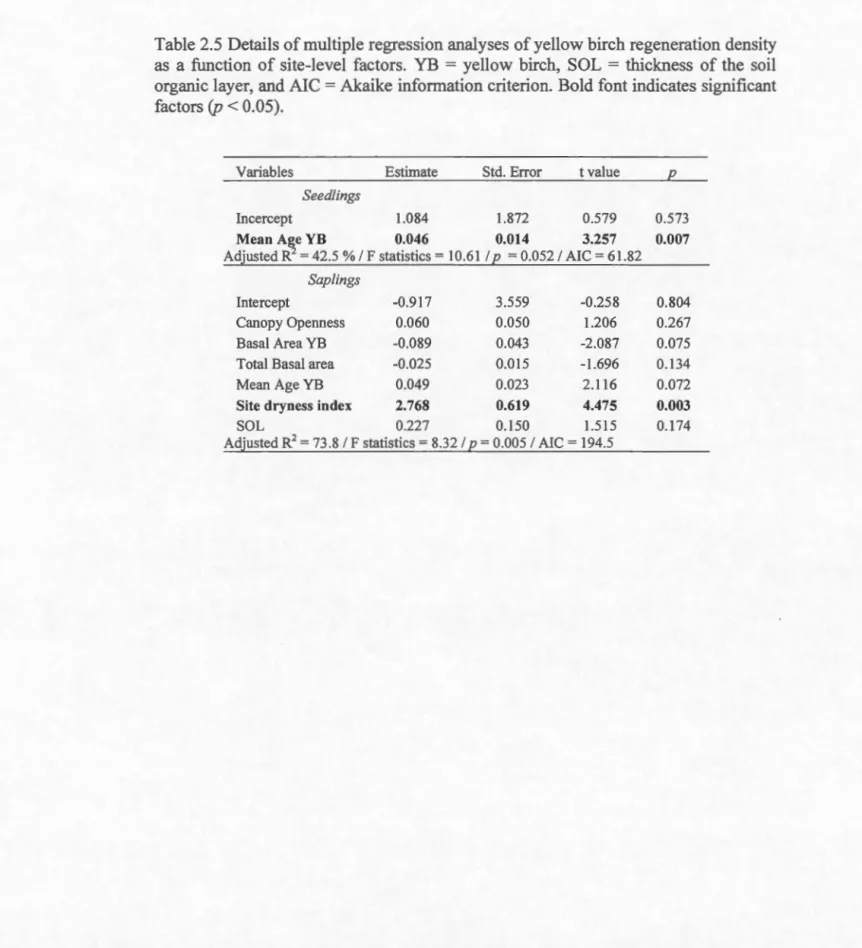
Quebec Ministry ofNatural Resources. ... 33 2.3 Details of multiple regression analyses of yellow birch regeneration
density as a function of site-level factors. YB
= yellow
birch, SOL=
thickness of the soil organic layer, and AIC = Akaike informationcriterion. Bold font indicates significant factors (p < 0.05). ... 34 2.4 Mean age of yellow birch trees (± standard deviation) in the sampled
stands and mean age of trees in surrounding stands within a 500 rn radius from the centre of the sampled stand. Data for surrounding stands are shown only for the balsam fu - paper birch bioclimatic domain. Fire year of the surrounding stands refers to fires observed at and around the sites since 1922, according to maps provided by the
Quebec Ministry ofNatural Resources.. ... 35 2.5 Details of multiple regression analyses of yellow birch regeneration
density as a function of site-level factors. YB = yellow birch, SOL = thickness of the soil organic layer, and AIC
=
Akaike informationRÉSUMÉ
La température et le régime hydrique semblent être les deux principaux facteurs qui influencent la distribution des plantes au niveau du globe. À 1 'est de 1 'Amérique du Nord, on observe une transition entre deux grandes zones de végétation, la forêt boréale et la forêt tempérée, qui serait principalement due à la différence de résistance aux températures minimales hivernales entre les espèces de ces deux zones. Au niveau des espèces individuelles, la correspondance exacte entre la limite de répartition nordique et les conditions climatiques limitantes peut être modifiée par l'interaction avec d'autres facteurs comme les régimes de perturbation, la disponibilité en habitats propices, la compétition ou une combinaison de ces facteurs. Le réchauffement climatique prévu pour le prochain siècle va probablement avoir un sérieux impact sur les conditions climatiques qui limitent la répartition nordique des espèces. Si nous voulons évaluer les conséquences de celui-ci sur la limite nordique d'une espèce, nous devons d'abord connaître les facteurs qui déterminent sa limite actuelle. Cette étude propose d'examiner trois facteurs potentiels qui pourraient déterminer ]a limite nordique du bouleau jaune (Betula alleghaniensis Britton) : la disponibilité d'habitats propices au-delà de la limite nordique actuelle, le climat limitant la survie et le climat limitant la reproduction sexuée. Ces trois facteurs ont été étudiés sur un gradient latitudinal entre 46° 45' et 48° 45' N à l'ouest du Québec. Une caractérisation de 1 'habitat, de ]a régénération et de Ja croissance radiale du bouleau jaune a été effectuée dans quatorze sites situés dans des peuplements de bouleau jaune.
Une grande variabilité dans l'abondance de régénération a été observée entre les différents peuplements dans toute l'aire d'étude. La densité des semis était corrélée. positivement à l'âge des bouleaux jaunes de la canopée et avec l'indice de sécheresse du sol. Aucune corrélation significative n'a été trouvée avec ]a latitude ou la températ4re, mais les sites les plus au nord avait une très faible densité de semis. Aucune diminution n'a été observée dans la croissance des arbres de la canopée sur le gradient sud-nord. Malgré l'absence de corrélation significative, certains résultats semblent indiquer que la régénération et non la survie et la croissance des individus matures est limitée par ]es conditions climatiques près de la limite de répartition du bouleau jaune. Une étude plus approfondie de la régénération dans les peuplements les plus nordiques serait nécessaire pour vérifier 1' effet limitant des températures froides sur la régénération.
Mots clés : limite nordique, régénération, crOissance, bouleau jaune, régin1e de perturbation changement climatique
CHAPITRE I
INTRODUCTION GÉNÉRALE
1.1. Problématique
Notre planète est présentement dans une période de réchauffement climatique. La température moyenne dans 1 'hémisphère nord lors du 20e siècle a probablement connu la plus grande augmentation pour un siècle durant le dernier millénaire (Houghton et al. 2001). Si l'on maintient la tendance actuelle d'émission de gaz à effet de serre, la température mondiale moyenne pourrait augmenter de 1.4 à 4.8°C entre 2005 et 2100 (Collins et al. 2013). Au Québec, les modèles climatiques projettent une augmentation médiane des températures de 5 à 9°C en hiver et de 2 à 3.5°C en été pour la fm du siècle (Logan et al. 2011). Les facteurs climatiques, tels que la température et le régime hydrique, contrôlent en grande partie la répartition et la croissance des différentes espèces de plantes au niveau du globe (Woodward 1987). Le réchauffement climatique pourrait affecter particulièrement la limite nordique des espèces, car les conditions limitantes liées aux températures froides vont probablement être repoussées vers les pôles. Les études paléoécologiques donnent plusieurs évidences de changement de répartition des espèces dans les régions tempérées de 1 'hémisphère nord suite à des changements climatiques à grande échelle durant l'Holocène et d'autres périodes plus anciennes (Larocque et al. 2000; Miller et al. 2008; Bradshaw et al. 201 0).
Le bouleau jaune est une espèce dont la limite nordique correspond env1ron à l'isotherme de températures armuelles moyennes de 2°C (Burns et Honkala 1990). C'est l'une des espèces feuillues avec la plus grande valeur économique dans l'est de l'Amérique du Nord (Burns et Honkala 1990). Le bouleau jaune est également une des espèces feuillues qui a un impact important sur la structure des peuplements
2
forestiers à la limite entre les biomes tempéré et boréal (Little 1971 ). Le réchauffement climatique actuel a le potentiel de faire migrer la limite de répartition du bouleau jaune vers le nord. Chez plusieurs espèces d'arbres des forêts tempérées, la résistance au froid hivernal semble être le facteur principal qui contrôle leur répartition nordique (Sakai et Weiser 1973; Woodward 1987; 1990; Arris et Eagleson 1989; Flannigan et Woodward 1994 ). La correspondance exacte entre la limite de répartition nordique et les conditions climatiques peut cependant être modifiée par l'interaction avec d'autres facteurs comme les régimes de perturbation, la disponibilité en habitats propices ou la compétition. (Sakai et Weiser 1973; Woodward 1987; Desponts et Payette 1992; Meilleur et al. 1997; Flannigan et Bergeron 1998; Tremblay et al, 2002; Graignic et al. 2014). Pour prédire l'impact qu'auront les changements climatiques sur le bouleau jaune à sa limite nordique actuelle, il est important de comprendre les facteurs climatiques et non climatiques limitants ces différents stades de vie. Dans cette étude, les facteurs qui ont le potentiel de modifier la limite nordique du bouleau jaune et les effets du climat sur la croissance et la reproduction du bouleau jaune près de sa limite nordique seront documentés.
1.2. État des connaissances
1.2.1. Caractéristiques de reproduction
Le bouleau jaune atteint sa maturité sexuelle à l'âge de 10 à 40 ans (Robitaille et Roberge 1981) et 1' âge de 70 ans est considéré comme optimal pour la production de graines (Erdmann 1990). Les bonnes années de graines ont lieu habituellement à des intervalles de 2 à 3 ans, mais la fréquence des bom1es ou très bonnes années varie dans le temps et selon les régions (Burton et al. 1969; Godman et Mattson 1976; Solomon et Leak 2002). Le bouleau jaune peut produire entre 2.5 et 12.4 millions de graines par hectare dans les botmes années de production et jusqu'à 89 millions par
3
hectare dans une année d'excellente production (Gilbert 1965; Gross et Ham den 1968). Au Canada, la majeure partie des graines tombent avec le temps froid du mois d'octobre (Burton et al. 1969). Les graines sont dispersées par le vent et peuvent être
transportées jusqu'à 400m sur de la neige glacée (Burton et al. 1969). Les graines de
bouleau jaune qui atteignent le sol peuvent germer l'année suivant leur production ou
être incorporées dans la banque de graines (Houle 1992). Leur période de viabilité
d'environ 2 ans est relativement courte (Houle 1992). Les peuplements de bouleaux
jaunes semblent en grande partie dépendants de la production de graines viables pour leur maintien à long terme, car la reproduction végétative n'est pas fréquente comme
chez d'autres espèces feuillues (Tremblay et al. 2002). Les semis et les gaules de
bouleau jaune se reproduisent par rejets de souche lorsqu'ils sont coupés, mais les plus grosses tiges n'en produisent que très peu (Solomon et Blum 1967; Perala 1974).
1.2.2. Sols et substrat de germination
Le bouleau jaune croît sur une grande variété de sols. Au Michigan et au Wisconsin, il est retrouvé sur des tills glaciaires, des sables délavés, des dépôts lacustres, des dépôts de loess minces et des sols résiduels dérivés de grès, de calcaire, et de roches métamorphiques et ignées (Post et al. 1969). La croissance du bouleau jaune est affectée par la fertilité et la texture du sol, le drainage, la profondeur d'enracinement,
l'élévation et l'exposition de la pente (Erdmann 1990). Le bouleau jaune atteint sa
croissance optimale sur les loams fertiles bien drainés et les loams sableux avec un
drainage moyen dans les ordres podzolique et régosolique et sur des terrains plats ou de pentes faibles (Gilbert 1965).
Les jeunes semis de bouleau jaune sont par contre très dépendants des conditions du lit de germination pour leur survie (Winget et Kozlowski 1965). Le lit de germination idéal semble être un sol possédant une bonne humidité où le sol minéral est mélangé
4
Perala et Alm 1990). Cependant dans les peuplements fermés, une grande majorité
des semis se développent sur les petits monticules et les troncs en décomposition
(Winget et Kozlowski 1965). Cette préférence serait due à la grande quantité
d'éléments nutritifs dans ces microsites et à la mince couche de litière (Ruel et al.
1988). Les jeunes semis meurent rapidement lorsqu'ils se développent sur une litière épaisse comme celles des feuilles d'érable, car leurs radicules ne peuvent la traverser (Burton et al. 1969).
1.2.3. Compétition
Pour survivre et croitre jusqu'à la canopée, les bouleaux jaunes juvéniles ont besoin
de suffisamment de lumière. L'intensité de lumière pour leur croissance optimale s'élève à environ 45% du plein soleil (Logan 1965; Tubbs 1969; Houle et Payette 1990). Leur survie et leur croissance à long terme sont menacées à moins de 10% de
la lumière totale (Kobe et al. 1995). Kobe et al. (1995) ont observé que la mortalité
juvénile du bouleau jaune diminue très rapidement avec l'augmentation de l'intensité
lumineuse et que cette mortalité est minimale dès que 1' intensité lumineuse atteint 15
% de la lumière totale. Le bouleau jaw1e est généralement considéré comme
intermédiaire dans sa tolérance à l'ombre et son habileté compétitive (Baker 1949;.
Forcier 1975; Kobe et al. 1995). Il est plus tolérant à l'ombre que les autres espèces
de bouleaux indigènes comme le bouleau blanc (Betula papyrifera Marsh), mais
moins que plusieurs espèces qui lui sont généralement associées comme l'érable à sucre (Acer saccharum Marsh), le hêtre à grandes feuilles (Fagus grandifolia Ehrh.)
et la pruche (Tsuga canadensis (L.) Carr.) (Gilbert 1965). Dans les forêts mixtes
situées dans le sud du Québec, la présence d'espèce comme l'érable à sucre et le hêtre qui sont capables d'intercepter la lumière efficacement limite la régénération du
bouleau jaune aux sols perturbés et aux trouées (Winget et Kozlowski 1965).
5
moins abondants ou absents ce qui d01me une canopée relativement plus ouverte et
une communauté de semis plus ubiquiste (Bouchard et al. 2005). Au Témiscamingue,
situé dans la partie sud de notre aire d'étude, Bouchard et al. (2005) ont observé dans
une forêt non perturbée que même si la densité de gaules de bouleau jaune est
relativement faible (59 tiges/ha), les arbres matures peuvent persister plus de 200 ans
dans la canopée et que l'accession occasionnelle de gaules à la canopée serait
suffisante pour maintenir la population.
1.2.4. Précipitations
Pendant les premières années, les semis de bouleau jaune sont très vulnérables à la
sécheresse (Linteau 1948). L'humidité du lit de germination pourrait être plus
importante pour la croissance et la survie des jeunes semis que la disponibilité de
lumière (Burton et al. 1969). Au niveau historique, Jackson et Booth (2002) ont
étudié le rôle de la variabilité climatique de la fin de l'Holocène dans l'expansion du
bouleau jaune dans la région à 1' ouest des Grands Lacs. Ils suggèrent que 1' expansion
du bouleau jaune durant cette période pourrait être liée à une augmentation des
précipitations qui aurait amélioré le taux de survie des semis du bouleau jaune. Les
semis de bouleaux jaunes de deux à trois ans étant très sensibles à des périodes de
sécheresse (Goodman et Krefting 1960; Hatcher 1966; Houle 1994).
Il a été démontré que le manque de précipitations a un effet important sur la variation
de la croissance d'un arbre (Fritts 1976). Durant un été sec, l'eau peut être assez
déficiente pour limiter la division cellulaire et les processus d'élargissement des
cellules (Fritts 1976). Cependant, les précipitations sont habituellement plus
contraignantes à la survie d'une espèce dans les régions arides qui correspondent
souvent dans l'hémisphère nord à la limite sud des espèces (Woodhouse et Meko
6
Les quantités de précipitations brutes peuvent ne pas refléter adéquatement la quantité d'eau qui est réellement accessible aux arbres. L'indice de sécheresse utilisé entre autres pour la prédiction du risque des feux de forêt au Canada est un indice qui prend en compte les températures, le temps de l'année, la latitude et l'accumulation des précipitations sur une longue période. Il permet d'estimer le contenu en eau retenu par la couche d'humus du sol forestier (Turner 1972). Cet indice peut donc être un bon indicateur de la disponibilité en eau pour les arbres.
1.2.5. Température
Puisque cette étude porte sur la limite nordique du bouleau jaune, nous examinerons en particulier les effets potentiels des températures froides sur le cycle de vie de du bouleau jaune.
En premier lieu, les températures froides ont le potentiel de limiter la production de graines viables. Ceci peut être expliqué en partie par la résistance au froid relativement faible des bourgeons floraux par rapport aux bourgeons végétatifs chez plusieurs espèces (Sakai et Weiser 1973). La viabilité des graines semble être affectée par les conditions météorologiques durant la pollinisation, la fertilisation et le développement des graines (Erdmann 1990). La distribution du tilleul à petites feuilles (Tilia cordata Mill.), par exemple, est liée à la sensibilité au froid de son tube pollinique (Pigott et Huntley 1980; 1981 ). Tremblay et al. (2002) ont également démontré 1 'effet de la latitude et des conditions climatiques, notamment des gelées printanières, sur la production de san1ares des populations nordiques d'érable rouge. Les gelées sévères qui se produisant durant la floraison diminuent significativement le nombre de san1ares viables (Tremblay et al. 2002). Chez le bouleau jaune, une étude sur la production de graines sur un gradient d'altitude dans le New Hampshire a montré une diminution de la production de graines avec l'augmentation de l'altitude qui est probablement liée à la diminution des températures (O'Donoghue 2004).
- - - -- -- -
-7
Les températures froides peuvent aussi limiter la croissance des arbres de plusieurs
façons. Premièrement, la température du can1bium qui est relié directement à celle de l'air peut être directement un facteur limitant par son contrôle de la respiration et des processus d'assimilation (Fritts 1976). Les effets directs de la température sur la croissance radiale sont plus souvent observés au début de la saison de croissance
lorsque des températures anorn1alement froides peuvent causer un délai dans le lever de la dormance (Fritts 1976). La saison de croissance écourtée qui en résulte favorisera un cerne plus étroit. Une fois la période de croissance débutée, toute
période de températures très froides près de 0°C peut limiter la croissance, mais au fur et à mesure que les températures augmentent d'autres facteurs comme les précipitations deviennent normalement plus limitants (Fritts 1976). À de hautes latitudes ou altitudes où la saison de croissance potentielle est courte et la température des plantes peut-être basse alors que le cambium est encore actif, la croissance radiale peut être grandement réduite à n'importe quel moment durant la saison de croissance
(Fritts 1976). À l'exception de ces sites extrêmement froids, l'activité cambiale à la fin de l'été peut cesser à cause de conditions internes bien avant que les températures
soient assez froides pour limiter les processus d'assimilation et de division cellulaire (Fritts 1976). Cet effet des températures froides sur l'activité cambiale semble être
une des principales causes de l'écotone entre la forêt boréale et la toundra (Grace et
al. 2002) mais n'est habituellement pas associé à la limite entre la forêt boréale et
tempérée.
La température peut aussi affecter indirectement la cro1ssance d'un arbre en lui
causant des blessures par le gel. Le niveau de tolérance au gel est sujet à un cycle
périodique durant 1 'année (Sakai 1970). Les arbres des forêts tempérées et boréales
ont une résistance maximum au gel pendant l'hiver et minimum pendant l'été (Sakai
1970). Cette résistance est acquise par un processus graduel d'endurcissement au froid à l'automne et est perdue par le processus inverse au printemps (Calmé et al. 1994). Ainsi, les blessures causées par le froid peuvent se produire sous des
8
conditions climatiques différentes selon le temps de 1' année, comme les gelées
tardives au printemps et hâtives à l'automne ou des froids sévères à l'automne, à
l'hiver et au printemps (Sakai 1970; Sakai et Weiser 1973; Calmé et al. 1994). Si les
températures durant la saison de croissance descendent suffisarnn1ent pour geler le
tissu cambial, celui-ci peut-être endommagé, ce qui affectera grandement l'anatomie
et la croissance subséquente de l'anneau (Fritts 1976). Les températures hivernales
peuvent aussi avoir tm impact sur la croissance des arbres. Certaines études montrent
une relation positive entre les températures hivemales et la croissance radiale de l'été
suivant chez certaines espèces (Tardif et al. 2001; Pederson et al. 2004). Pederson et
al (2004) ont supposé que cette relation pouvait être contrôlée par une augmentation
des blessures aux racines avec une diminution de la température. Les températures
hivernales froides peuvent aussi causer une embolie dans les cellules du xylème lors
du dégel au printemps ce qui force 1' arbre à produire de nouveaux tissus pour le
transport de 1' eau (Sperry et al. 1994; Pederson et al. 2004 ). Pour remplacer ces tissus
endommagés, l'arbre utilise de l'énergie qu'il aurait pu utiliser pour la
croissance.Plusieurs études ont démontré que la plupart des espèces qui composent
les forêts décidues tempérées du nord-est de l'Amérique du Nord affichent une
tolérance au gel dans les cellules de parenchymes du xylème de leurs tiges qui varient
entre -41 °C et -47 °C (George et al. 1974; Ishikawa et Sakai 1982; Gusta et al.
1983). Cette température est moins élevée que chez la plupart des espèces de feuillus
présentes en forêt boréale comme le bouleau blanc et le tremble. Plusieurs auteurs
suggèrent donc que c'est la différence de résistance aux températures froides
hivemales entre les espèces tempérées et boréales qui pourrait expliquer la transition
entre ces deux types de végétations dans l'est de l'Amérique du Nord (George et al.
1974; Marchand 1987; Arris et Eagleson 1989). Pour le bouleau jaune, George et al.
(1974) ont déterminé expérimentalement cette tolérance au gel à environ -44 °C, mais
9
À l'extrême les blessures aux tissus causées par le gel peuvent aller jusqu'à causer la mort des individus (Sakai et Weiser 1973; Calmé et al. 1994). Il est généralement reconnu que les semis ont une tolérance au froid moins grande que les arbres matures (Sakai et Larcher 1987; Hoffman et al. 2014). Les semis de bouleau jaune semblent toutefois avoir une relativement bonne tolérance au froid quand on les compare à d'autres espèces d'arbres des forêts tempérées de l'est de l'Amérique du Nord comme l'érable à sucre et le chêne rouge (Calmé et al. 1994). Calmé et al. 1994 ont enregistré un taux de 100% de survie des jeunes semis de bouleau jaune comparé à 50 % de survie pour les semis d'érable à sucre lors d'un hiver où les températures minimales ont atteint -33°C. C'est la tolérance au froid des racines du bouleau jaune qui semble plus limitante car l'on a enregistré une mortalité d'environ 2/3 de la masse racinaire chez des semis à racine nue exposés à des températures de -33oC pendant 1 heure (Calmé et al. 1994). Les arbres matures peuvent aussi être tués par le froid (Hoffman et al. 2014). Par exemple, on a attribué le rétrécissement de l'aire de répartition du mélèze laricin (Larix laricina) dans le nord du Canada durant une période de refroidissement climatique des années 60 et 70 à une mortalité sévère des individus matures (Payette et Lajeunesse 1980)
1.2.6. Perturbation
Chez certaines espèces, la correspondance exacte entre la limite de répartition nordique et les conditions climatiques peut être modifiée par 1' interaction avec les régimes de perturbation par le feu. Par exemple, la répartition nordique du pin rouge (Pinus resinosa) ne semble pas être déterminée directement par le climat, mais plutôt par le régime de feu (Flannigan et Bergeron 1998). À sa limite nordique, celui-ci est restreint à certaines îles et aux rives des lacs à cause de la protection que ce type d'habitat offre contre les grands feux intenses qui surviennent sur le reste du territoire (Bergeron et Brisson 1990).
10
Les semis et gaules de bouleau jaune sont tués par les feux de faible intensité
(Erdmann 1990). Les arbres matures de bouleau jaune peuvent potentiellement
survivre à des feux de faible ou moyenne intensité (Martin 1959; Perala 1987), mais sont probablement vulnérables à des feux de plus forte intensité en raison de la faible épaisseur de 1' écorce (Erdmann 1990)
1.3. Objectifs de l'étude et hypothèses de travail
L'objectif général de ce projet de recherche est de documenter les facteurs qm
pourraient limiter la répartition nordique du bouleau jaune. Cet objectif peut être subdivisé en deux sous objectifs :
• Évaluer les relations entre les facteurs climatiques (température, précipitation, indice de sécheresse, nombre de degrés-jours de croissance au-dessus de 5 °C)
et le taux d'accunmlation de biomasse du bouleau jaune le long d'un gradient
latitudinal entre 46° 45' et 48° 45' N dans l'ouest du Québec.;
• Évaluer les changements dans la dynan1ique de reproduction du bouleau jaune
en relation avec la latitude sur un gradient latitudinal allant de 46° 45' et 48°
45' N dans l'ouest du Québec.
Nous proposons deux hypothèses concernant les facteurs potentiels du contrôle de la
distribution nordique du bouleau jaune. Notre première hypothèse est que la
croissance du bouleau jaune est de plus en plus contrôlée par les températures froides vers le nord. Les températures hivernales froides peuvent causer des blessures par le
gel aux tissus de l'arbre et potentiellement affecter négativement l'accumulation de biomasse et ultimement la mort de celui-ci (Tardif et al. 2001; Pederson et al. 2004). Notre deuxième hypothèse est que le succès reproducteur du bouleau jaune diminue
avec la latitude, car il est de plus en plus limité par les conditions climatiques près de
Il
grames viables et un faible succès d'établissement des jeunes semis de première année en raison des gelées tardives plus fréquentes au printemps et à l'été. Le succès de la régénération du bouleau jaune pourrait aussi être affecté par les températures froides hivernales causant une mortalité accrue des jeunes semis vers le nord en raison de leur moins grande tolérance au froid comparé aux arbres plus âgés.
CHAPITRE II
ENVIRONMENTAL CONTROLS OF THE NORTHERN DISTRIBUTION LIMIT OF
-*Published in Canadian Journal of Forest Research. 2014. 44(7): 720-731.
Environmental con trois of the northern distribution limit of yellow birch in
Eastern Canada
13
Igor Drobyshev1,2*#, Marc-Antoine Guitard3#, Hugo Asselin1, Aurélie Genries1 &
Yves Bergeron 1
1. Chaire industrielle CRSNG-UQAT-UQAM en aménagement forestier durable, Université du Québec en Abitibi-Témiscamingue (UQAT), 445 boul. de
l'Université, Rouyn-Noranda, Québec, J9X 5E4, Canada
I.D. lgor.Drobyshev@uqat.ca 1 H.A. Hugo.Asselin@uqat.ca 1
A.G. Aurelie.Genries@univ-montp2.fr 1 Y.B. Yves.Bergeron@uqat.ca
2. Southem Swedish Forest Research Centre, Swedish University of Agricultural
Sciences, P.O. Box 49, 230 53 Alnarp Sweden, lgor.Drobyshev@slu.se
3. Ministry of Environrnent, Bathurst Regional Office, New Brunswick, Canada
Marc-Antoine. Gui tard@gnb .ca
*
Igor Drobyshev is the corresponding author:Chaire industrielle CRSNG-UQAT-UQAM en aménagement forestier durable
Université du Québec en Abitibi-Témiscarningue (UQAT)
445 boul. de l'Université, Rouyn-Noranda, Québec J9X 5E4, Canada
lgor.Drobyshev@uqat.ca 1 lgor.Drobyshev@slu.se
phone +1 819 762 0971 ext. 2057 Il fax +1 (819) 948 2055
# contribution of the 2 first authors are equivalent
14
2.1. Abstract
To evaluate environmental controls of yellow birch (Betula alleghaniensis Britton)
distribution at its northern distribution limit in eastern Canada, we analysed abundance, age structure, biomass accumulation rate, and growth sensitivity to climate of this species at 14 sites along a 200-km latitudinal gradient spanning tlu·ee bioclimatic domains and reaching frontier populations of this species in western
Quebec. We observed a large variability in seedling density across domains and presence of sites with abundant yellow birch regeneration within all three bioclimatic domains. Seedling density was positively correlated to the mean age and the abundance of yellow birch trees in the canopy, while sapling density was positively associated with dryer habitats. Growth patterns of canopy trees showed no effect of declining temperatures along the south-north gradient. Environmental controls of birch distribution at its northern limit were realized through factors affecting birch regeneration and not growth of canopy trees. At the stand scale, regeneration density
was strongly controlled by local site conditions, and not by differences in climate
among sites. At the regional scale, climate variability could be an indirect driver of
yellow birch distribution, affecting disturbance rates and, subsequently, availability of
15
2.2. Résumé
Afin d'évaluer les facteurs environnementaux contrôlant la distribution du bouleau
jaune (Betula alleghaniensis Britton) à sa limite nord de distribution dans l'est du
Canada, nous avons analysé l'abondance, la structure d'âge, le taux d'accumulation
de biomasse et la sensibilité de la croissance au climat de cette espèce, dans 14 sites
répartis le long d'un gradient latitudinal de 200 km, ce dernier couvrant trois
domaines bioclimatiques et atteignant les populations les plus à l'ouest du Québec.
Nous avons observé une grande variabilité au niveau de la densité de plantules entre
les domaines, ainsi que la présence de sites avec une régénération abondante du
bouleau jaune dans chaque domaine bioclimatique. La densité de plantules était
corrélée positivement à l'âge moyen et à l'abondance des bouleaux jaunes mâtures
dans la canopée, alors que la densité de gaulis était positivement associée aux habitats
plus secs. Les patrons de croissance des arbres mâtures n'ont pas montré d'effet
négatif de la température le long du gradient sud-nord. Les facteurs contrôlant la
distribution du bouleau à sa limite nord comprenaient des facteurs affectant la
régénération du bouleau, mais pas la croissance des arbres mâtures. À l'échelle du
peuplement, la densité de régénération était fortement contrôlée par les conditions
locales de site, et non par les différences climatiques entre les sites. À l'échelle
régionale, la variabilité climatique pourrait indirectement contrôler la distribution du
bouleau jaune en affectant la fréquence des perturbations et, conséquemment, la
16
2.3. Introduction
Future climatic variability will likely affect growth and distribution of tree species along various environmental gradients. Paleoecological studies provide abundant evidence of shi:fts in species distributions in temperate and boreal regions of the northern hemisphere as a result of large-scale climate changes over the Holocene and earlier periods (Larocque et al. 2000, Miller et al. 2008, Bradshaw et al. 2010). Climate change might affect the geographical position of biomes as weil as single tree species, especially at mid and high latitudes (Prentice et al. 1992, Harrison et al. 1995).
The effects of climatic conditions on tree growth vary across species' distribution limits. For example, in the Northern Hemisphere, the role of temperature is o:ften considered to increase towards colder parts of species' ranges usually corresponding to higher latitudes or elevations (Gedalof and Smith 2001, Wang et al. 2002, Pederson et al. 2004), whereas precipitation constrains tree growth in arid regions, corresponding to species' southern distribution limits (Woodhouse and Meko 1997, Crernaschi et al. 2006). However, other patterns are also common, e.g., with temperature control of growth being detected only at northern distribution limits (Cook et al. 1998, Tardif et al., 2001 ), across who le distribution ranges (Cook and Cole 1991, D'Arrigo et al. 2004), or being mediated by site conditions (Drobyshev et al. 201 0). Such large variability in the factors controlling geographical distributions calls for species-specific analyses that will yield more accurate data to model potential species' responses to future climate (Kirilenko et al. 2000, !verson et al. 2008, Prasad et al. 2013) ..
In eastern Canada, mean temperature and total precipitation are projected to increase by the mid-21 51 century (Elia and Côté 201 0). Winters are expected to become warmer and wetter, while summers are projected to become drier than today. We
17
might therefore expect that such changes will give room for northward expansion of deciduous species and cause a retreat of coniferous species to higher latitudes. Much of the recent research, both in North American and Eurasian biomes, has focused on direct negative effect of climate change on coniferous species (Bergh et al. 1998,
Asse lin and Payette 2005, Driscoll et al. 2005, Carnicer et al. 2011, Houle et al.
2012). Empirical studies quantifying the response of deciduous, and especially,
hardwood species are lirnited, although they are consistent in their prediction of northward expansion of these species under expected climate change (Goldblum and
Rigg 2005, McKenney et al. 2011).
This study is an attempt to fill this knowledge gap by evaluating current and potential
effects of climatic variability on the growth and distribution of yellow birch (Betula
alleghaniensis Britton). Besides its high economie value (Erdman 1990, Houle 1998),
this tree is an important component of three forest cover types common in Eastern
North America, namely the Hemlock- Yellow Birch, Sugar Maple-Beech-Yellow Birch, and Red Spruce-Yellow Birch cover types (Erdmann 1990). Yellow birch typically grows on well-drained soils up to 49.5° N and, from a biogeographical perspective, represents one of the most northerly distributed hardwoods with
significant contribution to the forest structure at the border between temperate and boreal biomes (Little 1971 ). In western Que bec, yellow birch is present in the canopy of both temperate deciduous and mixed forests, extending its range to the north into the boreal balsam fir (Abies balsamea (L.) Mill.) - paper birch (Betula papyrifera
Marsh.) bioclimatic domain. Its abundance has been reported to decline at the regional leve! due to an increase in the proportion of shade-tolerant species (primarily
Acer spp.) during the 20th century (Woods 2000, Nolet et al. 2001). Yellow birch is considered a semi-shade tolerant species (Baker 1949, Kobe et al. 1995), severa!
studies suggesting 45% light intensity as optimum conditions for growth of
undercanopy trees (Erdmann 1990, Houle and Payette 1990, Perala and Alm 1990,
18
In this study we aimed to provide baseline information on the possible effect of
climate on performance of yellow birch populations at the species' northern
distribution limit. Previous research indicated that wind (Lorimer 1977, Kneeshaw
and Prevost 2007, Gasser et al. 201 0) and insect ou breaks (Bouchard et al. 2006) can
cause the formation of canopy gaps providing recruitment opportunities for yellow
birch. These studies focused on the central part of the species' range in Eastern North
America. In contrast to these works, we specifically focused on marginal populations
of yellow birch, whose dynamics could be driven by factors different from those
controlling the species' a bun dance in the centre of its range. We therefore elected to analyze a reasonably wide range of factors possibly controlling yellow birch abundance and evaluated regeneration and growth patterns along gradients of
environmental conditions. Particularly, we used field surveys to study the abundance
and age structure of birch regeneration, and a range of dendrochronological methods
to analyze biomass accumulation rate and growth sensitivity to clirnate along a 200
km latitudinal gradient in western Quebec, Canada (Fig. 2.1). We tested the following
hypotheses: (1) the northem distribution lirnit of yellow birch is controlled by
regeneration failure and prohibitively low biomass accumulation rates due to low
temperatures, and (2) growth sensitivity to temperature increases with latitude,
reflecting an increasingly colder climate towards the north. Finally, we discuss our results in the context of direct and indirect climatic effects ( e.g., changes in the forest
/9'W /8"J<YW /9~V ts•w /fM[)'\ V 0 500 km L___j :f..· Cities
J
• Stands ~Roods Blocllmattc Do mainsM Sugar maple-yellow birch domain Balsam fir-yellow birch domain c:::3 Balsam fir-paper birch domain ProjectiOn' NAD 1983 MTM zone 10 Author: Centre for Forest Research. 2012
19
Fig. 2.1 Location of the study sites (black squares). The inset shows the yellow birch
20
2.4. Material and Methods
2.4.1. Study area
The study was carried out at the border between Quebec and Ontario (Canada),
encompassing the area between 46° 45' N and 48° 45' N and between 78° 00' W and
79° 30' W (Fig. 2.1). The continental climate of the area is characterized by cold
winters and warm summers. Cold arctic air masses dominate the area during winter
and dry tropical air masses tend to take over during surnmer. Average annual
temperature varies between 3.1° C (site KIP) and 1.0° C (site ROQ). January is the
coldest month with the average minimum temperature ranging between -14.9° C (site
KIP) and -19.2° C (site ROQ). July is the warmest month with little variation in
average maximum temperatures across sites (20.0° C at site KIP and 19.1 o C at site
ROQ). However, length of the growing season, i.e., the period with temperatures
above 5° C, reveals large variability across the study area: 167 days at site KIP and on
average 140 days at the three northernmost sites. This corresponds to a change in
growing degree days (GDD) between 1352 and 1135. Total annual precipitation
reaches its maximum value at site BEL (770 mm) and its lowest value at site OPA
(683 mm). On average, about 32% of precipitation falls during the surnmer months.
The topography of the area is mostly flat, with low hills. Mean altitude is between
300 and 400 rn a. s. 1. A proportion of the area is overlaid by thick organic deposits,
overlying clay deposits (Soil Classification Working Group 1998).
The area covers three bioclimatic domains: the sugar maple (Acer saccharum Marsh.)
- yellow birch domain, the balsam fu - yellow birch domain, and the balsam fir
-paper birch domain (Saucier et al. 2003). Forest fires are an important natural disturbance across the study area. The current fire cycle is estimated to be arow1d 360
21
to 1850). The most recent period of increased fire activity occurred at the beginning of the 20th century (1910-1920, Bergeron et al. 2004).
2.4.2. Site selection and field sampling
Field surveys from the Quebec Ministry of Natural Resources (Ministère des
Ressources naturelles du Québec) and additional reconnaissance helped locate 14 forest stands (0.1 to 3 ha in size) at the northem limit of yellow birch distribution in
western Quebec (Fig. 2.1). To represent changes in climatic and forest conditions
along a gradient of decreasing yellow birch abundance, we sampled stands in three
bioclimatic domains: three sites within the sugar maple- yeUow birch domain (sites
KIP, LAN, and BEA, Fig. 2.1 ), five sites within the bal sam fir- yellow birch domain
(sites BEL, REM, CAl, BAS, and OPA) and six sites within the balsan1 fir - paper birch domain (sites KEK, CLI, COL, COS, ROQ, and AIG). For the two southem
do mains site selection was based on (1) identification of stands on ecoforestry maps
(Berger 2008) where yellow birch exceeded 20% of the total basal area, and (2) using
this set of stands to randomly select those within 2 km from the nearest forestry road.
We did not use natural disturbance (e.g., windthrow, insect outbreaks or forest fires)
as a selection criteria for sites to avoid any a priori assumptions conceming site
history. However, we excluded from sampling the sites which exhibited signs of
human disturbanée. For the northern-most bioclimatic domain (balsam fir - paper birch domain), we sampled ail yellow birch sites that were identified at the limit of
species' distribution, avoiding any filtering and pre-selection procedures.
Yellow birch was present in the forest canopy of all selected stands, although its
contribution to overall canopy composition varied (Table 2.1). At each site, we
established three randomly-located 400 m2 (20 rn x 20 rn) plots. We recorded density
of yellow birch seedlings (< 2 cm DBH) and saplings (2 cm :::; DBH < 8 cm), and density and DBH of all canopy trees (2: 8 cm) at each plot. Yellow birch seedlings
22
were recorded as soon as we could observe cotyledon leaves, which developed in one year old plants. Smaller plots ( 100 m2) were established at the three northernmost stands (COS, AIG, and ROQ) due to their small size (~ 0.1 ha).
In one stand of each bioclimatic domain, we collected yellow birch seedlings within a randomly selected 100 m2 plot and their age was estimated by counting tenninal bud scars and through crossdating of tree rings. We selected a subset of sites for reconstruction of seedling age structure to evaluate temporal variability in birch regeneration. To ensure sufficient replication in statistical analyses, we selected sites with abundant and similar amounts of yellow birch regeneration within each of the bioclimatic domains (sites KIP, BEL, CLI). None of these sites had signs of significant herbivory, which has been shown to impact yellow birch recruitment (e.g., Kem et al. 2012). Sampling only one site per bioclimatic domain prevented us from analysing within-domain variability in regeneration age structure. However, stands with sufficient regeneration levels to warrant statistical analyses were rare in the study area and it was thus impossible to have replicates inside each bioclimatic domain.
We estimated mean stand age by dating the pith of 20 canopy yellow birch trees,
which were randomly selected and cored at breast height in each stand. In the northem sites the number of sampled trees was limited by the availability of yellow birch trees, with a low of 17 trees. The number of rings missing at the pith was estimated with the help of a pith locator (Applequist 1958). In addition, we used the sampled yellow birch trees to obtain the mean and maximum ages of yellow birch populations and as a source of data for dendrochronological analyses (see below). At each plot, we estimated the ground area covered by large woody debris at advanced decomposition stages (stages 3 and 4, after Saucier 1994), which present a favorable substrate for yellow birch regeneration (Winget and Kozlowski 1965). We estimated
23
the percentage of canopy ope1mess in the four corners of each plot following Saucier (1994) and calculated an average percentage of canopy openness for each plot.
2.4.3. Soil analyses
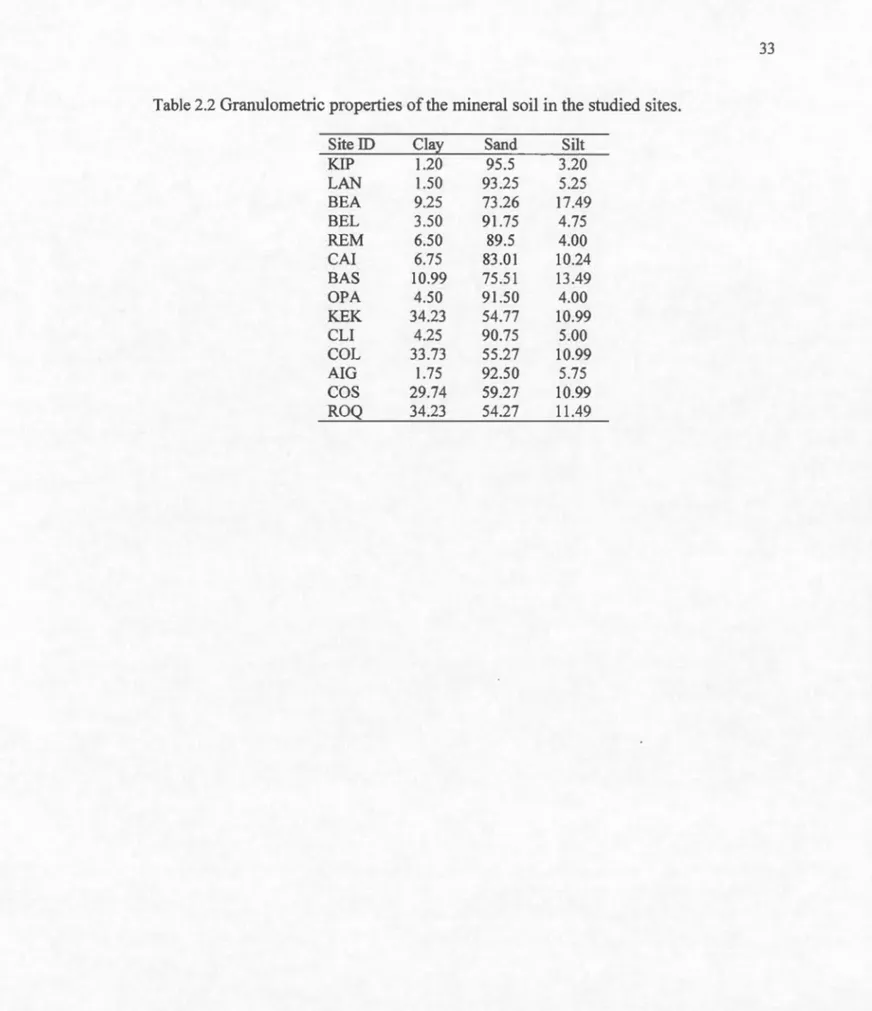
We conducted particle size analysis to determine the texture of the mineral soil. Three samples were taken from the upper 10 cm of mineral soil at each site. In the laboratory the samples were mixed together, air dried, and sieved through a 2 mm grid. We used the hydrometer method to quantify soil texture (Topp 1993). Other portions of soil samples were mixed together and sieved through a 4 mm grid, and oven-dried at 40°C for 60 hours. Cation concentration, total carbon (C, %), total nitrogen (N, %), total sulphur (S, %), total phosphorus (P, %) and pH in CaCh were estirnated following established protocols (Laganière et al. 201 0). Soil analyses were performed at the Laurentian Forestry Centre, Québec, Québec (Natural Resources Canada, Canadian Forest Service).
2.4.4. Statistical analysis of yellow birch regeneration
The effect of various site factors on yellow birch regeneration density was analyzed in two ways. First, based on our hypotheses and following a review of the relevant literature, we selected a set of independent variables representing stand structure and age, soil texture and nutrient content. We then ran multiple linear regression analyses against log-normalized seedling and sapling densities as dependent variables. We used a combination of backward and forward stepwise selection aimed at rninirnising the Akaike Information Criterion (AIC) value, with the CRAN R function step
(Hastie and Pregibon 1992, Venables and Ripley 2002). As an alternative approach taking into consideration possible autocorrelation in sorne factors and the low ratio between nurnber of observations CNsites = 14) and factors (12) we ran principal component analysis (PCA) on the original set of factors and then used PCs as
24
predictors in a multiple regression against nom1alized seedling and sapling densities. We also calculated partial semi-correlations for each of the independent variables used in the analysis to evaluate unique contribution of a variable to regeneration variability.
Analysis of seedling age structure followed the approach proposed by Hett and Loucks (1976) and assumed constant-over-time probability of mortality if the age structure could be approximated by an exponential function, and decreasing-over-time mortality if a power function provided a better fit. We used the following linear transformation to assess coefficients:
Loge ( y ) = Loge ( Yo ) - b x for the exponential model, and
Loge (y)= Loge ( Yo)-b Loge (x) for the power model, where
y is the number of seedlings in any age class x, yo is initial recruitment (i.e., the density of seedlings in the young est age class ), and b is the mortality rate.
To represent the soil water availability, we developed a site dryness index, by first conducting a PCA on selected soil properties, and then using the loadings on the fust principal component as a factor (Site Dryness Index) in analyses. The selected soil properties were thickness of the soil organic layer, percentages of sand, silt, and clay in the mineral soil (B horizon), and percentage of stone in the mineral soil.
2.4.5. Dendrochronological analyses of yellow birch growth
Tree-ring samples were mounted on wooden supports, polished with 600-grid sand paper and crossdated using the visual pointer year method (Stokes and Smiley 1968). Crossdated samples were measured using scanned images and CooRecorder & CDendro software package ver. 7.3 (Larsson 2010). Dating was statistically validated
25
with the COFECHA program (Holmes 1999). Measurements from two radii were averaged for each tree prior to analyses.
To evaluate differences in absolute growth among sites we developed cambial age chronologies, representing the growth trend as a function of cambial age of sampled trees. This method, used as part of the Regional Curve Standardization algoritlm1 (Briffa et al. 1992, Esper et al. 2002), is useful for extracting long-term growth patterns while minin1izing both the effects of climate conditions specifie to a particular time period and the influence of site histories on growth patterns. Cambial age chronologies were developed for each bioclimatic domain and fitted with a linear function. We estin1ated statistical significance of differences in regression coefficient
(b) values using a bootstrap method (Efron and Tibshirani 1993). To better represent
biomass accumulation dynarnics we converted tree-ring increments into basal area increments (BAI) using tree diameter data. We limited this analysis to the frrst 50 years of the trees' lifespan to specifically focus on initial growth rates and to avoid non-linearity associated with age-related decline in biomass production. Similar to the
analysis of cambial age chronologies, we tested for differences in BAI among
bioclimatic zones by comparing regression coefficients b (slope) in linear regressions between annual BAis and time. For these analyses we separated the northern balsam fir - paper birch domain into two sub-domains to reflect uneven distribution of sites within this domain.
For the analyses of growth sensitivity to climate, we detrended the crossdated series with the ARSTAN progran1 (Cook and Krusic 2005). We used a smoothing spline that preserved 50% of the variance at a wavelength of 32 years to detrend the time series and to maxinllze high-frequency (annual) variability in the record. In cases where the smoothing spline did not fit the empirical data, a negative exponential function was used. We computed chronology index by dividing the original chronology values by the values supplied by the spline. To remove natural
26
persistence (temporal autocorrelation) in growth patterns, we modeled each u·ee-ring
curve as an autoregressive process with the order selected by the fust-minimum
Akaike Inf01mation Criterion (AIC, Akaike 1974). We used ARSTAN residual
chronologies to analyze climate-growth relationships at each site. We used the CRAN
R package bootRes (Biondi and Waikul2004, Zang and Biondi 2012) torun response
function analyses of the site residual chronologies (dependent variables) and climate
variables (independent variables, see next sub-section) and provided bootstrap
-derived confidence intervals.
2.4.6. Clirnate data
For dendroclimatic analyses we used climate data generated in BioSIM 1 0.2.2.3, a set
of spatially-explicit bioclimatic models (Régnière and Bo1stad 1994, Régnière 1996).
For each sampling site we used BioSim to interpolate data from the five closest
weather stations and adjusted for differences in latitude, longitude, and elevation
between weather stations and site location. The climate variables included monthly
mean temperature (0
C), monthly total precipitation (mm), monthly total snowfall
(mm), and total growing degree-days (> 5°C). Additionally, we used seasonal
Drought Code (DC) estirnates, calculated from monthly DCs (MDC) from May to
August. The MDC was developed to capture moisture content of deep and compact organic layers of the forest floor (Turner 1972). The density of meteorological
stations was low during the first half of the 20th century. The mean distance between
the stations and the sampling sites decreased since that time (from 400 km to less
Table 2.1 Studied site properties and relative impottance (a mean of relative basal area and relativ e densit y) of canopy tree s peci es. The stands are aligned according to their latitude , from the southernmost sites (left) to the northernmost s ites (rig ht ). SM-YB -sugar maple -ye llow birch domain , BF-YB-balsam-fir -ye llow birch domain , and BF-WB -bal san 1 fir-w hit e birch domain . BA at the variable name s indicat es ye llow birch (Betula alleghaniensis). CEC-total cation exc han ge capacity of the mineral soil. SOL-thickness of soil organic la yer. Parame! er s 1 Specie s SM -YB BF -YB BF-WB Kip Lan Bea Be l Rem Ca i Bas Op a Kek C li Co l Aig Co s Roq L a tit u de ( 0N) 46 . 75 47.06 47.22 47.36 47.73 47 . 89 47.9 1 48. 1 2 48 . 1 7 48.18 48 . 3 1 48.45 48.53 48.65 Lo n g i tude ( 0W) 78 . 93 79.27 78.88 78.68 79.04 79.08 78.84 79 . 30 79 .1 8 79.45 79 . 38 78 . 7 79 . 36 79.50 Altitude ( rn) 262 292 3 15 352 344 300 285 285 3 1 5 360 295 345 267 262 Ca nopy Openne ss, % 9 28 33 24 8 26 1 6 1 7 20 1 0 55 45 25 48 2 -1 Tota l ba sa l are a (rn h a ) 23. 1 3 28.68 27.37 27 . 29 24.21 27.24 32.95 42.4 37.27 37.42 7. 1 9 1 7.62 1 7.94 2 1. 02 Tota l tre e den s it y ( s tem s h a -l ) 650 650 667 408 7 1 7 450 517 550 1 000 367 308 725 500 975 2 -1 B as a l a rea BA (rn h a ) 1 6.49 6.25 1 5 . 24 1 6.37 1 2 . 93 1 8.48 1 6.0 1 1 4.44 1 2 .1 0 1 8 . 04 3 . 96 4 . 20 5 . 22 4. 32 M e an a ge BA , y e a r s 1 55 15 2 1 48 1 62 2 11 1 3 0 146 1 35 11 4 134 1 00 60 8 1 6 1 D ea d w ood area , m 2 0 . 75 2 . 9 1 1. 05 2 . 11 1.75 2 . 1 4 0 . 56 2 . 22 0 . 97 0 . 36 0 .5 7 0 . 53 0.63 0 . 30 Sit e dr y n ess in de x 1.1 0 . 98 -0 . 6 0.52 0.99 0. 1 6 -0.42 0 . 79 -1.1 7 0.72 -1. 43 0.98 -1.1 3 -1.5 CEC 2 1.1 6 1 2.87 31.33 22 . 54 2 1.51 1 6.68 1 7.56 2 1.1 3 39 . 92 1 9.3 1 26.26 27.59 27.2 1 29 . 75 SOL , c m 4.3 9 . 2 15 . 0 1 3.3 8.3 1 2 . 3 6 . 3 1 2.0 12 .7 15 .3 1 2.5 6 . 5 9.0 1 2 .0 A bi es ba/ s am e a 6 . 8 23 . 6 1 6.7 5 .2 4.4 1 8.2 28.7 37 . 6 1 8 . 4 20.8 24.9 5.7 30. 1 53 . 2 Ace r p e n sy l vani c um 0.7 Ace r ru b rum 9 . 2 1.1 3.4 4 . 9 2 . 7 1 0 .1 1.3 Ace r s a cc harum 1 4 . 5 1.4 4 . 5 6.0 5.5 N -...)
Ace r s pi c atum B e tu l a a ll eg hani e n s i s 3 1. 8 27.0 28 . 3 39.6 58 . 3 45.2 B e tul a p a p y rif e ra 1 3 . 6 1 0.9 Fr ax inu s ni g ra 2 . 77 1.1 Pi ce a g lau c a 1 0 . 3 4 . 0 7.2 1 0 . 9 1 4 . 6 Pi cea mari a na 0 . 7 Pim1 s s tr o bu s 5.0 1 P o pulu s b a l s amif e ra Populu s tremuloid e s Prunu s p e n sy lvani c a Prunu s vir g in.ian.a Thuja occ id e n t a li s 6 .5 32.7 .3 41.4 6.0 1 7.2 T s u g a c anad e nsi s 36 . 3 S orbu s d ec ora 4.6 42 . 9 38 . 5 1 6 . 7 35 . 9 2 .1 9.5 5 . 2 24.9 1 6 . 8 1 2 .1 11. 2 25.7 0 . 6 5 . 1 3.5 1.2 8.9 9 . 7 36 . 9 23 . 9 5.9 1 4 . 0 1. 8 36 .1 1 6 . 1 1 0 .5 10 .3 5.5 4 . 3 3 . 9 0 . 3 1 6 . 7 1 8 . 9 2.5 8.6 3.8 19.4 N 00 1 5.4 20. 1 11 .4
29
2.5. Results
At the northern limit of its range in western Quebec yellow birch grows in mixed
stands (Table 2.1) on relatively well drained (Table 2.2) and moderately rich soils
(Table 2.3). Balsam fir, white spruce (Picea glauca Moench.), and eastern white
cedar (Thuja occidentalis L.) were common canopy trees in the studied sites (Table
2.1 ). Relative importance of yellow birch in the canopy was at !east 25% in the two
southern temperate domains, and at !east 15 % in the northernmost boreal domain.
Canopy composition of the sampled stands represented the zonal differences in
vegetation cover with hardwoods (predominantly Acer spp.) being typical in the
canopies of the southern part of the transect, while paper birch and black spruce
(Picea mariana [Mill.] B.S.P.) increased in abundance northward. Latitude was
significantly negatively correlated with yellow birch basal area (r
=
-0.68), total standbasal area ( -0. 70), and mean age of canopy yellow birch trees ( -0.68).
In ten out of 14 sites (71%) the maximum age of yellow birch trees exceeded 200
years and in five cases (36%) it was very close or above 300 years (Table 2.4). Our
field surveys and data from ecoforestry maps (Berger 2008) revealed large impact of
forestry operations in the surrounding stands in the two southerly located bioclimatic
domains, which precluded estimation of natural maximum and average age of
surrounding stands. However, such estin1ates were possible for stands in the paper
birch - balsam fir domain, where both average and maximum ages of yellow birch
stands were higher than tho se of the surrounding stands.
Yellow birch regeneration abundance varied considerably across sites within each of
the bioclimatic domains, but did not show a clear latitudinal pattern (Fig. 2.2). The
highest densities of yellow birch seedlings and saplings, recorded within a site, were
observed in the northernmost balsam frr- paper birch bioclimatic domain. It was also
the only domain where sorne sites were devoid of yellow birch seedlings (the three