OATAO is an open access repository that collects the work of Toulouse
researchers and makes it freely available over the web where possible
Any correspondence concerning this service should be sent
to the repository administrator:
[email protected]
This is an author’s version published in: http://oatao.univ-toulouse.fr/25802
To cite this version:
Gonzalez Martinez, Maria Victoria
and Floquet, Pascal
and Dupont,
Capucine and da Silva Perez, Denilson and Meyer, Xuân-Mi
Assessing the
impact of woody and agricultural biomass variability on its behaviour in
torrefaction through Principal Component Analysis. (2020) Biomass and
Bioenergy, 134. 105474. ISSN 0961-9534
Official URL :
https://doi.org/10.1016/j.biombioe.2020.105474
Available online 28 January 2020 0961-9534/
Assessing the impact of woody and agricultural biomass variability on its
behaviour in torrefaction through Principal Component Analysis
María Gonz�alez Martínez
a,b,c,*, Pascal Floquet
c, Capucine Dupont
d, Denilson da Silva Perez
e,
Xu^an-mi Meyer
caUniversit�e de Toulouse, IMT Mines Albi, RAPSODEE CNRS UMR-5302, Campus Jarlard, F-81013, Albi Cedex 09, France bUniversit�e Grenoble Alpes, CEA, Laboratory of Bioresources Preparation (LPB), Grenoble, France
cLaboratoire de G�enie Chimique, Universit�e de Toulouse, CNRS, INPT, UPS, Toulouse, France
dIHE Delft Institute for Water Education, Department of Environmental Engineering and Water Technology, Delft, the Netherlands eFCBA, InTechFibres Division, CS 90251, F-38044, Grenoble, France
Keywords:
Biomass torrefaction Principal Component Analysis Cellulose
Hemicelluloses Lignin Ash content
The influence of biomass macromolecular composition on its behaviour in torrefaction was statistically assessed through Principal Component Analysis (PCA), both in terms of solid conversion kinetics and volatile species released, in function of the operating conditions. The experimental data obtained in the torrefaction of 14 woody and agricultural biomass samples at lab-scale was analysed. Main biomass macromolecular composition on cellulose, hemicelluloses and lignin was shown to acceptably represent biomass diversity, which can be com-plemented by the extractives and ash content. Similitudes were found in deciduous and coniferous wood families, respectively, while agricultural and herbaceous crops were shown as more heterogeneous, both in terms of characterization and behaviour in torrefaction. Cellulose, hemicelluloses and lignin content strongly influenced solid and volatile species yields in torrefaction, while biomass family exhibited a lower impact. Ash content in potassium, phosphorous and silicon did not show any influence on the extent of solid degradation through torrefaction. A lower variability was found in solid degradation profiles from woods, while agricultural crop behaviour was more heterogeneous. Different volatile species were released from biomass samples from the same family. Furthermore, different production profiles were found for volatile species chemically close, except for deciduous wood. These results indicate that, when modelling biomass torrefaction, solid mass loss can be rep-resented by an exemplar of deciduous and coniferous wood, while several species would be required for the agricultural family. The variability of the volatile species release would require the consideration of several volatile species and several biomass samples per family.
1. Introduction
In Europe, additional forest resources, agricultural by-products and biodegradable waste are currently being mobilized so as to satisfy the increasing energy demand and to propose green chemicals and materials to the market [1,2]. In this context, biomass thermochemical conversion can contribute in the large scale valorisation of biomass resources with a low moisture content (below around 60% before harvesting [3]), which included coniferous and deciduous wood, agricultural by-products and herbaceous crops [4,5].
Torrefaction is a mild thermochemical treatment occurring typically between 473 and 573 K during a few tens of minutes to hours, depending
on process parameters and torrefaction technology, at atmospheric pressure and in default of oxygen [6,7]. The solid product obtained presents properties closer to coal in terms of heating value, carbon content, hydrophobicity, grindability as well as flowability, and thus is suitable as fuel for combustion, co-combustion or gasification [8–10]. During torrefaction, part of the raw material is released as gaseous species, including water, permanent gases (CO, CO2) and volatile species
(acetic acid, furfural, phenol, etc.).
Biomass is a highly heterogeneous resource, whose composition and biological origin strongly impact its behaviour in torrefaction. It consists of a complex structure formed by a mostly crystalline cellulose micro-fibril network surrounded by a matrix of hemicelluloses and small * Corresponding author. Universit�e de Toulouse, IMT Mines Albi, RAPSODEE CNRS UMR-5302, Campus Jarlard, F-81013, Albi cedex 09, France.
E-mail address: [email protected] (M. Gonz�alez Martínez).
https://doi.org/10.1016/j.biombioe.2020.105474
� Coniferous wood: pine (wood), pine forest residues (wood, needles, bark) and Scot pine bark.
� Deciduous wood: ash-wood, beech and poplar.
� Herbaceous crops: miscanthus, willow and reed canary grass. � Agricultural by-products: 2 types of wheat straw (Swedish and
French), corn cob, grape seed cake and sunflower seed shells. The selected biomass samples were torrefied in a thermogravimetric analyser coupled to a gas chromatograph and mass spectrometer device (TGA-GC/MS) through a heated storage loop system. The kinetics of solid mass loss and the production of the volatile species released were firstly analysed in dynamic conditions, from 473 to 573 K with a heating rate of 3 K min 1, followed by an isothermal step at 573 K for 30 min.
Detailed comments and data on biomass preparation, characterization and main results obtained in torrefaction experiments were reported in Ref. [30].
Ash composition was measured for the 14 biomass samples through Inductively Coupled Plasma Atomic Emission Spectroscopy (ICP–AES) after mineralization for all inorganic species except for silicon, which was measured after alkaline melting, as proposed by Ref. [31]. Only the content on inorganic elements previously reported to impact biomass transformation through thermochemical conversion [20,21] was considered, this is, potassium (K), silicon (Si) and phosphorous (P) content (Table 1).
2.2. Data analysis
Multivariate Data Analysis (MVDA), in particular Principal Compo-nent Analysis (PCA), was carried out with XLStat for Microsoft® Office® 2017. Based on correlation detection between variables, PCA substitutes groups of correlated variables with new, uncorrelated variables named principal components (PC) [32], reducing a large set of variables to a small set that still contains most of the information of the large set [19]. To do this, PCA transforms the original system of axis in a new dimen-sional space where the first axis (PC1) contains the highest variance, the second one (PC2, orthogonal to PC1), contains the second highest variance, and so forth. The maximum number of dimensions of this new space corresponds to the number of variables and captures the full variance of the dataset [32]. The number of variability sources is reduced compared to the original dataset by selecting a reduced number of new PC axes that represents a satisfactory fraction of the dataset variability. As a result, the observations of the measured variables are changed into new values, named scores, obtained by projecting the variation in the new PCA axis. This result is visualized in the score plot, which represents the relationship between the sample points based on their maximum variation. The proximity of the samples in the score plot indicates their similarity. A sample’s position in the score plot is determined by the contributions of the variables to the PCs, given by the loading values or loadings. These values represent the partial contri-bution of each variable, which is calculated by the cosine of the angle between the variable in the original dimensional space and the tilt in the new PCA plane. The loadings are visualized in a loading plot, in which each variable is represented by a data point. The variables are repre-sented in this plot according to their weights for the chosen components (PC1 and PC2, here). Variables are better represented whether they are closer to the circle in the loading plot. On the contrary variables located close to the origin have low weight for the represented principal com-ponents. Observations in PCA score plot and in the corresponding loading plot are related: observations grouped in one given region of the score plot are associated with relatively higher values for variables clustered in the equivalent region of the loading plot. On the contrary, these observations are anticorrelated to the variables situated in the opposite part of the loading plot and there is no correlation when the variable-vectors are orthogonal.
In this work, several datasets within the available data were defined, which correspond to elemental and macromolecular composition of raw Inorganic elements content Biological specie K P Si
Biomass samples g/kg (biomass)
Deciduous wood
Ash wood Fraxinus ssp. 2.66 0.26 0.99
Beech Fagus ssp. 1.12 0.14 0.77
Poplar Poplar ssp. 2.54 0.26 2.42
Willow Salix ssp. 2.88 0.99 1.38
Coniferous wood
Pine Pinus pinaster 0.59 0.08 2.07 Pine forest residues Pinus sylvestris 1.69 0.36 3.94 Scot pine bark Pinus sylvestris 2.13 0.35 1.82
Herbaceous crops
Miscanthus Miscanthus ssp. 3.36 0.29 7.01 Reed canary grass Phalaris arundinacea 14.71 2.22 11.38
Agricultural crops
Corn cob Zea mays 5.85 0.36 1.33
Grape seed cake Vitis vinifera 4.14 2.20 0.93 Sunflower shells Helianthus annuus 6.87 0.64 0.19 Wheat straw (French) Triticum ssp. 8.82 1.25 25.23 Wheat straw (Swedish) Triticum ssp. 11.13 1.26 12.53 amounts of lignin which give the definitive strength to the structure [11, 12]. Extractives, ash and proteins are also present in biomass structure. The proportions and distribution of these macromolecular components in biomass is complex and depends on biomass type. Besides, in-teractions between cellulose, hemicelluloses and lignin confer a signif-icant resistance to the structure [11]. Biomass elemental composition is principally formed by carbon (C), oxygen (O), hydrogen (H) and nitro-gen (N), with minor amounts of inorganic elements such as potassium (K), calcium (Ca) or phosphorous (P) [13,14].
Multivariate Data Analysis (MVDA), and more precisely Principal Component Analysis (PCA), was typically used in discriminating py-rolysis products derived from polysaccharides and lignin in analytical Py-GC/MS [15–17] and gasification [18]. It consists on a statistical tool enabling to identify groups of variables behaving similarly in a complex dataset, as well as to detect major trends and potential outliers [19]. PCA was rarely applied to elucidate the relationship between biomass char-acterization and its behaviour in torrefaction. Some studies have linked biomass composition, particularly on inorganic elements, to the result-ing torrefied solid properties [20,21]. A model was proposed for pre-dicting solid fuel characteristics in wood torrefaction from thermogravimetric experiments [22]. However, these studies only consider a reduced number of biomass characteristics or of raw biomass samples. The influence of biomass macromolecular composition in cel-lulose, hemicelluloses and lignin on its behaviour in torrefaction was largely demonstrated in the literature [6,7,23–28], while other studies suggested a role of the elemental composition on solid transformation through torrefaction [29].
Based on this background, the objective of this work is to identify the main parameters conditioning biomass diversity and impacting its behaviour in torrefaction, both in terms of solid degradation and of volatile species release. At the same time, the influence of the biomass family on biomass characterization and on its behaviour in torrefaction will be assessed. To do this, a dataset of 14 woody and agricultural biomass samples, whose characterization and behaviour in torrefaction was presented in Ref. [30], was deeply assessed through Principal Component Analysis.
2. Materials and methods
2.1. Experimental data
Biomass samples were selected in order to represent biomass di-versity, by considering the following families (Table 1):
Table 1
Potassium (K), silicon (Si) and phosphorous (P) content measured for the biomass samples studied.
Biomass and Bioenergy 134 (2020) 105474
biomass, remaining solid mass and volatile species release in function of the torrefaction temperature.
It was reported that classical statistical methods present limitations in data analysis when having a reduced number of observations for a higher number of variables [19,33], which is the case in this study and justifies the data analysis through PCA. Before carrying out PCA, vari-ables were centred and reduced so that all varivari-ables have the same influence.
3. Results and discussion
3.1. Biomass characterization 3.1.1. Global analysis
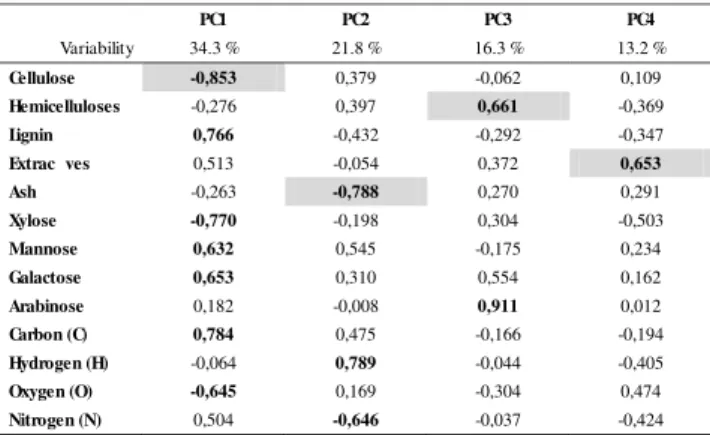
Macromolecular and elemental characterization of the 14 biomass samples presented on [30] was assessed by a PCA. Four Principal Components (PC) were selected to achieve an acceptable representation of the high data variability (85.7%, Table 2). The highest factor loading per group was highlighted
PCA results indicated a high degree of variability in terms of macromolecular and elemental composition, since 4 PC are necessary to represent most (85.7%) of the variability of the 14 biomass samples selected. It shows also that the high variability factors (that corresponds to PC) are greatly related to cellulose, hemicelluloses, extractives and ash content (or lignin). By selecting the first three PC (PC1, PC2, PC3 with 72.5% of the total data variability), the results showed that cellu-lose, hemicellulose and lignin content might be sufficient to describe a large amount of the 14 biomass diversity. On the contrary, elemental composition parameters (C, H, O, N) contributed to some PC, which indicated that this composition would not be sufficient to represent biomass heterogeneity [29]. However, the high variability in the data suggested separating elemental and macromolecular composition in further PCA evaluations, as their source of variability was different. Concerning hemicellulose sugar composition, xylose seemed correlated with cellulose, while mannose and galactose are anticorrelated to cel-lulose and correlated to lignin. Arabinose, which was independent from the three other sugars, was correlated with hemicelluloses content. This could be explained by the fact that mannose and galactose are especially present in softwood, which was usually characterized by a high lignin content. Xylose is the main sugar in hardwood hemicelluloses, while cellulose and hemicellulose content in this biomass type are usually higher than the lignin content [13]. As a result, hemicelluloses sugar composition might be sufficiently described through its main sugar composition, typically in xylose or mannose, in function of the biomass type.
In order to identify biomass samples with a similar macromolecular
and elemental composition, the Ascendant Hierarchical Clustering (AHC, Fig. 1) method was applied to the factor scores of the observations of the previous PCA (Table 2). A hierarchy of 4 clusters represented the variability of the data in terms of macromolecular composition. Decid-uous woods, pine and miscanthus appeared grouped although they belong to different biomass families. Pine forest residues and Scot pine bark were classified together, close to grape seed cake, probably because of their high lignin content. The two wheat straws were grouped, while corn cob cake, reed canary grass and sunflower seed shells were grouped separately.
These results highlighted similarities between coniferous and de-ciduous wood. They also suggested an intermediate position of herba-ceous crops between deciduous wood and agricultural crops. The heterogeneity of agricultural crops is reflected in their dispersion in the clusters. The overall analysis on the 14 biomass samples showed that the diversity in biomass composition can be described through its cellulose, hemicellulose and lignin content. Similarities were found between samples belonging to the same biomass family, particularly in the case of wood. Herbaceous crops and agricultural by-products present a more heterogeneous characterization.
3.1.2. Elemental composition
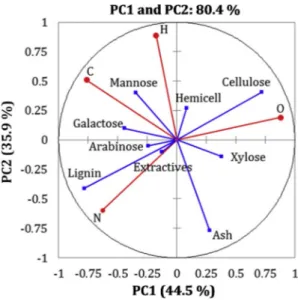
A second PCA was carried out on the main elemental composition in carbon (C), oxygen (O), hydrogen (H) and nitrogen (N) of the 14 biomass samples (Fig. 2), with macromolecular composition as supplementary variables. The variability represented by each PC in this analysis is indicated in brackets.
The result of this analysis leaded to reduce to 2 PC considered, rep-resenting 80.4% of the variability of the data. Elemental composition (in red in Fig. 2) corresponds to the “active variables” used in PC definition, macromolecular composition (in blue, Fig. 2) are “supplementary” ones and are not taken into account in PC definition. Elemental composition appeared as well-represented in the loading plot while macromolecular composition was only well-represented in terms of cellulose, lignin and ash content. Extractives and hemicellulose content were not well- represented, but only one of them was independent regarding cellu-lose, hemicelluloses and lignin, adding a small part of the representation of data variability.
This PCA showed a clear anti-correlation between O and N compo-sition. At the same time, there is no correlation between O and H or C composition. The high variability represented by 2 PC suggested that C, H, O, N composition are non-independent parameters. A negative
Table 2
Factor loadings of the PCA on macromolecular and elemental composition of 14 biomass samples. PC1 PC2 PC3 PC4 Variability 34.3 % 21.8 % 16.3 % 13.2 % Cellulose -0,853 0,379 -0,062 0,109 Hemicelluloses -0,276 0,397 0,661 -0,369 Lignin 0,766 -0,432 -0,292 -0,347 Extrac ves 0,513 -0,054 0,372 0,653 Ash -0,263 -0,788 0,270 0,291 Xylose -0,770 -0,198 0,304 -0,503 Mannose 0,632 0,545 -0,175 0,234 Galactose 0,653 0,310 0,554 0,162 Arabinose 0,182 -0,008 0,911 0,012 Carbon (C) 0,784 0,475 -0,166 -0,194 Hydrogen (H) -0,064 0,789 -0,044 -0,405 Oxygen (O) -0,645 0,169 -0,304 0,474 Nitrogen (N) 0,504 -0,646 -0,037 -0,424
Fig. 1. AHC dendrogram of the factor scores of the observations from
PCA (Table 2).
correlation between cellulose and lignin could be confirmed, as well as the lack of correlation between cellulose, lignin and ash. This repre-sentation did not improve the reprerepre-sentation of hemicelluloses and sugar composition.
PCA on elemental composition allowed to conclude that elemental composition is not the most suitable to represent biomass diversity based on our 14 biomass, as similar values of the main parameters are found for all samples.
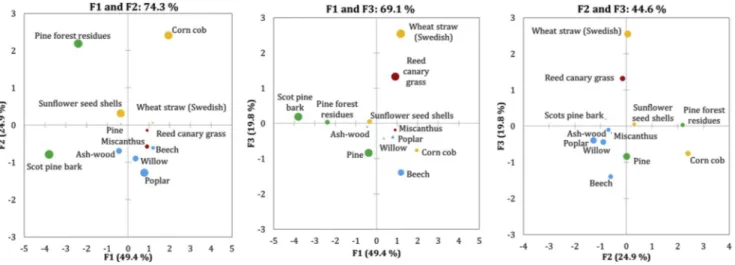
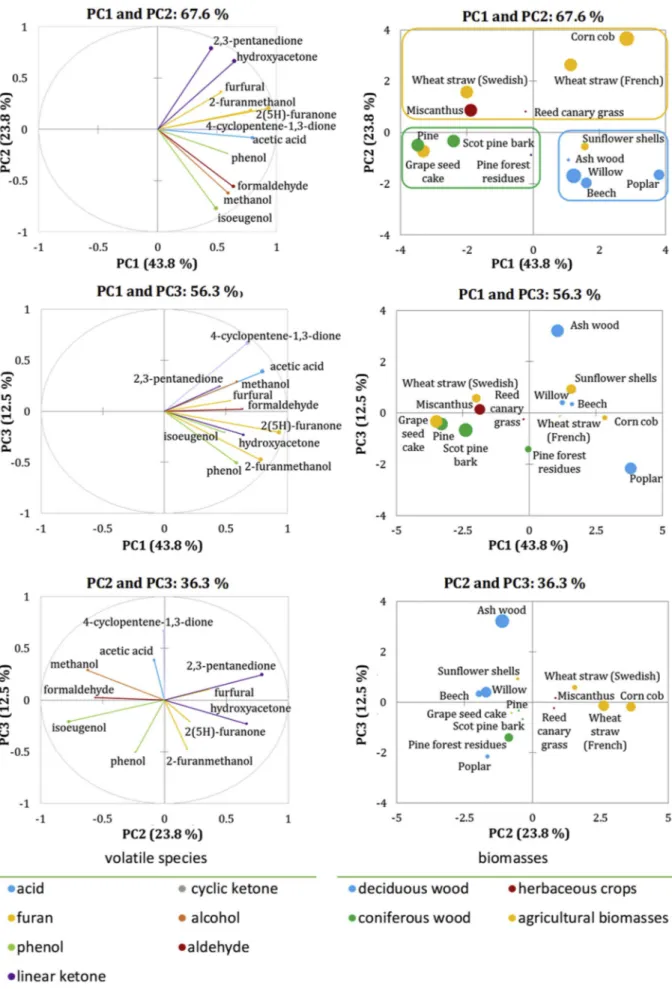
3.1.3. Macromolecular composition for 12 selected biomass samples A PCA analysis was carried out by considering 12 biomass samples out of 14, excluding grape seed cake, due to its strongly different macromolecular composition, and French wheat straw, to avoid almost- duplicate samples. Biomass macromolecular composition (cellulose, hemicelluloses, lignin, extractives and ash content) was selected as the main variables for the analysis, while elemental composition (C, H, O, N) was included as supplementary variables (Fig. 3).
Three PC were selected, which improves the representation of the variability (94.0%) compared to the PCA with all biomass samples (Table 2). In fact, when the 14 biomass samples are used, 4 PC are necessary to take into account 85.7% of the whole variability and when “only” 12 samples are selected, 3 PC represents 94% of the variability. The 3-dimensional representation was converted into 2-dimensions graphics by pairs of principal components, both for loading plots (Fig. 3) and score plots (Fig. 4). The size of the points in the score plots is
proportional to the squared cosines of the observations (well-represen-tativeness of the points). Biomass samples from the same family are represented by the same colour.
From Fig. 3, it can be seen that hemicelluloses representation was improved (point close to the correlation circle in Fig. 3 left and right), while ash content was closely correlated with the PC3 axis (Fig. 3 centre and right). Biomass samples with the highest ash content, namely wheat straw and reed canary grass, presented the highest values of the PC3 component, which indicated that variability in ash content of biomass might be described by this axis. Hemicelluloses content was correlated to PC2 axis, which was supported by the high values of this PC for biomass samples with the highest hemicellulose content, namely corn cob and pine forest residues. In the case of the PC1 axis, the correlation with cellulose content and the anti-correlation to lignin content were not so clear. But, biomass samples with a high lignin content tended to be oriented to the negative part of the PC1 axis; this was the case of Scot pine bark and pine forest residues; on the contrary, biomass samples mostly based on cellulose were in the positive part of the PC1 axis, namely miscanthus, poplar, beech or willow. To sum up, biomass vari-ability in terms of macromolecular composition could be represented by three independent PC.
These results demonstrated that macromolecular composition is a suitable tool to define variability in biomass characterization, while the elemental composition showed its limitations. Biomass macromolecular composition can be represented by the cellulose, hemicelluloses and lignin content. Extractives and ash could be neglected by accepting a lower representation of the data variability. Concerning the samples, it stands out that biomass samples from the same family can present strong differences in their composition. This was particularly remarkable for agricultural crops, while woods tend to show a closer composition. The representation of the variability in biomass macromolecular composi-tion was improved by removing outliers and duplicate specimens. However, for the analysis of biomass behaviour in torrefaction, all 14 biomass samples were considered.
3.2. Solid transformation
Biomass behaviour in terms of solid transformation during torre-faction [30] was analysed through PCA. The objective of this analysis was to determine whether similarities exist in the conversion of the biomass samples of study through torrefaction, as a function of the temperature (non-isothermal torrefaction) and of the duration (isothermal torrefaction). The influence of the composition in cellulose, hemicelluloses and lignin of the raw material in solid transformation was also assessed.
3.2.1. Non-isothermal torrefaction
PCA was carried out on the remaining solid mass of the 14 biomass Fig. 2. Loading plot of the PCA on the elemental composition of 14
biomass samples.
Biomass and Bioenergy 134 (2020) 105474
samples in non-isothermal torrefaction between 473 and 573 K at 3 K min 1 [30]. Remaining solid mass points were considered for each
biomass (observations) every 10 K of temperature (variables), which corresponds to 3.3 min. It was checked that this parameter did not impact the PCA result. Biomass macromolecular composition (Fig. 5, left) and the ratios between macromolecular components (Fig. 5, right) were added as PCA supplementary variables. 2 PC were selected, which represented 97.1% of the data variability.
In Fig. 5, the “active” variables (that are variables taken into account in PCA) are the remaining mass at 483 K–573 K with a step of 10 K in red with the value of temperature, supplementary variables (that are taken into account in PCA) corresponds to macromolecular compositions (in blue in the left figure) or macromolecular ratio (in blue in the right figure). All variables were well-represented, except the remaining mass at 473 K, which coincided with the centre of the loading plot, as it was the reference for remaining solid mass (100%). The results showed a separate correlation between low (483–513 K) and high (553–573 K) torrefaction temperatures, both groups being non-correlated. Torre-faction temperatures from 523 to 543 K presented an intermediate behaviour. The distinction of two groups of temperatures was in agreement with the change in the kinetics curve observed at interme-diate torrefaction temperatures for most of the biomass samples. How-ever, the temperature of this trend change seemed to be function of biomass type.
Macromolecular composition was only acceptably represented as supplementary variables for cellulose and extractives content (Fig. 5, left). Its representation was improved with the ratios between macro-molecular components (Fig. 5, right). The ratio hemicelluloses/lignin
was anti-correlated with higher torrefaction temperatures, while the ratio cellulose/hemicelluloses seemed correlated with the lower ones. The ratio cellulose/lignin was anti-correlated with the PC2 axis, so it could contribute to explain the behaviour in the PC2 direction for the score plot. In this sense, a diminution in the cellulose/lignin ratio might explain the increase in the dispersion of the temperatures in the PC2 axis direction: cellulose is mostly degraded at higher torrefaction tempera-tures (553–573 K), while lignin degradation in torrefaction is less pro-nounced and starts at intermediate temperatures (533–543 K) [9,23,34, 35]. On the other hand, most of the degradation of hemicelluloses happens in the torrefaction temperature range (513–573 K), starting at low and intermediate temperatures [36,37], which explained the anti-correlation of the hemicelluloses/lignin ratio with the high tem-peratures. The correlation of the ratio cellulose/hemicelluloses with the low temperatures was explained by the high temperature needed for cellulose degradation in torrefaction, which contrasted with the low temperature required for hemicelluloses transformation.
Observation points, which correspond to the biomass samples whose solid conversion rate was analysed each 10 K (Fig. 5), were well- represented in the score plot (Fig. 6). There was an opposite behav-iour for corn cob and grape seed cake, explained by their opposite hemicellulose/lignin ratios. Coniferous wood species could be grouped together and were correlated to the PC2 axis, which corresponds to their high lignin content, despite the dissimilarities in the cellulose/lignin ratio. Their biological structure and the composition of their lignin were similar, mostly formed by guaiacyl-groups, which justified their similar behaviour in terms of solid transformation. Grape seed cake could be also grouped with coniferous wood due to its high lignin content. Fig. 4. Score plots of the PCA on macromolecular composition of 12 biomass samples.
Fig. 5. Loading plot of the PCA on remaining solid mass versus temperature for the non-isothermal torrefaction of 14 biomass samples.
Biomass and Bioenergy 134 (2020) 105474
Biomass samples corresponding to herbaceous crops (red) and decidu-ous wood (blue) families were close, respectively. Agricultural crops were not grouped together, which responded to the heterogeneity in their composition and correlatively in their remaining solid mass.
These results highlighted a strong impact of the ratio between cel-lulose, hemicelluloses and lignin of a biomass on the mechanisms involved in solid transformation through torrefaction. The influence of the biomass family was only clearly identified for coniferous wood. 3.2.2. Isothermal torrefaction
PCA was carried out on the remaining solid mass of the 14 biomass samples in isothermal torrefaction at 573 K for 30 min. Remaining solid mass points were considered every 3.75 min. It was checked that this parameter did not impact the PCA result. Macromolecular composition (Fig. 7, left) and ratios between cellulose, hemicellulose and lignin (Fig. 7, right) were added to PCA as supplementary variables. 2 PC allowed an accurate representation of the data variability (99.7%).
As in Fig. 5, the “active” variables in Fig. 7 are the remaining mass at different time (in red with the value of time in minutes), while supple-mentary variables correspond to macromolecular compositions (in blue in the left figure) or macromolecular ratio (in blue in the right figure). While time points in the loading plot were well-represented, only lignin and cellulose content could be considered as representative
supplementary variables. Hemicellulose content was not well- represented, probably because the main part of its degradation hap-pens below 573 K [9,23,38]. Time points were distributed in a similar way to the previous case (Fig. 5). However, most of the variability was coincident to the PC1 direction and only a minor part of it was repre-sented by the PC2 direction. The PC1 axis seemed correlated with lignin content and high time values seemed anti-correlated with cellulose/-lignin content. As a result, a higher cellulose content in biomass might imply a lower impact of the step duration in the solid transformation for an isothermal torrefaction at 573 K. This can be explained by the fact that cellulose started its thermal degradation around 573 K, but its transformation is principally enhanced by the increasing temperature, until around 673 K [34,39–41].
The score plot derived from this PCA showed a distribution of the biomass samples in the PC1 axis in function of their increasing lignin content: the highest content for grape seed cake, followed by the coniferous wood and reed canary grass, deciduous wood and agricul-tural crops (Fig. 8). As a result, two groups could be distinguished: coniferous wood, close to grape seed cake, on the one hand, and de-ciduous wood, close to reed canary grass, on the other hand. Agricultural and herbaceous crops were shown to be heterogeneous groups also in solid transformation in torrefaction.
This PCA pointed out the influence of the ratio cellulose/lignin of biomass composition on its solid transformation in the isothermal tor-refaction step at 573 K, while hemicelluloses might be already trans-formed at this point. Woody samples exhibited similar solid Fig. 6. Score plot of the PCA on the remaining solid mass versus temperature
for the non-isothermal torrefaction of the 14 biomass samples.
Fig. 7. Loading plot of the PCA on the remaining solid mass versus the duration of the isothermal torrefaction of the 14 biomass samples.
Fig. 8. Score plot of the PCA on the remaining solid mass versus the duration of
the isothermal torrefaction of the 14 biomass samples.
�Determine the influence of the temperature in the volatile species production.
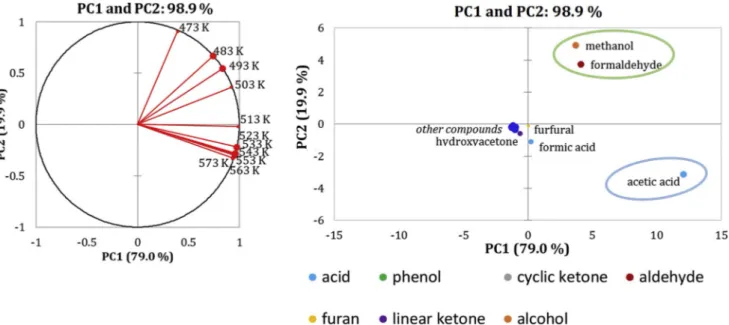
� Group volatile species in function of their similar production. Data for this PCA corresponded to the instantaneous production quantified for each volatile species (observation) at each temperature point (variable), considered every 10 K or 3.3 min in non-isothermal torrefaction [30]. 2 PC represent 98.9% of the variability (Fig. 10). Temperature points are represented in the loading plot (Fig. 10, left). Volatile species from the same chemical family were represented by the same colour in the score plot, except the so-called « other compounds » that were not clearly separated (Fig. 10, right).
The loading plot showed two distinct groups of behaviour, corre-sponding to the temperatures below and above 513 K (Fig. 10, left). This might be correlated to the degradation of hemicellulose, starting from 473 K [6,23,37], and the later degradation of cellulose, rather beginning at intermediate to higher torrefaction temperatures [34,40]. All the volatile species were well-represented in the score plot, except formic acid, furfural and hydroxyacetone. Three groups of observations could be distinguished, which corresponded to acetic acid, methanol-formaldehyde and the rest of the volatile species. The sepa-rated volatile species were coincident to the major compounds released, and their position in the score plot was in agreement with the production profiles observed [30]. Indeed, methanol and formaldehyde might be present below 513 K, presumably corresponding to the decomposition of hemicelluloses [24,43] and lignin [44,45], respectively. Acetic acid production followed hemicelluloses degradation and was enhanced at intermediate to high temperatures [46,47].
However, the high production of some major volatile species did not allow to differentiate any trend in the production of minor species. To distinguish them, a second PCA was carried out excluding the main compounds, i.e. methanol, formaldehyde, acetic acid, formic acid and furfural (Fig. 11).
In this case, the loading plot showed differences between low and intermediate to high torrefaction temperatures (Fig. 11, left). However, the transition (513–543 K) was less marked than in the first PCA (Fig. 10, left). All observations were well-represented by two PC (89.2% of the variability), except syringol, 2-methoxy-4-vinylphenol and 2-propa-none, 1-(acetyloxy)-. Principally, 3 groups of volatile species behav-iour could be distinguished: the first group, including 2(5H) furanone, vanillin, phenol and 4 cyclopentene 1,3 dione; the second group with isoeugenol, 2-furanmethanol and hydroxyacetone; and the third group with the other volatile components. It could be noticed that these groups did not correspond to chemical families of volatile species. For the first group, the production of the volatile species was shown to be generally independent of the torrefaction temperature. The exception was for 2 (5H)-furanone, slightly separated from the other three compounds in the group, as its production softly increased from 543 to 573 K [30], which is in agreement with its probable origin from cellulose and hemicelluloses degradation [41]. Vanillin production might be corre-lated to low torrefaction temperatures, which is in agreement with the release of substituted lignin monomers reported from low temperatures by the scission of α-O-4 (from 473 K) and β-O-4 lignin linkages [15,41].
The production of the second group, composed by isoeugenol, 2-furan-methanol and hydroxyacetone, seemed correlated to higher torre-faction temperatures. This behaviour was in agreement with the production profiles, which were characterized by local minima at 543 and 563 K, with a production particularly enhanced around 573 K [30]. The species included in the third group mainly presented an increasing production with increasing torrefaction temperature (propionic acid, guaiacol, acetylfuran, 3-furaldehyde, furan, 2-methoxy-4-vinylphenol, eugenol, cathecol and 2,3-pentanedione). In the case of phenols, the fact that the longer was the side chain substituent of the lignin-base units, the lower was the starting release temperature in torrefaction, except for vinyl derivatives [15,48], was checked in this case for vanillin, isoeugenol and guaiacol. Results on cathecol and eugenol are not considered as representative, due to their remarkable minor amount. To sum up, the production profiles of the volatile species seemed to Fig. 9. Loading plot of the PCA on the final solid mass loss in torrefaction
versus the potassium (K), silicon (Si) and phosphorous (P) content on the raw biomass samples. (For interpretation of the references to colour in this figure legend, the reader is referred to the Web version of this article.)
transformation patterns, while agricultural biomass and herbaceous crops behaviour remained heterogeneous. These results reinforced the theory that macromolecular composition has a critical impact on biomass behaviour in torrefaction.
3.2.3. Inorganic elements content
A PCA was carried out on the final solid mass loss of the 14 biomass samples of study at the end of the non-isothermal and the isothermal torrefaction stages, as well as on their content on potassium (K), silicon (Si) and phosphorous (P). 2 PC were selected, which represent 85.9% of the data variability (Fig. 9). According to the variables plot, the mass loss at the end of the non-isothermal and isothermal stages is slightly correlated, as the mechanisms impacting its behaviour are both related to the decomposition of the main biomass macromolecular components (cellulose, hemicelluloses and lignin), according to the literature [41, 42] and to the previous observations (Figs. 5 and 7). However, any clear correlation was found between final solid mass loss in torrefaction and K, Si or P biomass content. This indicates that the presence of these inorganic elements in biomass might not have any influence in the extent of biomass degradation through torrefaction.
3.3. Volatile species
PCA was carried out on the volatile species released in torrefaction and reported in Ref. [30]. Three variables were identified in this case, which corresponds to volatile species, biomass samples and torrefaction temperature. These factors were separated in two groups to facilitate PCA: the influence of temperature in the volatile species production in torrefaction for a selected biomass (beech) on the one side and the total volatile species production for the 14 biomass samples, without the in-fluence of temperature, on the other side.
3.3.1. PCA on beech data
The influence of temperature on the production of volatile species in torrefaction was assessed through PCA. A single biomass was consid-ered, beech, so as to discard the influence of the macromolecular composition on the volatile species production. Two objectives were defined:
Biomass and Bioenergy 134 (2020) 105474
be more impacted by the progression in the degradation of biomass macromolecular components, which happened simultaneously but in different extents in function of the torrefaction temperature, rather than by the chemical family to which belong a given volatile species. 3.3.2. PCA on raw biomass samples
The influence of the biomass type in the production of volatile spe-cies in torrefaction was assessed through PCA. To do this, the integration of the area below the production curve of each volatile species per biomass was considered [30], which represents the total production per volatile species. This analysis might lead to determine the influence of the biomass macromolecular composition on the volatile species pro-duction in torrefaction, as well as to group biomass samples in function of their similar volatile species production.
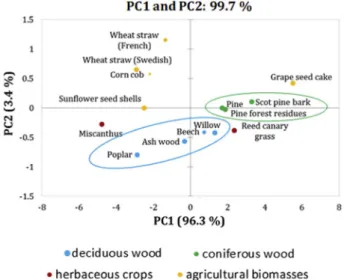
3.3.2.1. All biomass samples. A first PCA was carried out on the volatile species production of the 14 biomass samples (Fig. 12). As the high variability of the data made it extremely complicated to perform a PCA on all volatile species, only the 11 major volatile species were consid-ered. An attempt of classification of biomass samples (observations) in families of similar volatile species production (variables) was carried out.
80.1% of the variability was represented by selecting three PC. Three main groups of biomass samples were identified, which were indicated in Fig. 12 (PC1 and PC2 score plot). The first group corresponded to deciduous wood, in blue, and the second one, to coniferous wood, in green. Agricultural crops presented a higher variability and were not all grouped together in the yellow group. The behaviour of grape seed cake was close to that of coniferous wood, presumably because of its high lignin content [30], which leaded to a low volatile species release. Fig. 10. Loading plot (left) and score plot (right) of the PCA on all volatile species produced versus temperature in the non-isothermal torrefaction of 14
biomass samples.
Fig. 11. Loading plot (left) and score plot (right) of the PCA analysis on the minor volatile species produced versus temperature in the non-isothermal torrefaction of
14 biomass samples.
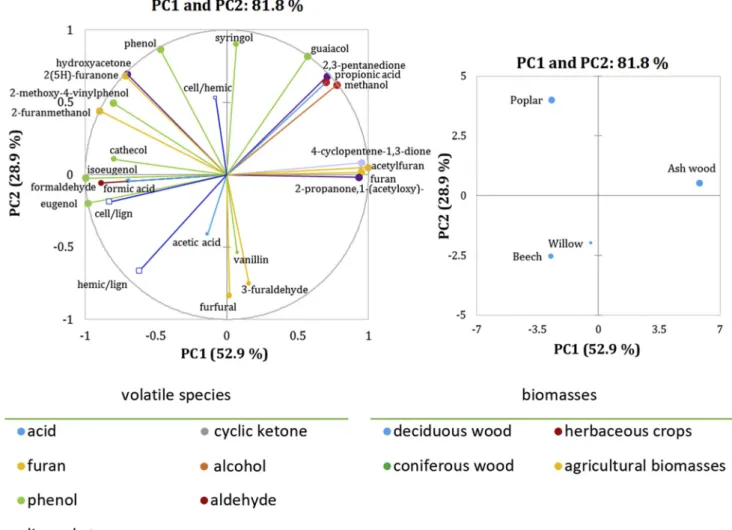
isoeugenol, formaldehyde, formic acid and eugenol production was minor (Fig. 13, left). In the case of poplar, hydroxyacetone, 2(H)-fura-none, 2-methoxy-4-vinylphenol and 2-furanmethanol were the major products released from its torrefaction. It is noticeable that volatile species from the same chemical family tended to be close, presenting similar production profiles and forming several clusters per family (Fig. 13, left).
When considering biomass macromolecular composition, ash-wood appeared to be correlated to the PC1 axis and thus anticorrelated to the cellulose/lignin ratio. Beech behaviour would be principally controlled by the hemicelluloses/lignin composition ratio. This ratio was anti-correlated to the production of methanol and 2,-pentanedione, which are known to be released from hemicelluloses [43]. The pro-duction of lignin-base phenolic compounds, namely syringol and guaiacol, tended to be anti-correlated to a decrease in lignin content [49, 50]. This might indicate that a decrease in lignin content leaded to a higher production of phenolic compounds, while a decrease in cellulose or hemicelluloses content leaded to furans and ketones release [7,41, 51]. These results were in agreement with deciduous wood main composition on cellulose and hemicelluloses, which principally produce furans, ketones and acids [7,24,41]. Their lower lignin content compared to coniferous wood was linked to the low production of phenolic compounds [41,49,52].
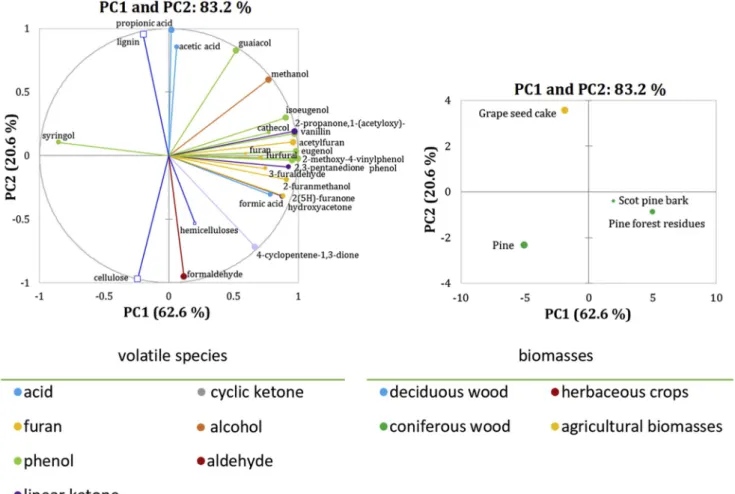
3.3.2.3. Coniferous wood. A second PCA was carried out on the volatile species released in the torrefaction of coniferous wood (pine, pine forest residues and Scot pine bark). Grape seed cake was added to this group due to its high lignin content [30]. In this case, cellulose, hemicellulose
Fig. 13. Loading plot (left) and score plot (right) of the PCA on the total volatile species production in torrefaction for deciduous wood. Volatile species behaviour was shown to be diverse, with similarities
between species from the same chemical nature (Fig. 12, left). However, the representation of the volatile species points was not very accurate, so this consideration needs to be taken into account carefully.
This PCA highlighted the similitudes in volatile species release for deciduous and coniferous wood, while agricultural crop behaviour was again shown to be more heterogeneous. In all cases, volatile species release seemed to be governed by biomass macromolecular composition. Similitudes might exist in the production of volatile species from the same chemical family, at least for major compounds.
In order to improve the representation of the total volatile species, as well as to consider all the volatile species quantified, PCA were carried out on the total production of the individual volatile species per biomass family. As biomass macromolecular composition is known to be the most influent factor on the nature of the volatile species released, it was included as supplementary variables in the analysis.
3.3.2.2. Deciduous wood. A PCA was carried out on the total volatile species production for the all quantified volatile species (23 chemical compounds) released in the torrefaction of deciduous wood (ash wood, beech, poplar and willow). The variability of the data was represented by 2 PC (81.8%).
A good representation of the observations was achieved (Fig. 13, right), except for willow. The combination of the loading plot and the score plot indicated that the major volatile species released for each deciduous wood in torrefaction were different. The production of 4- cyclopentene-1,3-dione, acetylfuran, furan and 2-propanone, 1-(acety-loxy)- was shown to be enhanced for ash-wood, while cathecol,
Biomass and Bioenergy 134 (2020) 105474
and lignin content were directly represented as supplementary vari-ables. 83.2% of the variability of the data was represented by 2 PC. The observations appeared to be well-represented (Fig. 14, right), except Scot pine bark.
The score plot showed different volatile species release for pine, pine forest residues and grape seed cake (Fig. 14, left). Overall, volatile species were grouped together per chemical family in the loading plot, except formic acid and syringol. They were not correlated to macro-molecular composition, except acetic acid and propionic acid, which were anti-correlated to cellulose content, and formaldehyde, which was anti-correlated to lignin content [44,45]. This might indicate that these compounds were released when cellulose or lignin content diminished [24,41,43,53]. Concerning the samples from the family, grape seed cake was correlated to lignin content and was not correlated to any particular volatile species, which was also the case of pine. Pine forest residues were correlated to most of phenols, furans and ketones and presented a higher production of these compounds compared to other coniferous woods. Cellulose and lignin content were the most significant differ-ences in the macromolecular composition of these biomass samples, which might explain the small influence of hemicelluloses content in this case.
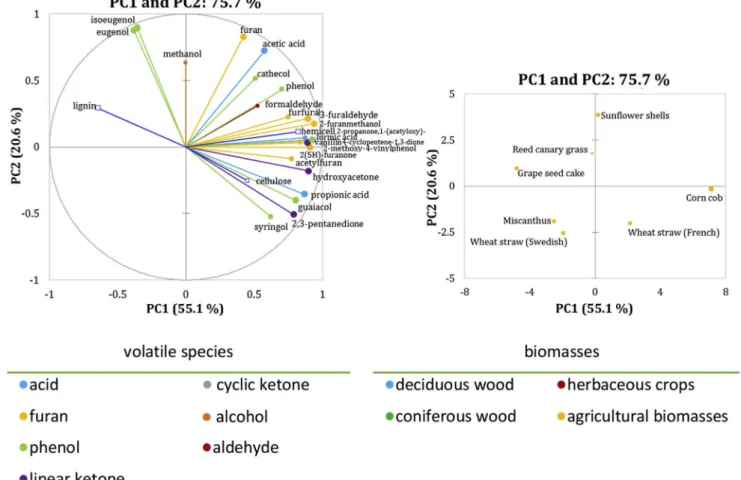
3.3.2.4. Agricultural and herbaceous crops. PCA of the volatile species released in the torrefaction of agricultural and herbaceous crops was carried out. By selecting 2 PC, the variability represented only achieves 75.7%, which is in agreement with the previous observation on the higher heterogeneity of the data. A loss of accuracy was marked in the smaller size of the observation points and on their dispersion (Fig. 15, left).
Concerning volatile species, the groups per chemical family seemed
worse-defined than in previous cases. Furans, some linear and cyclic ketones, formic acid and vanillin were particularly correlated to hemi-celluloses content and to the PC1 axis, which was in agreement to the origin reported for these compounds [37,41,54]. Corn cob presented particularly high hemicelluloses content and thus an important amount of volatile species released, pointed out by its correlation to the PC1 axis. Lignin-base units, namely guaiacol and syringol, were again anti-correlated to lignin content. Sunflower shells leaded to a higher production of isoeugenol, eugenol, furan and methanol than the other agricultural crops. The main difference on macromolecular composition of sunflower seed shells compared to the other biomass samples is its higher ash content [30], whose influence at in the torrefaction tem-perature range is still a doubtful [21,55,56]. Grape seed cake was again strongly correlated to a high lignin content, which leaded to a low volatile species release [41,52]. Interestingly, the two species of wheat straw showed dissimilarities in the volatile species release, which might be derived from their different origin, the small differences in their macromolecular composition or in their structural arrangement [57,58]. These results demonstrated the heterogeneity in agricultural crops also in terms of volatile species production, which leaded also to dif-ferences between volatile species released from the same chemical family. This also leaded to a less accurate representation of the obser-vations than that obtained in previous cases for deciduous and conif-erous wood.
4. Conclusions
In this work, PCA was shown as a suitable statistical tool to methodically assess a complex dataset composed by 14 woody and agricultural biomass samples analysed under identical operating
Fig. 14. Loading plot (left) and score plot (right) of the PCA on the total volatile species production in torrefaction for the coniferous wood and grape seed cake.
conditions and intending to represent biomass diversity. At the same time, this technique allowed to link both biomass characterization and its behaviour in torrefaction, so as to define the most suitable parameters to be considered for biomass torrefaction modelling.
PCA results highlighted that macromolecular composition is a suit-able parameter to assess variability in biomass characterization, while the main elemental composition (C, H, O, N) showed its limitations. Biomass characterization can be acceptably represented by cellulose, hemicelluloses and lignin content. The accuracy in representing data variability can be improved by considering extractives and ash content. A similar macromolecular composition and solid transformation behaviour through torrefaction were statistically proved thanks to PCA for biomass samples from deciduous and coniferous wood, respectively, while agricultural and herbaceous crops were shown to be more het-erogeneous. Biomass solid transformation through torrefaction was shown to be governed by the degradation of cellulose, hemicelluloses and lignin, while ash composition on potassium, silicon and phospho-rous might not impact the extent of solid degradation in the torrefaction temperature range.
By considering production profiles of the volatile species in function of the temperature, compounds from the same chemical family exhibited different behaviours. Furthermore, inside the same biomass family, a high variability was found in the total production of the quantified volatile species. This behaviour points out that biomass main macro-molecular composition impacts volatile species release in torrefaction in a higher extent than biomass family.
For further modelling of biomass behaviour in torrefaction, PCA results suggest that solid kinetics in biomass torrefaction could be modelled by considering one biomass per family, by taking into account the limitations of this assumption for agricultural crops. However, the modelling of volatile species production would require an enlarged
biomass database of chemical compounds detected and a larger number of raw biomass samples, particularly but not exclusively for agricultural crops. A more detailed description of biomass macromolecular compo-nents, such as cellulose and hemicelluloses sugar composition, may also be taken into account.
Acknowledgments
This project has received funding from the European Union’s Hori-zon 2020 research and innovation programme under grant agreement No 637020 MOBILE FLIP.
References
[1] European Commission, State of Play on the Sustainability of Solid and Gaseous Biomass Used for Electricity, Heating and Cooling in the EU, 2014. https://ec. europa.eu/energy/sites/ener/files/2014_biomass_state_of_play_.pdf. accessed September 28, 2016.
[2] T. Tamminen, M. Campargue, D. Da Silva Perez, C. Dupont, F. Englund, P. Kotli, S. Larsson, E. Papadopoulou, K. Rasa, T. Raussi, P. Sajet, M. Wallin, Presentation in the Open Seminar of the Mobile and Flexible Processing of Biomass EU Project MOBILE FLIP, Umea, Sweden, 2016 available at: https://www.mobileflip.eu/. [3] P. McKendry, Energy production from biomass (part 1): overview of biomass,
Bioresour. Technol. (2002) 37–46.
[4] E. Alakangas, EUBIONET3 - Classification of Biomass Origin in European Solid Biofuel Standard, 2011. http://www.eubionet.net/. accessed March 17, 2016. [5] H.B. Goyal, D. Seal, R.C. Saxena, Bio-fuels from thermochemical conversion of
renewable resources: a review, Renew. Sustain. Energy Rev. 12 (2008) 504–517, https://doi.org/10.1016/j.rser.2006.07.014.
[6] T. Nocquet, C. Dupont, J.-M. Commandre, M. Grateau, S. Thiery, S. Salvador, Volatile species release during torrefaction of wood and its macromolecular constituents: Part 1 – experimental study, Energy 72 (2014) 180–187, https://doi. org/10.1016/j.energy.2014.02.061.
[7] T. Nocquet, C. Dupont, J.-M. Commandre, M. Grateau, S. Thiery, S. Salvador, Volatile species release during torrefaction of biomass and its macromolecular constituents: Part 2 – modeling study, Energy 72 (2014) 188–194, https://doi.org/ 10.1016/j.energy.2014.05.023.
[8] R. Pentananunt, A.N.M.M. Rahman, S.C. Bhattacharya, Upgrading of biomass by means of torrefaction, Energy 15 (1990) 1175–1179, https://doi.org/10.1016/ 0360-5442(90)90109-F.
[9] W.-H. Chen, J. Peng, X.T. Bi, A state-of-the-art review of biomass torrefaction, densification and applications, Renew. Sustain. Energy Rev. 44 (2015) 847–866, https://doi.org/10.1016/j.rser.2014.12.039.
[10] E.M. Fisher, C. Dupont, L.I. Darvell, J.-M. Commandr�e, A. Saddawi, J.M. Jones, M. Grateau, T. Nocquet, S. Salvador, Combustion and gasification characteristics of chars from raw and torrefied biomass, Bioresour. Technol. 119 (2012) 157–165, https://doi.org/10.1016/j.biortech.2012.05.109.
[11] J.J. Harrington, R. Booker, R.J. Astley, Modelling the elastic properties of softwood. Part I: the cell-wall lamellae, Holz als Roh- Werkst. (1998) 37–41. [12] S.V. Pisupati, A.H. Tchapda, Chapter 15: thermochemical processing of biomass,
in: Adv. Bioprocess Technol., Pogaku Ravindra, Switzerland, 2015. [13] D. da Silva Perez, C. Dupont, A. Guillemain, S. Jacob, F. Labalette, S. Briand,
S. Marsac, O. Guerrini, F. Broust, J.-M. Commandre, Characterisation of the most representative agricultural and forestry biomasses in France for gasification, Waste Biomass Valorization 6 (2015) 515–526, https://doi.org/10.1007/s12649-015- 9374-3.
[14] S.S. Amaral, J.A. de Carvalho Junior, M.A.M. Costa, T.G.S. Neto, R. Dellani, L.H. S. Leite, Comparative study for hardwood and softwood forest biomass: chemical characterization, combustion phases and gas and particulate matter emissions, Bioresour. Technol. 164 (2014) 55–63, https://doi.org/10.1016/j.
biortech.2014.04.060.
[15] T. Ohra-aho, F.J.B. Gomes, J.L. Colodette, T. Tamminen, S/G ratio and lignin structure among Eucalyptus hybrids determined by Py-GC/MS and nitrobenzene oxidation, J. Anal. Appl. Pyrolysis 101 (2013) 166–171, https://doi.org/10.1016/j. jaap.2013.01.015.
[16] M. Kleen, G. Gellerstedt, Characterization of chemical and mechanical pulps by pyrolysis—gas chromatography/mass spectrometry, J. Anal. Appl. Pyrolysis 19 (1991) 139–152, https://doi.org/10.1016/0165-2370(91)80040-F.
[17] V. Becerra, J. Odermatt, M. Nopens, Identification and classification of glucose- based polysaccharides by applying Py-GC/MS and SIMCA, J. Anal. Appl. Pyrolysis 103 (2013) 42–51, https://doi.org/10.1016/j.jaap.2012.12.018.
[18] M.V. Gil, M.P. Gonz�alez-V�azquez, R. García, F. Rubiera, C. Pevida, Assessing the influence of biomass properties on the gasification process using multivariate data analysis, Energy Convers. Manag. 184 (2019) 649–660, https://doi.org/10.1016/j. enconman.2019.01.093.
[19] E. Bor�en, Off-gassing from Thermally Treated Lignocellulosic Biomass, 2017. htt ps://umu.diva-portal.org/smash/get/diva2:1157529/FULLTEXT01.pdf. [20] E. Barta-Rajnai, B. Babinszki, Z. Sebesty�en, S.I. Czirok, Z. May, E. Jakab,
Z. Cz�eg�eny, On the significance of potassium and chlorine content of lignocellulose during torrefaction, J. Anal. Appl. Pyrolysis 135 (2018) 32–43, https://doi.org/ 10.1016/j.jaap.2018.09.024.
[21] L.A. de Macedo, J.-M. Commandr�e, P. Rousset, J. Valette, M. P�etrissans, Influence of potassium carbonate addition on the condensable species released during wood torrefaction, Fuel Process. Technol. 169 (2018) 248–257, https://doi.org/ 10.1016/j.fuproc.2017.10.012.
[22] A. Strandberg, P. Holmgren, M. Brostr€om, Predicting fuel properties of biomass using thermogravimetry and multivariate data analysis, Fuel Process, Technol. 156 (2017) 107–112, https://doi.org/10.1016/j.fuproc.2016.10.021.
[23] M.J. Prins, K.J. Ptasinski, F.J.J.G. Janssen, Torrefaction of wood: Part 1. Weight loss kinetics, J. Anal. Appl. Pyrolysis 77 (2006) 28–34, https://doi.org/10.1016/j. jaap.2006.01.002.
[24] M.J. Prins, K.J. Ptasinski, F.J.J.G. Janssen, Torrefaction of wood. Part 2. Analysis of products, J. Anal. Appl. Pyrolysis 77 (2006) 35–40, https://doi.org/10.1016/j. jaap.2006.01.001.
[25] E. Ranzi, A. Cuoci, T. Faravelli, A. Frassoldati, G. Migliavacca, S. Pierucci, S. Sommariva, Chemical kinetics of biomass pyrolysis, Energy Fuels 22 (2008) 4292–4300, https://doi.org/10.1021/ef800551t.
[26] A. Anca-Couce, R. Mehrabian, R. Scharler, I. Obernberger, Kinetic scheme to predict product composition of biomass torrefaction, Chem. Eng. Trans. 37 (2014) 43–48, https://doi.org/10.3303/CET1437008.
[27] K. Dussan, S. Dooley, R. Monaghan, Integrating compositional features in model compounds for a kinetic mechanism of hemicellulose pyrolysis, Chem. Eng. J. 328 (2017) 943–961, https://doi.org/10.1016/j.cej.2017.07.089.
[28] K. Dussan, S. Dooley, R.F.D. Monaghan, A model of the chemical composition and pyrolysis kinetics of lignin, Proc. Combust. Inst. 37 (3) (2019) 2697–2704, https:// doi.org/10.1016/j.proci.2018.05.149.
[29] E. Peduzzi, G. Boissonnet, G. Haarlemmer, C. Dupont, F. Mar�echal, Torrefaction modelling for lignocellulosic biomass conversion processes, Energy 70 (2014) 58–67, https://doi.org/10.1016/j.energy.2014.03.086.
[30] M. Gonz�alez Martínez, C. Dupont, S. Thi�ery, X.-M. Meyer, C. Gourdon, Impact of biomass diversity on torrefaction: study of solid conversion and volatile species formation through an innovative TGA-GC/MS apparatus, Biomass Bioenergy 119 (2018) 43–53, https://doi.org/10.1016/j.biombioe.2018.09.002.
[31] M.L. Meyer, P.R. Bloom, Lithium metaborate fusion for silicon, calcium, magnesium, and potassium analysis of wild rice, Plant Soil 153 (1993) 281–285. [32] M. Trauth, MATLAB® Recipes for Earth Sciences, fourth ed., Springer-Verlag,
Berlin Heidelberg, 2015. http://www.springer.com/us/book/9783662462430. accessed August 22, 2018.
[33] L. Eriksson, T. Byrne, E. Johansson, J. Trygg, C. Vikstr€om, Multi-and Megavariate Data Analysis Part 1 Basic Principals and Applications, Unimetrics AB, 2001.
[34] D.K. Shen, S. Gu, The mechanism for thermal decomposition of cellulose and its main products, Bioresour. Technol. 100 (2009) 6496–6504, https://doi.org/ 10.1016/j.biortech.2009.06.095.
[35] V. Mamleev, S. Bourbigot, J. Yvon, Kinetic analysis of the thermal decomposition of cellulose: the main step of mass loss, J. Anal. Appl. Pyrolysis 80 (2007) 151–165, https://doi.org/10.1016/j.jaap.2007.01.013.
[36] A. Ebringerov�a, Z. Hrom�adkov�a, T. Heinze, Hemicellulose, in: T. Heinze (Ed.), Polysacch. I, Springer Berlin Heidelberg, 2005, pp. 1–67, https://doi.org/10.1007/ b136816.
[37] K. Werner, L. Pommer, M. Brostr€om, Thermal decomposition of hemicelluloses, J. Anal. Appl. Pyrolysis 110 (2014) 130–137, https://doi.org/10.1016/j. jaap.2014.08.013.
[38] M.J.C. van der Stelt, H. Gerhauser, J.H.A. Kiel, K.J. Ptasinski, Biomass upgrading by torrefaction for the production of biofuels: a review, Biomass Bioenergy 35 (2011) 3748–3762, https://doi.org/10.1016/j.biombioe.2011.06.023.
[39] W.-H. Chen, P.-C. Kuo, Isothermal torrefaction kinetics of hemicellulose, cellulose, lignin and xylan using thermogravimetric analysis, Energy 36 (2011) 6451–6460, https://doi.org/10.1016/j.energy.2011.09.022.
[40] A.D. Paulsen, M.S. Mettler, P.J. Dauenhauer, The role of sample dimension and temperature in cellulose pyrolysis, Energy Fuels 27 (2013) 2126–2134, https://doi. org/10.1021/ef302117j.
[41] F.-X. Collard, J. Blin, A review on pyrolysis of biomass constituents: mechanisms and composition of the products obtained from the conversion of cellulose, hemicelluloses and lignin, Renew. Sustain. Energy Rev. 38 (2014) 594–608, https://doi.org/10.1016/j.rser.2014.06.013.
[42] W.-H. Chen, P.-C. Kuo, Torrefaction and co-torrefaction characterization of hemicellulose, cellulose and lignin as well as torrefaction of some basic constituents in biomass, Energy 36 (2011) 803–811, https://doi.org/10.1016/j. energy.2010.12.036.
[43] D.K. Shen, S. Gu, A.V. Bridgwater, Study on the pyrolytic behaviour of xylan-based hemicellulose using TG–FTIR and Py–GC–FTIR, J. Anal. Appl. Pyrolysis 87 (2010) 199–206, https://doi.org/10.1016/j.jaap.2009.12.001.
[44] E. Jakab, O. Faix, F. Till, T. Sz�ekely, Thermogravimetry/mass spectrometry study of six lignins within the scope of an international round robin test, J. Anal. Appl. Pyrolysis 35 (1995) 167–179, https://doi.org/10.1016/0165-2370(95)00907-7. [45] Q. Liu, S. Wang, Y. Zheng, Z. Luo, K. Cen, Mechanism study of wood lignin
pyrolysis by using TG–FTIR analysis, J. Anal. Appl. Pyrolysis 82 (2008) 170–177, https://doi.org/10.1016/j.jaap.2008.03.007.
[46] S. Wang, B. Ru, H. Lin, W. Sun, Pyrolysis behaviors of four O-acetyl-preserved hemicelluloses isolated from hardwoods and softwoods, Fuel 150 (2015) 243–251, https://doi.org/10.1016/j.fuel.2015.02.045.
[47] E. Rodriguez Alonso, C. Dupont, L. Heux, D. Da Silva Perez, J.-M. Commandre, C. Gourdon, Study of solid chemical evolution in torrefaction of different biomasses through solid-state 13C cross-polarization/magic angle spinning NMR (nuclear magnetic resonance) and TGA (thermogravimetric analysis), Energy 97 (2016) 381–390, https://doi.org/10.1016/j.energy.2015.12.120.
[48] M. Gonz�alez Martínez, T. Ohra-aho, D. da Silva Perez, T. Tamminen, C. Dupont, Influence of step duration in fractionated Py-GC/MS of lignocellulosic biomass, J. Anal. Appl. Pyrolysis 137 (2019) 195–202, https://doi.org/10.1016/j. jaap.2018.11.026.
[49] J. Kibet, L. Khachatryan, B. Dellinger, Molecular products and radicals from pyrolysis of lignin, Environ. Sci. Technol. 46 (2012) 12994–13001, https://doi. org/10.1021/es302942c.
[50] L. Chen, X. Wang, H. Yang, Q. Lu, D. Li, Q. Yang, H. Chen, Study on pyrolysis behaviors of non-woody lignins with TG-FTIR and Py-GC/MS, J. Anal. Appl. Pyrolysis 113 (2015) 499–507, https://doi.org/10.1016/j.jaap.2015.03.018. [51] M. Gonz�alez Martínez, C. Dupont, D. da Silva Perez, L. Míguez-Rodríguez,
M. Grateau, S. Thi�ery, T. Tamminen, X.-M. Meyer, C. Gourdon, Assessing the suitability of recovering shrub biowaste involved in wildland fires in the South of Europe through torrefaction mobile units, J. Environ. Manag. 236 (2019) 551–560, https://doi.org/10.1016/j.jenvman.2019.02.019.
[52] D. Chen, A. Gao, K. Cen, J. Zhang, X. Cao, Z. Ma, Investigation of biomass torrefaction based on three major components: hemicellulose, cellulose, and lignin, Energy Convers. Manag. 169 (2018) 228–237, https://doi.org/10.1016/j. enconman.2018.05.063.
[53] Y. Peng, S. Wu, The structural and thermal characteristics of wheat straw hemicellulose, J. Anal. Appl. Pyrolysis 88 (2010) 134–139, https://doi.org/ 10.1016/j.jaap.2010.03.006.
[54] D.K. Shen, S. Gu, A.V. Bridgwater, The thermal performance of the polysaccharides extracted from hardwood: cellulose and hemicellulose, Carbohydr. Polym. 82 (2010) 39–45, https://doi.org/10.1016/j.carbpol.2010.04.018.
[55] T. Khazraie Shoulaifar, N. DeMartini, O. Karlstr€om, M. Hupa, Impact of organically bonded potassium on torrefaction: Part 1, Experimental, Fuel 165 (2016) 544–552, https://doi.org/10.1016/j.fuel.2015.06.024.
[56] S. Zhang, Y. Su, K. Ding, S. Zhu, H. Zhang, X. Liu, Y. Xiong, Effect of inorganic species on torrefaction process and product properties of rice husk, Bioresour. Technol. 265 (2018) 450–455, https://doi.org/10.1016/j.biortech.2018.06.042. [57] P.F.H. Harmsen, W.J.J. Huijgen, L.M. Bermúdez L�opez, R.R.C. Bakker, Literature
Review of Physical and Chemical Pretreatment Processes for Lignocellulosic Biomass, Energy Research Centre of the Netherlands, september 2010 report number ECN-E–10-013.
[58] G. Henriksson, J. Li, L. Zhang, M.E. Lindstr€om, Chapter 9: lignin utilization, in: Thermochemical Conversion of Biomass to Liquid Fuels and Chemicals, 2010, https://doi.org/10.1039/9781849732260. PDF eISBN 978-1-84973-226-0.