Substructure Damage Detection by Principal Component Analysis: Application to Environmental Vibration Testing
Pascal De Boe(1), Yan Ai-Min(2), Jean-Claude Golinval(3) Département AéroSpatiale Mécanique et MAtériaux (ASMA)
LTAS – Vibrations et Identification des Structures, Université de Liège
Chemin des chevreuils, 1, Bât. B52 B-4000 Liège, Belgium.
Phone : +32 4 366 48 53 Fax : +32 4 366 48 56
ABSTRACT
This paper deals with the application of statistical process control techniques based on principal component analysis to vibration-based damage diagnosis of structures. It is well known that localized structural damages with relative small amplitude may not much affect the global modal response of the structure, at least at low frequencies. Nevertheless, it can be expected that the local dynamic behavior of the damaged structural component is significantly affected. By applying principal component analysis on the sensor time responses, it may be shown that any change of a particular sensor will affect the subspace spanned by the response of the complete sensor set. The subspace corresponding to the damaged structure can then be compared with the subspace of an initial state in order to diagnose possible damages. The problem of structural damage detection is addressed in the case of a fatigue test by means of an electro-dynamic shaker. In this example, monitoring of the structural responses is performed during a qualification test in order to detect any structural damage.
1. INTRODUCTION
Equipment in service is subjected to various external actions that vary in their degree of severity. Such an action may cause structural vibrations, produced by, e.g. the wind and transportation loading. In order to ensure that the concerned equipment can withstand the vibration constrains, vibration testing can be used to determine how it will respond to certain loadings without sustaining any damage.
_____________
Pascal De Boe, Yan Ai-Min, Jean-Claude Golinval, LTAS-VIS, Université de Liège, 1, Chemin des Chevreuils, B52, B-4000 Liège, Belgium
Email : pdeboe@ulg.ac.be, am.yan@ulg.ac.be, jc.golinval@ulg.ac.be
The goal of a vibration control test is then to introduce prescribed vibration levels at the base of the specimen. The specimen is generally installed on an electro-dynamic exciter that is driven with a given signal. Accelerometers are instrumented on the specimen in order to measure the structural vibrations. The figure 1 presents a typical set-up for a vibration qualification test.
specimen
electro-dynamic shaker
power amplifier
control group structural responses
base vibration level
measurements
shaker input
signal conditioners
Figure 1. Typical set-up for vibration testing
Depending on vibration standards, the equipment has to be validated for different kinds of time-consuming vibration qualification tests, such as sine sweep, sine dwell, random, shock or combined modes. Generally, the vibration signals of the equipment are recorded before and after the qualification test. Structural damages can then be identified by comparing, one by one, the frequency spectrum of each structural sensor. However, in practice, this methodology presents some disadvantages such as the difficulty to manage the large number of data and the fact that spectrum comparison can be performed only after the qualification test.
The goal of this paper is to propose a means to monitor the structural integrity of the tested equipment during the qualification test, specifically under random (stochastic) excitation. The operator could be able to state if structural damages are occurring and then to abort the test before its full completion. It is important to note that the proposed method does not require the knowledge of the excitation.
2. THE PROBLEM OF THE DAMAGE DETECTION
The detection of a structural damage by an experimental and non-destructive way is a problem whose complexity will depend, not only on the operational conditions under which measurements can be carried out (is the structure under operation?), but also on the level of knowledge needed for the characterization of the damage. Rytter [1] distinguished four diagnosis levels, with increasing complexity, relating to the problem of the detection of damages:·
level 1: detection of the damage,· level 2: localization of the damage,·
level 3: determination of the degree of severity of the damage,· level 4: estimate of the residual lifespan.
In this paper, only damage detection (level 1) and localization (level 2) will be considered.
These last years saw the appearance of methods based on the identification of structures subjected to a stochastic excitation. For example, Hermans and Al [2], Bassevile and Mevel [3], identify the modal parameters of the structure using a stochastic subspace identification algorithm.
The principal component analysis (PCA), applied to measured structural responses, can be also used to highlight the presence of a structural damage. While the control and chemical engineering communities have considered the PCA for the sensor validation problem, it had not caught the attention of structural dynamics community until recently. Principal component analysis, also know as Karhunen-Loeve decomposition and Proper Orthogonal Decomposition (POD), is emerging for the parameter identification of non-linear mechanical systems (Lenaerts et al. [4]). By inspecting subspace angles, Friswell and Inman [5] have studied the sensor validation problem for smart structures. [6] investigates a low amplitude damage detection technique by using PCA on piezo-laminates responses.
3. THEORY OF PRINCIPAL COMPONENT ANALYSIS
Let's consider a structure instrumented by ns sensors, where structural response time series of length b are recorded for tj+1 tj b+ . These data are gathered in a
rectangular matrix of dimensions ns×b, with b>>ns.
( )
( )
( )
( )
( )
( )
s s 1 j+1 1 j+b n j+1 n j+b q t q t t t q t q t j j b Q q + q + ⎡ ⎤ ⎢ ⎥ ⎢ ⎥ ⎡ ⎤ =⎣ = ⎦ ⎢ ⎥ ⎢ ⎥ ⎣ ⎦ 1 (1) 3.1 Data normalizationOne can calculate the mean value mn of the samples measured on the sensor n, as well as the corresponding standard deviation σn:
( )
( )
σ m q t b q t m b b n n j i i b n n j i n i + = + = = ⎡ ⎤ = ⎣ − ⎦ ∑ ∑ 1 2 2 1 1 1 (2)It is judicious to delete the mean values
(
m m1, 2, ,mns)
so that the data becomeThere exist also scale heterogeneities: the more one sensor response has a high standard deviation and the more it will influence the comparison. When various types of sensors are used simultaneously, it may be necessary to carry out a normalization by replacing each observation by:
( )
q t( )
σ m q tn j i n j i n i =1… b n for + + − = (3)3.2 Computation of the principal components
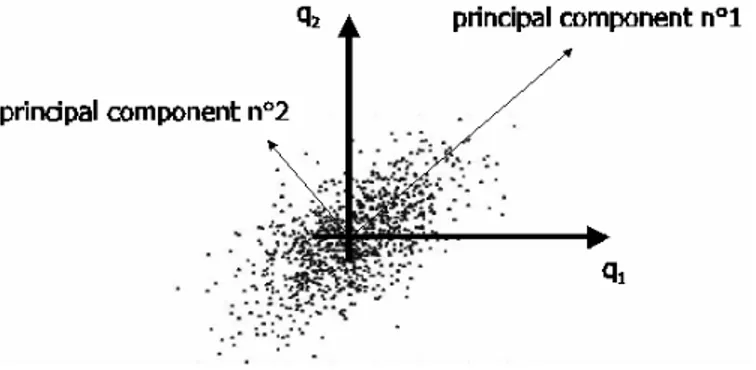
The analysis in principal components seeks first a subspace of dimension 1, therefore an axis, which passes as well as possible through the whole of the data. One carries out then the calculation of a second axis which will project the residue of the cloud of initial data on this second axe… and so on, until the calculation of the ns
th
axis. The figure 2 presents an example of analysis in principal components applied to a group of observations in two dimensions.
Figure 2. Principal component analysis in two dimensions
The singular value decomposition (SVD) constitutes an effective means of determination of the principal components. By applying the singular value decomposition to the matrix of observations Q, one obtains the following equality:
Q U= Σ V′ (4)
U is a orthonormal matrix
(
ns×ns)
, its columns form the hyper-plane of theprincipal components, in which stands all the observations q t
( )
i j+ . Each column ofU is associated with the coefficients of the matrix V
(
b b×)
, representating the time amplitudes of the principal components. The principal diagonal of the matrix Σ, of dimensions(
ns×b)
, gives the singular values, sorted by descending order, of thematrix Q. The singular values represent the importance of each principal component. In the structural case, this means that the structural motions will preferentially be directed according to the principal directions related to the greatest singular values. Lower singular values are strongly dependent on the noise process and should be discarded from the principal component base.
In most cases, the duration of the observations is very large (b ). It is then much more economic to apply the singular value decomposition to Q Q′ in order to extract the principal components:
2
Q Q′=U Σ U′ (5)
3.3 Geometrical relation between structural modes and principal components
For a limited frequency bandwidth (e.g., by means of anti-aliasing filters required for data sampling), the sensor responses q
( )
t are constrained to lay in the subspace spanned by the participating structural modes and the residue of higher frequency modes:( )
m(
)
( )
( )
T i i r i Q t S α t R α t = =∑ ⋅Φ ⋅ + ⋅ 1 (6) where S is the sensor influence matrix, R is the global residue of the higherfrequency modes and αi
( )
t and αr( )
t are the modal coordinates.On the other hand, the equation (4) can be expressed in a time dependant form:
( )
( )
t s n i i Q t U V U β = ′ = Σ =∑ ⋅ 1 (7)By comparing (6) and (7), we observe that the principal directions extracted from test data always lay in the subspace (or called hyper-plane) generated by the modes (see figure 3). Mathematically speaking, this means that the so-called principal hyper-plane is invariant, even if the directions of the principal vectors are dependent on the structural excitation. The PCA may be then considered as a straightforward approach to compute a metric of test data and to detect a potential structural damage by comparing structural reference and current states.
3.4 Angles between subspaces
One way to compare hyper-plane is to use the concept of angles between two subspaces as shown in figure 3. This concept, introduced by Golub et al. [7], allows quantifying the spatial coherence between two time-history blocks of an oscillating system. Let A∈ℜnsxp and B∈ℜnsxq
(
p≥q)
each with linearly independent columns.First, performing a QR factorization allows to compute the orthonormal bases of A
and B: xq n B B B xp n A A A s s Q R Q B Q R Q A ℜ ∈ = ℜ ∈ = (8) Thus, the singular values of QTAQB define q cosines of the principal angles θi
between A and B:
(
Q Q)
diag(
( )
)
i qSVD T B i
A ⎯⎯→ cosθ =1… (9)
The largest angle allows to quantify how the subspaces A and B are globally different.
φ1
φ2 U1
U2
Figure 3 The principal components and the concept of angle between subspaces
3.5 Detection of the damaged substructure
As already mentioned in the introduction, [5] gives the general principle for the detection of a damaged sensor by considering the subspace of the response compared to the subspace generated by the analytical mode shapes of the structure. The idea of this paper is to rather compare response subspaces between initial and current states. The problem is reduced to identify which sensor set affects mostly the sensor subspace. Sensors are split into two groups: those assumed damaged and those assumed undamaged. By assuming that small damages do not affect significantly the global structural dynamics but affect directly the response of the involved sub-structure, the undamaged sensor subspace will not exhibit appreciable differences between reference and damaged states. Practically, the identification of the damaged substructure is performed by computing the subspace angle between the pre- and post-damaged states; the angle will be minimum when the damaged substructure monitoring sensors are discarded from the working sensor subset.
a) b)
Figure 4 Tested condensers a) fixed on the electro-dynamic exciter b)
4. APPLICATION
4.1 Test set-up
The tested structure consists of an assembly of electrical condensers fixed on an interface plate (see figure 4a). The figure 4b shows the assembly installed on the
slip table of an electro-dynamic shaker (26.6 kN). A random (2.5 gRMS, [5-200 Hz]) seismic excitation is produced by the shaker while accelerometers are continuously monitoring the vibration amplitudes on each condenser. The total test duration is around of 10 minutes. After several minutes of test, a crack appears at one of the condensers close to the fixation, until its break completely. The mode of failure is presented on figure 5.
Figure 5 Mode of failure
4.1 Failure detection by principal components analysis on observations
The observation records are splitted into overlapped windows of 4 seconds. The principal components analysis is then performed on each window. The deviation between the reference observations (where the structure is assumed undamaged) and the current observations can then be checked by using the concept of angle between subspaces.
The figure 6a shows the evolution of the angle along the time. It is interesting to note that the angle criterion clearly shows the evolution of failure in the condenser, until it breaks completely.
On the other hand, due to the fact that each condenser can be considered as a substructure which presents a weak coupling with the others, the angle discrepancy remains low when the sensors related to the damaged condenser are discarded from the observations (see figure 6b).
5. CONCLUSIONS
This paper outlines the use of the principal component analysis and the concept of angle between subspaces to detect damages during vibration test on electro-dynamic shaker. This method gives good results and is able to monitor the evolution of a failure. Moreover, this proposed procedure presents a quite cheap computational cost and, therefore, seems very promising for an on-line monitoring implementation where an operator could be able to state if structural damages are occurring and then to abort the test before its full completion.
a) b) Figure 6 Detection of the damage a) and localization b)
ACKNOWLEDGEMENT
This work is supported by a grant from the Walloon government as a part of the convention n°9613419.
REFERENCES
[1] Rytter, A. (1993). Vibration based inspection of civil engineering structures. Ph.D. Dissertation. Department of Building Technology and Structural Engineering, 1993, Aalborg University, Denmark.
[2] Hermans, L. Van Der Auweraer, H., Mevel, L. (1999). Application of subspace-based fault detection method to industrial structures. Mechanical Systems and Signal
Processing. 13(6), 823-838.
[3] Basseville, M., Mevel, L.Chang, (2002). Output-only stochastic subspace-based structural identification and damage detection and localization. Proceedings of the
1st International European Workshop on Structural Health Monitoring. (pp.
229-236).
[4] Lenaerts, V., Kershen, G., Golinval, J.-C. (2001). “Proper Orthogonal Decomposition for Model Updating of Non-Linear Mechanical Systems,"
Mechanical Systems and Signal Processing, 15(1): 31-43.
[5] Friswell, M. I. and Inman, D. J. (2000). “Sensor Validation for Smart Structures,” presented at the 18th International Modal Analysis Conference (IMAC-XVIII), San Antonio, February 2000.
[6] De Boe P., Golinval, J.-C. (2003). “Principal component analysis of piezo-sensor array for damage localization" Structural Health Monitoring: An International
Journal, 2(2): 137-144.
[7] Golub, G. H., Van Loan, C. F. (1996). Matrix Computations. Baltimore, The Johns Hopkins University Press, pp. 603-604