Dionne: Canada Research Chair in Risk Management, HEC Montréal and CIRPÉE
Address Correspondence: Canada Research Chair in Risk Management, HEC Montréal, 3000 Côte Ste-Catherine, Montréal, QC Canada H3T 2A7; tel.: 514 340-6596; fax: 514 340-5019
georges.dionne@hec.ca
Desjardins: Canada Research Chair in Risk Management, HEC Montréal, Canada Lebeau: Canada Research Chair in Risk Management, HEC Montréal, Canada Messier: Canada Research Chair in Risk Management, HEC Montréal, Canada Dascal: McGill University, Canada
The findings and conclusions of this paper are those of the authors and do not imply endorsement by any component of Harvard University or other sponsors of this workshop. Comments should be directed to the authors.
Cahier de recherche/Working Paper 14-16
Health Care Workers’ Risk Perceptions of Personal and Work
Activities and Willingness to Report for Work during an Influenza
Pandemic
Georges Dionne Denise Desjardins Martin Lebeau Stéphane Messier André Dascal Mars/March 2014
Abstract:
The ability and willingness of health care workers to report for work during a pandemic are essential to pandemic response. The main contribution of this article is to examine the relationship between risk perception of personal and work activities and willingness to report for work during an influenza pandemic. Data were collected through a quantitative Web-based survey sent to health care workers on the island of Montreal. Respondents were asked about their perception of various risks to obtain index measures of risk perception. A multinomial logit model was applied for the probability estimations, and a factor analysis was conducted to compute risk perception indexes (scores). Risk perception associated with personal and work activities is a significant predictor of intended presence at work during an influenza pandemic. The average predicted probability of being at work during the worst scenario of an influenza pandemic is 46% for all workers in the sample, 36% for those overestimating risk in personal and work activities (95% CI: 35%-37%), 53% for those underestimating risk in work activities (95% CI: 52%-54%), and 49% for those underestimating risk of personal activities (95% CI: 48%-50%). When given an opportunity to change their intentions, 45% of those who initially did not intend to report for work in the worst scenario would do so if the pandemic resulted in a severe manpower shortage. These results have not been previously reported in the literature. Many organizational variables are also significant. Keywords: Influenza pandemic, pandemic preparedness, risk perception, reporting for work, health policy, personal and work activities
3
1. Introduction
Empirical evidence suggests that risk perception affect risk behavior. Those who underestimate the risk of lung cancer smoke more (1,2) and those who underestimate the risk of being arrested with impaired driving commit more violations to the Highway Safety Code and have more road accidents (3). These results concern the direct link between risk taking behavior and risk perception of that risk. They do not consider the link between a more general index of risk perception and risk behavior. Such relationship is important for anticipating the behavior of individuals for a new risk for which we do not have information on past experience such as a new influenza pandemic (IP).
Major infectious disease outbreaks such as an IP are a threat to public health. One concern is whether health care workers (HCWs) will report for work (RFW) during such outbreaks. It is important for public health management to assess the likelihood that HCWs would report for work and identify the factors that affect their decision.
HCWs’ ability and willingness to report for work during a pandemic are essential to pandemic response and have been studied by many researchers.(4-29) Ability refers to the capability to report for work while willingness refers to the personal decision to report for work.(4,6,7) In this study, we do not separate these two concepts; our research design focuses on the willingness aspect of the decision to report for work. The perception of the risks associated with various events and activities may partly explain HCWs’ willingness to report for work during a pandemic. If risk perception is a significant factor, in the sense that some health workers are not correctly judging the risk, correcting perceptual biases should be a public policy
4
Previous studies have documented a relationship between risk perception of an IP and health care workers’ intention of reporting for work.(8-10,31) To our knowledge, no study has considered the influence of bias in risk perception of work and personal activities on RFW. This article examines this influence by analyzing the relationship between risk perception of personal and work activities and perception of a potential H5N1 IP on RFW. Our focus is on the effect of perceived likelihood of events on HCWs willingness to report for work.
The primary objective of this article is to create indexes of HCWs’ risk perception and studying the relationship between risk perceptual bias and willingness to report for work during an influenza pandemic. Our research design is limited to voluntarily reporting for work and does not consider required reporting for work.(9-10) Three types of risk perception are analyzed: risk perception of influenza pandemic, risk perception of work activities, and risk perception of personal activities. For each type of risk perception, risk perception scores (indexes) from factor analyses are created to measure risk perception biases that can affect the decision to report for work during an influenza pandemic. The secondary objectives are to i) determine the expected rate of reporting for work of HCWs during an evolving pandemic (H5N1) wave of mild to moderate severity; ii) identify organizational factors other than risk perception scores that influence RFW during a pandemic (e.g. access to transportation, safety at work, and preparation for, and role at workplace during a pandemic); iii) identify the main barriers to willingness of HCWs to report for work and the main suggested measures to minimize the impact of a
pandemic; and iv) ascertain the extent to which the initially expressed intention of not reporting for work is reversible, and under which circumstances. The primary objective and the last secondary objective have not been previously studied in the literature.
Voluntary risk acceptance is mainly affected by risk perception, whereas individual risk perception is influenced by personal factors.(32-35) In the first part of our research design we
5
isolate the personal factors that affect individual risk perception and create indexes of risk perception. Then we relate reporting for work intention to individual estimated risk perception indexes and organizational factors.
The main hypothesis of our research design is that risk perceptions of personal and work activities are more accurate than the perception of a previously unseen pandemic risk to measure the effect of risk perception on intention to report for work in a pandemic, because HCWs regularly face personal and work activity risks and manage these risks according to their risk perceptions while unseen pandemic risks are more vague and often unknown for them. To our knowledge this hypothesis has not been tested in the literature.
2. Methods
Table 1 describes the seven steps of the methodology. (Table 1 here) 2.1. Step 1: Survey and profession misidentification
2.1.1. Survey
From April 17, 2008 to January 29, 2009, all HCWs in health professions practicing on the island of Montreal, as well as administrative and support staffs in 11 health care institutions in the same geographical area, were invited to participate in an anonymous, cross-sectional Web-based survey. The survey period ended before the Novel Influenza A (H1N1) first pandemic wave began. Sixteen health professions assisted by inviting their members to participate in the survey. To reach administrative and support staff workers, we enlisted the collaboration of 11 health care institutions with a total of 27,324 administrative and support workers with the following distribution: 4 hospitals (18,063 workers), 5 health and social services centers (6,122 workers), and 2 youth and public rehabilitation centers (3,139 workers). The survey was
6
administered by an independent firm, SOM (Strategy Organization and Method). The questionnaire is available from the authors.
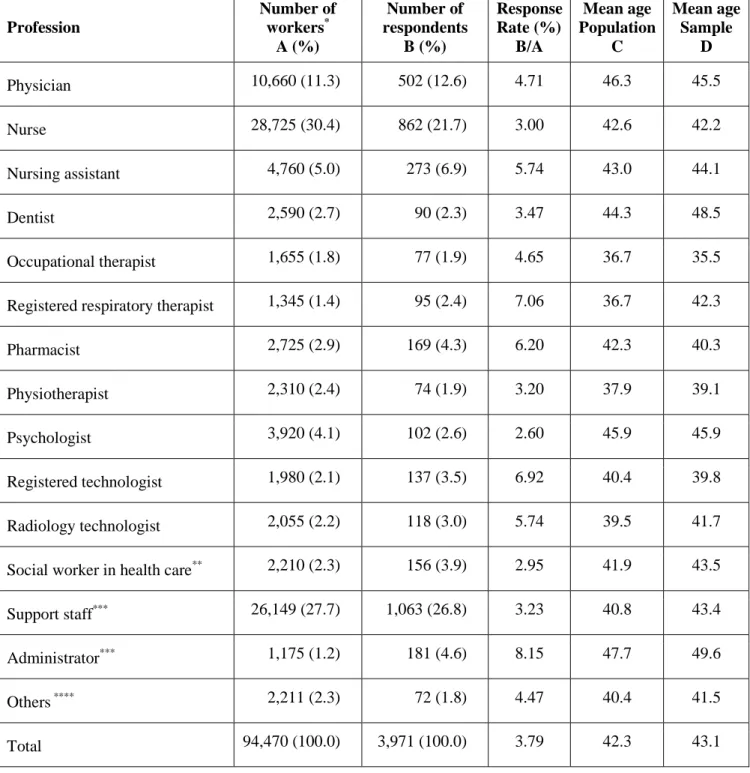
Table 2 details the number of HCWs on the island of Montreal and the number of respondents. Column A reports the population of healthcare workers on the island of Montreal. The information on the population comes from three sources: Statistics Canada for 15 health professions, the social workers association for their members working in the health care sector, and the eleven healthcare institutions that collaborated with the survey. A total of 3,971 workers participated in the survey for an overall response rate of 3.79%, varying from 2.60% to 8.15% depending on the profession. Columns C and D present the mean age of each profession for the population and the respondents, respectively. Because the response rates vary among professions and age groups, we take these differences into account by using a normalized weight in the estimation of the probabilities to obtain results on the population base and eliminate potential bias. The estimation results thus represent the non-respondents because they are adjusted to the population base.
(Table 2 here)
2.1.2. Profession misidentification
HCWs from the mailing lists of the eleven institutions participating in the survey were targeted as Support Staff and Administrators. Many of the respondents (372) either identified themselves as a member of a health profession or did not answer to the survey question that asked for their main profession or activity. Other workers (16) either identified themselves as members of a profession other than the ones used in the mailing lists, or did not indicate a profession (9). We do not consider these 397 workers as members of any profession in the first analyses done with 3,574 observations, but we evaluate the effect of this choice in a robustness or sensitivity analysis with the 3,971 workers of the sample.
7
2.2. Step 2: Treatment of missing data
We had to deal with potential bias of non-responses to some of the questions. To
eliminate potential bias due to non-responses to some questions, we usedthe multiple imputation (MI) method.(36) We did 100 imputations to obtain 100 complete data sets and performed our analyses on each data set. The parameter estimates of the 100 separate analyses were then
combined into a single value by applying PROC MIanalyze in SAS version 9.3. We used the total variance associated with the parameter estimates, which is a combination of between-imputation variance and within-imputation variance, to compute the confidence intervals of the odd ratios. As a sensitivity analysis, the results of imputed analysis werecompared with those of another analysis with a missing variable category.
2.3. Step 3: Risk Perception
We asked seven questions on risk perception of an influenza pandemic and on personal and work activities (see Table 3). To obtain the corresponding perceptual biases, HCWs were asked questions allowing comparisons between their responses and certain benchmarks.(1,3) The corresponding benchmarks were chosen prior to the survey based on previously published data and the team members’ experience. For each question, we defined perception of risks as overestimated, underestimated, unbiased (benchmark), and unable to answer this question.
(Table 3 here)
Given the choice of two methodologies to measure bias in risk perception −using either risk perceptions stated by individuals (response to questions in the survey) or the predicted probabilities of overestimated, underestimated, and unbiased risk perception− we opted for the predicted conditional probability approach. By estimating the predicted probabilities, we solve the potential endogeneity problem associated with risk perception.(3) Some individuals may deny the dangers associated with certain habits to be able to raise their comfort level and thus continue
8
them. For example, smokers may convince themselves that smoking is not dangerous for their health, and drinkers may convince themselves that drinking and driving is not dangerous. The four categories (overestimated; underestimated, unbiased, unable to answer this question) of the seven questions were treated qualitatively. They represent the dependent variables of the
multinomial logit model. Seven multinomial logit models were estimated; one for each question in Table 3 and 100 times each. For each dependent risk perception question (e.g. lung cancer), we used the corresponding behavior or knowledge of HCWs (e.g. smoking, see Table 3) as an
explanatory variable in the model. Workers not exposed to a given risk (see, for example, question 18 in Table 3 and the corresponding behavior) could answer “Does not apply to my situation.” These answers were considered as a category in the multinomial logit analysis.
In addition, nine personal variables originating from the survey are included in the model as control variables: number of children under 14, responsibility for people with limited
autonomy, workplace; profession, full-time work, personal health, years of experience in the health sector; main task as a worker in the health sector, and whether their work put them in frequent and regular contact with patients. These personal variables are introduced in the model to minimize the potential endogeneity problem discussed above and to predict the individuals’ risk probabilities. They differ from the organizational variables of the presence at work model (to be presented later) to reduce a potential multi-collinearity problem in estimating the probability of being present at work during an influenza pandemic because the predicted probabilities of risk perception that generate the risk perception scores are function of personal characteristics. As mentioned in the introduction, our analysis has two parts: first we analyze individual risk perception as a function of personal characteristics and then we relate reporting for work intention to estimated individual risk perception and organizational factors.
9
2.4. Step 4: Factor Analysis
We used factor analysis (37) to compute risk perception scores (or indexes), which are a combination of the predicted probability estimates of three types of risk perception: risk perception of influenza pandemic, risk perception of work activities, and risk perception of personal activities. We performed three factor analyses, one for each risk perception:
underestimated risk, overestimated risk, or unbiased risk perception. Our goal was to reduce the number of predicted probabilities (19) estimated by the seven multinomial logit models described above (seven predicted probabilities of overestimated risk, five predicted probabilities of
underestimated risk, and seven predicted probabilities of unbiased risk perception) into a smaller set of variables called principal components (PC) that account for most of the variance of the predicted probabilities. This approach is based on an analysis of the covariance matrix of the underlying risk perceptions, which captures the correlation among predicted probabilities. We applied the Kaiser criterion (38) to retain and interpret the principal components that account for a meaningful amount of variance. We used the principal component method to estimate the values of the loadings, which are equivalent to correlations between predicted probabilities and
components. We considered a loading salient or sufficiently large when its absolute value exceeds 0.40. Finally, we used the regression-based factor scores method (Proc score in SAS) to estimate individuals’ risk perception scores (RPS) for measuring the effect of risk perception in the analysis of reporting for work during an influenza pandemic.
2.5. Step 5: Influenza pandemic scenarios and reporting for work during an influenza pandemic
2.5.1.Influenza pandemic scenarios for dependent variables
Three IP scenarios affect reporting for work (RFW) during an influenza pandemic. They correspond to three simulated weeks of a potential IP wave in Montreal (MTL) four weeks after a
10
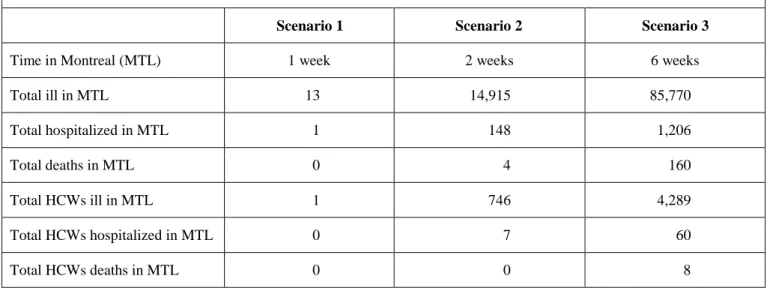
pandemic declaration by the WHO. For each scenario, the number of hospitalizations and deaths was derived using FluSurge 2.0 (attack rate of 15% and mortality rate of 0.23%). The information from the three scenarios is summarized in Panel A of Table 4. The same wording was used for the presentation of the three scenarios; only the numbers were changed. The third scenario was presented to the HCWs as follows: “Six weeks since the first cases were reported in Montreal, a total of 85,770 cases of pandemic influenza have been confirmed among Montreal residents, including 1,206 hospitalizations and 160 deaths. 4,289 cases of pandemic influenza among health care workers have been confirmed on the island of Montreal, 60 have been hospitalized, and 8 have died. Under such a scenario, would you show up for work?” The possible answers to each scenario were “Yes,” “No,” and “I don’t know.” This third scenario was more serious than the recent A (H1N1) influenza pandemic. The following analysis is based on the answers to this scenario.
(Table 4 here)
2.5.2. Reporting for work during an influenza pandemic
We estimated a multinomial logit model (100 times) to test how the risk perception scores can affect HCWs’ reporting for work (RFW). The three alternatives for the dependent variables are: Yes, No, I don’t know. The main hypothesis is that risk perception scores of personal and work activities will have greater power to explain the probability of being present at work than the risk perception scores of an influenza pandemic. Organizational variables included in the model are hygiene safety measures put in place by the establishment, preparation to protect workers in the event of a pandemic, their role at work in the event of a pandemic, importance of their role at work during an influenza pandemic, avoiding car-pooling or public transportation, and access to methods of transportation other than car-pooling or public transportation. The model also includes the following variable: changed behavior out of fear of contracting an
11
infectious disease. The latter behavior variable contains information on risk perception. It is treated differently from the other risk perception variables on personal and work activities because we do not have information on the individual’s risk perception of the corresponding infectious disease.
2.6. Steps 6 and 7: Summary of the 100 multinomial logit estimates and robustness analysis Estimations of the 100 multinomial logit models were done with Proc Logistic in SAS version 9.3. The same software generates valid statistical inferences by combining the estimation results from the 100 imputed data sets. Finally, for sensitivity, two additional analyses were conducted with the 3,971 HCW observations and with 3,574 HCW observations using “missing” as a variable category instead of imputing missing values.
3. Results
3.1. Sample3,971 health care workers participated in the Web survey. 397 respondents were excluded from the analysis because of profession misidentification. The analysis was therefore conducted on 3,574 respondents. A robustness analysis was also performed on all 3,971 respondents. 3.2. Presence at work in the three scenarios
Panel B of Table 4 describes the HCWs’ intention to be present at or absent from work in each scenario of the survey. As the IP wave evolved, RFW decreases from 88% in Scenario 1 to 52% in Scenario 3, a result that is consistent with the literature.(5,7,10,12,14,16) Subjects who answered “No” to a given scenario were not questioned further on their intentions to report for work. The indecision rate increases with the severity of the scenarios. 30% did not know whether they would go to work or not in the more severe (advanced) scenario.
12
For the statistical analysis, we retained the following response profile of presence at work during an influenza pandemic for the 3,574 respondents: “Not present in at least one scenario” and “Present in the third scenario.” We assumed that those who said “No” in the two previous scenarios would not change their mind if there were no shortage of health care workers. After the modification of the negative answers, 27.4% (981) of the 3,574 subjects answered “Not present in at least one scenario,” 26.3% (941/3574) did not know what they would do in the third scenario, and 46.2% (1652/ 3574) responded “Yes” in the third scenario.
We also considered the extent to which a possible shortage of health care workers could reverse a negative answer for each scenario and for the response “I don’t know” in the third scenario. Panel C of Table 4 indicates that 45% of those who responded “No” in the third
scenario and 57% of those who answered “I don’t know” in the third scenario would reverse their decision and report for work if there were an urgent shortage of health care workers during an IP. 3.3. Estimation of risk perception
The main significant personal variables (p < 0.10) that explain the individual risk
perception probabilities are 1) for influenza pandemic risk perception: knowledge of H5N1 cases and % H5N1 deaths, having children, workplace, profession, main task at work, full-time work, years of experience in health care, and personal health; 2) for work activity risk perception: having children, workplace, profession, main task at work, full-time work, years of experience in health care, and personal health; and 3) for personal activity risk perception: receiving the flu vaccine, smoking, drinking before driving, having children, workplace, profession, full-time work, years of experience in health care, and personal health. These variables were used to compute the 19 predicted probabilities of risk perception documented in Table 5.
13
3.4. Barriers to report for work and suggested measures
The four main barriers to willingness to report for work mentioned by the 981 HCWs who said “No” in the three scenarios documented in Panel B of Table 4 are: 1) I want to protect my personal health (50%); 2) I want to protect my family’s health (36%); 3) I have to take care of my children or other dependants (5%); and 4) I do not trust the safety measures at my work (4%). The three main measures, proposed by these HCWs, that the employer could put in place to minimize the impacts of an influenza pandemic are: 1) Reinforced workplace protection
measures (56%); 2) Giving more access to preventive medication (29%); and 3) Better defining my role in such a scenario (7%).
3.5. Factor analysis
Our sample size has 3,574 subjects, which is much larger than the number of predicted probabilities being analyzed. Indeed, the Kaiser-Meyer-Olkin measures of sampling adequacy are 0.61, 0.51 and 0.60 for the three factor analyses, indicating that we could reliably perform factor analyses on our data set.
The three factor analyses were run on the standardized predicted probabilities (mean = 0, variance = 1) listed in the first column of Table 5 using Proc Factor in SAS. The next two
columns display the rotated component matrix for the predicted probabilities. The loadings in the matrix represent the correlations between the predicted probabilities and the factors of the
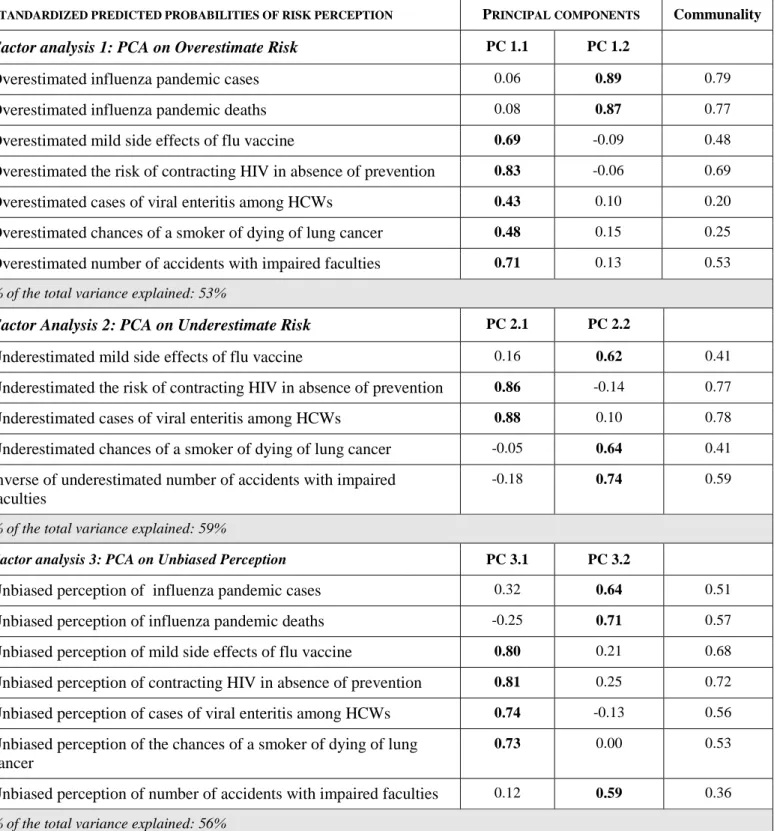
principal components. The results identify two principal components with eigenvalues greater than 1 for each factor analysis. For the first case on predicted probabilities of overestimating risk, the two principal components (PC 1.1, PC 1.2) explain 53% of the total variance of the
corresponding data. For the second factor analysis on predicted probabilities of underestimating risk, the two principal components (PC 2.1, PC 2.2) explain 59% of the total variance. For the third analysis on predicted probabilities of unbiased risk perception, the two principal
14
components (PC 3.1, PC 3.2) explain 56% of the total variance. The communality values in the last column indicate that the two principal components of each factor analysis explain a large proportion (≥ 45% with few exceptions) of each of the predicted probabilities. We also observe from the matrix that each predicted probability is highly correlated (≥ 0.40, in bold) with one of the two components in each analysis. Finally, we observe that the data analysis did not separate personal and work activities for risk overestimation whereas it separated them for risk
underestimation.
(Table 5 here) 3.6. Risk perception and reporting for work
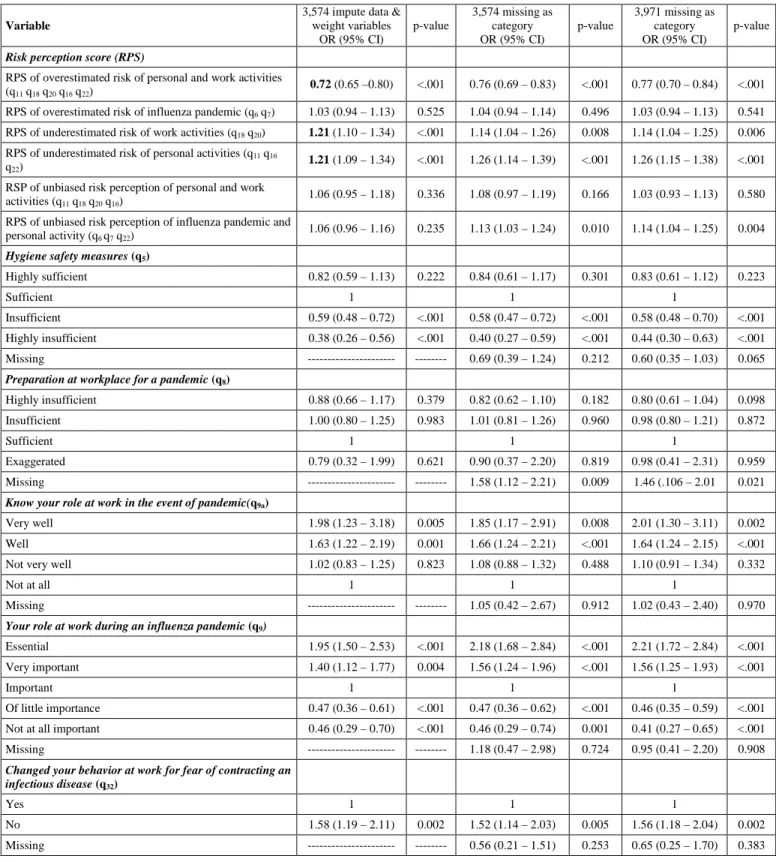
The results of the Multinomial Logit model used to estimate presence at work during a pandemic are presented in Table 6, which reports the multivariate Odds Ratios (ORs), 95% CI, and p-values of the variables that explain the probability of being present at work in the third scenario relative to that of not being present for at least one scenario. The first column of results presents the ORs obtained with imputed data for the missing data and a weight variable according to age and profession. The two other columns document robustness analyses. The second column considers the missing data as a category with the 3,574 subjects, while the third column presents the same analysis of the missing data with the 3,971 respondents. Because the results are about the same in all three columns, we concentrate the interpretation of the results in the first column. The results support our primary hypothesis. The risk perception score (RPS) of overestimating the risk of an influenza pandemic (q6, q7) is not statistically significant, while the overestimated score of personal and work activities (q11, q18, q16, q20, q22) is significant. Those who overestimate the risk of personal and work activities have a lower probability of being present at work (OR = 0.72). We also observe that those who underestimate the risk of work activities (q18, q20) and of personal activities (q11, q16, q22) are more likely to be present at work (OR = 1.21) even if they
15
were separated by the factor analysis. It is also interesting to observe that the two unbiased risk perception variables do not affect the probability of being at work during an influenza pandemic (with one exception in column 3).
At the bottom of Table 6, we present the average predicted probabilities of being at work during an influenza pandemic for the three significant risk perception scores. The average predicted probability of being at work during an influenza pandemic is 46% (95% CI:
46%−46%), which is the overall sample mean. It is equal to 36% (95% CI: 35%−37%) for those overestimating the risk of personal and work activities, 49% (95% CI: 48%−50%) for those underestimating the risk of personal activities, and 53% (95% CI: 52%−54%) for those underestimating the risk of work activities.
Table 6 also documents interesting results for organizational variables not related to the risk perception scores. For instance, variables such as hygiene safety measures at work, role at work and the importance of this role in the event of a pandemic, and transportation to work during a pandemic are significant factors that explain presence at work. Similar results are documented in the literature.(4-16) Finally, the variable change in behavior related to infectious disease also explains the presence at work (OR: 1.58 for those who did not). We now discuss the most organizational significant variables (multivariate OR, 95% CI).
(Table 6 here)
As the table shows, insufficient (OR = 0.59) and highly insufficient (OR = 0.38) hygiene safety at work and unimportant (OR= 0.47) and not at all important (OR = 0.46) role at work during an influenza pandemic reduce the probability of being present at work, while those who believe they have an essential (OR = 1.95) or very important (OR = 1.40) role at work during a pandemic have a higher probability of reporting for work. Other respondents with a higher probability of reporting for work are those who would not avoid car-pooling and public
16
transportation (OR = 3.11) in the event of a pandemic. Those who do not have access to methods other than car-pooling or public transportation would be less likely to be present at work during a pandemic (OR = 0.62).
The robustness analyses, presented in the two next columns, indicate that there is no evidence of a poor model fit in our analysis due to the treatment of missing data and the non-response bias in the survey.
4. Discussion
Planning of resource allocation during an influenza pandemic must be based on sound research that generates useful empirical results. Our results affirm that HCWs’ presence at work during an influenza pandemic is associated with their risk perception of personal and work activities. Consistent with previous studies of influenza pandemic,(5,7,10,12,14,16,39) we find that only 52% of HCWs would report for work in the third scenario of our survey. Nonetheless, this study differs from previous studies in three ways. First, we use a dynamic scenario analysis from simulated weeks of a potential IP and observe that the 52% result is obtained only in the worst scenario. In less severe situations, presence at work is higher than 88%. Further, we find that HCWs’ opinion can change when the risk issue becomes more social or not only personal. Indeed, 45% of HCWs who did not intend to (and 57% of those who did not know whether they would) RFW in the third scenario would change their intention in the event of a severe manpower shortage.
Another major difference is the type of risk perception studied. We used more familiar risks, such as smoking, along with less familiar risks such as the impact of a potential H5N1 pandemic. HCWs who overestimate the personal and work risks they face regularly are less likely to be present at work during an influenza pandemic, while risk perception of a previously
17
encountered risk (the impact of a potential H5N1 pandemic) is not significant in explaining presence at work. This difference has consequences on the planning of resource allocation because the misperception of risk of personal and work activities can be corrected with periodic information and education programs. Better knowledge of personal and work risks would
improve resource allocation not only during a pandemic influenza, but also for many current risks at work and for future potential pandemic risks affecting HCWs.
Our research also identifies many organizational factors that affect HCWs’ reporting for work during an influenza pandemic as in,(7) for example. These include sanitary measures at work, the role at work during an influenza pandemic, the importance of the role during an influenza pandemic, and transportation during a pandemic.
Many alternative models that explain the link between perceived risks and behavior are proposed in the literature. Our research is based on one of the more commonly employed models for empirical studies − the subjective expected utility model − which suggests a direct association between risk perception and behavior activities.(2,40-44) The model predicts that an individual’s choice of risky situations is based on the product of subjective probability (likelihood) and the state-dependent value (utility) function of different options such as staying in good health and becoming sick, which is similar to the perceived threat domain discussed in (9,10). State-dependent utility means that, for the same wealth, the utility of being in good health is higher than the utility of being sick. It is often assumed that the marginal utility of wealth of being in good health is higher than the marginal utility of wealth of being sick, which can explain different behaviors independently of the monetary consequences associated with the alternatives. However, we limit our analysis to the subjective probability (or likelihood) part of the model and do not explore the value dimension aspect of a pandemic.
18
Another limitation of our analysis is that the emotional dimension of risk perception is not considered. Some argue that public decisions must be based on experts’ risk perception but others think that the public’s perception is valid as that of scientists, perhaps more so. (44) Our sample represents HCWs that are not necessary experts. Many researchers have underscored the importance of emotional domains of risk perception in addition to cognitive domains in
evaluating individuals’ risk behavior.(31-35) Emotional risk perception implies that individual risk perception is a function of fear and anxiety, for example. Our questions on perceived risk in Table 3 are stated more explicitly in cognitive terms than in emotional terms. We must
emphasize, however, that the subjects of our study are health professionals who may have less emotional and better documented judgment than lay people with respect to personal and work risks. The difference may be less obvious for the questions related to reporting for work during an influenza pandemic because the HCWs had not experienced this risk before the survey period. Our methodology cannot distinguish the cognitive and affective domains from the reporting for work responses because our research was not designed for that purpose. This means that
additional variables in the model controlling for the affective domain might have improved the explanation of the decision to report for work. As illustration, we control for fear of contracting an infectious disease in Table 6 and this behavioral variable significantly explains the probability of being present at work. Those who did not change their behavior for fear of infectious disease are more willing to report for work (OR = 1.58; 95% CI: 1.19−2.11). This indicates that this affective variable is complementary to the risk perception scores and organizational variables considered in explaining the willingness of reporting to work, as suggested in (8-10). Further research must therefore treat the affective domain in risk perception of personal and work activities more explicitly to develop better intervention tools.
19
Another limitation of our analysis is the implicit assumption that HCWs are rational agents. They were not in an emotional situation when they responded to the questionnaire. This means that pandemic influenza risk perception variables do not capture the additional emotional process involved in decision making during a pandemic. In a real pandemic situation, emotions may dominate the other factors analyzed in this article to explain reporting for work. This shortcoming is not limited to the subjective expected utility model; the relationship between risk-related cognitions and emotion-based judgment is still a subject of research (30) that our data do not allow us to consider. The presentation of the two questions concerning an influenza pandemic is for the intention or willingness to report for work and does not correspond to a real influenza pandemic situation in its early stages in the absence of vaccination, when even experts are uncertain about what is unfolding, as was observed during the recent A(H1N1) pandemic. Nonetheless, our methodology computes the relative behaviors associated with various risky situations. Presumably, the observed relative bias in risk perception would not change in an emotional situation. This question merits further research, as in (7,45,46) for A(H1N1).
Another potential caveat is that personal and work risks are individual risks, while pandemic risks are more social in the sense that externalities between individuals are involved and decisions to go to work can be influenced by normative behaviors. One interesting result of our research is that some important decisions are reversible when the social aspect of the pandemic becomes more important. Therefore, clear identification of private and social risks would also be a worthy focus of future research on the effect of risk perception on RFW.(47) We must be prudent in the interpretation of our reversible results. The large effect of 45% may have been influenced by the question phrasing and may contain a social desirability bias. The novelty of the result and its importance nonetheless merit further investigation.
20
The findings of this study identify many causes for absence from work during an
influenza pandemic. The four main barriers to willingness to report for work in this study are: 1) I want to protect my personal health (50%); 2) I want to protect my family’s health (36%); 3) I have to take care of my children or other dependants (5%); and 4) I do not trust the safety measures at my work (4%). Each barrier involves actions by different stakeholders in the planning of resource allocation during a pandemic.(17,48-52) Vaccination, specific preventive measures, and personal protective equipment are often cited as among the first priorities when planning resources for a pandemic (7,14,47,53) but vaccines may not be available during the early phases of H5N1. HCWs may then be asked to RFW without this protection. In our survey, the availability of vaccines was not mentioned explicitly in questions on presence at work. Those who said “No” to the three scenarios indicated that the three following measures would be important to minimize the impacts of an influenza pandemic: 1) Reinforce workplace protection (56%); 2) Give access to preventive medication (29%); and 3) Better define workers’ role in such a situation (7%), which are in line with those documented in (7,14). The vaccine is therefore not the sole and even the predominant measure to improve worker participation. This may explain why hygiene sanitary measures at work and the determination of each HCW’s role and the importance of this role were found to be significant in the analysis of Table 6. Our results also suggest that national pandemic influenza preparedness programs must coordinate the
transportation of HCWs with healthcare institutions’ needs and schedules.
Improved risk perception is linked to education: our results suggest that the health care system must continuously provide better information on risks. Implementation of precautionary behavior at work based on accurate risk perception is complementary to other organizational measures of risk prevention. Finally, knowing HCWs’ perception of different risks is an important resource allocation instrument for unanticipated pandemics because risk perception
21
seems to be a good predictor of RFW. Knowledge of risk associated to personal and work activities thus complements knowledge and perception of the influenza pandemic (54) and other intervention policies.(7,48)
5. Conclusion
We used three IP scenarios to investigate HCWs’ RFW. The severity of the scenarios significantly reduces presence at work from 88% (Scenario 1) to 52% (Scenario 3). Results indicate that risk perception bias associated with personal and work activities are better predictors of presence at work than H5N1 influenza pandemic risk perception. Those who overestimate personal and work activities risk are less likely to be present at work. It is therefore important for health care policy planners to better understand HCWs’ risk behavior in different contexts to better manage their presence to work by providing accurate information on various risks.
Other factors that significantly explain presence at work during a pandemic include sanitary measures at work, role at work and the importance of this role in the event of a
pandemic, and transportation to work during a pandemic. Finally, the initial expressed intent to not RFW (or “I don’t know”) in the worst scenario was observed to be reversible in the context of a manpower shortage.
Acknowledgements
We would like to thank the CIHR Pandemic Preparedness Research Program in Canada and the Canada Research Chair in Risk Management for their financial support.
22
References
1. Viscusi WK: Smoking: Making the Risky Decision. New York: Oxford University Press; 1992.
2. Viscusi WK, Evans WN: Estimation of revealed probabilities and utility functions for product safety
decisions. The Review of Economics and Statistics 1998, 80:28-33.
3. Dionne G, Fluet C, Desjardins D: Predicted risk perception and risk-taking behavior: The case of
impaired driving. Journal of Risk and Uncertainty 2007, 35:237-264.
4. Qureshi KA, Gershon RRM, Sherman MF, Straub T, Gebbie E, McCollum M, Erwin, MJ, Morse, SS:
Health care workers’ ability and willingness to report to duty during catastrophic disasters. Journal
of Urban Health: Bulletin of the New-York Academy of Medecine 2002, 82:378-388.
5. Balicer RD, Omer SB, Barnett DJ, Everly GS Jr: Local public health workers’ perceptions toward
responding to an influenza pandemic. BMC Public Health 2006, 6:99.
6. Gershon RR, Magda LA, Canton AN, Riley HE, Wiggins F, Young W, Sherman MF: Pandemic-related
ability and willingness in home healthcare workers. Am J Disaster Med 2010, 5:15-26.
7. Gershon RR, Magda LA, Qureshi KA, Riley HE, Scanlon E, Carney MT, Richards RJ, Sherman MF.
Factors associated with the ability and willingness of essential workers to report to duty during a pandemic. J Occup Environ Med 2010, 52:995-1003.
8. Barnett DJ, Balicer RD, Blodgett DW, Everly GS Jr, Omer SB, Parker CL, Links JM: Applying risk
perception theory to public health workforce preparedness training. Journal of Public Health
Management and Practice 2005, 11:S33-S37.
9. Barnett DJ, Balicer RD, Thompson CB, Storey JD, Omer SB, Semon NL, Bayer S, Cheek LV, Gateley KW, Lanza KM, Norbin JA, Slemp CC, Links JM: Assessment of local public health workers'
willingness to respond to pandemic influenza through application of the extended parallel process model. PLoS One 2009, 4:e6365.
23
10. Barnett DJ, Levine R, Thompson CB, Wijetunge GU, Oliver AL, Bentley MA, Neubert PD, Pirrallo RG, Links JM, Balicer RD: Gauging U.S. emergency medical services workers' willingness to respond to
pandemic influenza using a threat- and efficacy-based assessment framework. PLoS One 2010, 5:e9856.
11. Levin PJ, Gebbie EN, Qureshi K: Can the health-care system meet the challenge of pandemic flu?
Planning, ethical, and workforce considerations. Public Health Rep, 2007, 122:573-578.
12. Irvin CB, Cindrich L, Patterson W, Southall A: Survey of hospital healthcare personnel response
during a potential avian influenza pandemic: will they come to work? Prehosp Disaster Med 2008, 23:328-335.
13. Balicer RD, Catlett CL, Barnett DJ, Thompson CB, Hsu EB, Morton MJ, Semon NL, Watson CM, Gwon HS, Links JM: Characterizing hospital workers' willingness to respond to a radiological event. PLoS One 2011, 6:e25327. Epub 2011 Oct 27.
14. Balicer RD, Barnett DJ, Thompson CB, Hsu EB, Catlett CL, Watson CM, Semon NL, Gwon HS, Links JM: Characterizing hospital workers' willingness to report to duty in an influenza pandemic
through threat- and efficacy-based assessment. BMC Public Health 2010, 10:436.
15. Tippett VC, Watt K, Raven SG, Kelly HA, Coory M, Archer F, Jamrozik K: Anticipated behaviors of
emergency prehospital medical care providers during an influenza pandemic. Prehosp Disaster Med
2010, 25:20-25.
16. Chaffee M: Willingness of health care personnel to work in a disaster: An integrative review of the
literature. Disaster Med Public Health Prep 2009, 3:42-56.
17. Ives J, Greenfield S, Pany JM, Drafer H, Gratus C, Petts JI, Sorell T, Wilson: Healthcare workers’
attitude to working during pandemic influenza: A qualitative study. BMC Public Health 2009, 9:56.
18. Martin SD: Nurses' ability and willingness to work during pandemic flu. J Nurs Manag 2011, 19:98-108. doi: 10.1111/j.1365-2834.2010.01190.x. Epub 2010 Dec 12.
24
19. Ma X, He Z, Wang Y, Jiang L, Xu Y, Qian C, Sun R, Chen E, Hu Z, Zhou L, Zhou F, Qin T, Cao X, An Y, Sun R, Zhang X, Lin J, Ai Y, Wu D, Du B: China Critical Care Clinical Trial Group (CCCCTG).
Knowledge and attitudes of healthcare workers in Chinese intensive care units regarding 2009 H1N1 influenza pandemic. BMC Infect Dis 2011, 11:24.
20. Imai H, Matsuishi K, Ito A, Mouri K, Kitamura N, Akimoto K, Mino K, Kawazoe A, Isobe M, Takamiya S, Mita T: Factors associated with motivation and hesitation to work among health professionals
during a public crisis: a cross sectional study of hospital workers in Japan during the pandemic (H1N1) 2009. BMC Public Health 2010, 10:672.
21. Basta NE, Edwards SE, Schulte J: Assessing public health department employees' willingness to
report to work during an influenza pandemic. J Public Health Manag Pract 2009, 15:375-383.
22. Vawter DE, Garrett JE, Prehn AW, Gervais KG: Health care workers' willingness to work in a
pandemic. Am J Bioeth 2008, 8:21-23.
23. Wicker S, Rabenau HF, Gottschalk R: Influenza pandemic: Would healthcare workers come to work?
An analysis of the ability and willingness to report to duty. Bundesgesundheitsblatt
Gesundheitsforschung Gesundheitsschutz 2009, 52:862-869.
24. Martinese F, Keijzers G, Grant S, Lind J: How would Australian hospital staff react to an avian
influenza admission, or an influenza pandemic? Emerg Med Australasia 2009, 21:12-24.
25. Daugherty EL, Perl TM, Rubinson L, Bilderback A, Rand CS: Survey study of the knowledge, attitudes,
and expected behaviors of critical care clinicians regarding an influenza pandemic. Infect Control
Hosp Epidemiol 2009, 30:1143-1149.
26. Seale H, Ward KF, Zwar N, Van D, Leask J, Macintyre CR: Examining the knowledge of and attitudes
to pandemic influenza among general practice staff. Med J Aust 2010, 5:378-380.
27. Butsashvili M, Triner W, Kamkamidze G, Kajaia M, McNutt LA: Knowledge and anticipated behavior
of health care workers in response to an outbreak of pandemic influenza in Georgia. J Infect Dev
25
28. Damery S, Draper H, Wilson S, Greenfield S, Ives J, Parry J, Petts J, Sorell T: Healthcare workers'
perceptions of the duty to work during an influenza pandemic. J Med Ethics 2010, 36:12-18.
29. Baron S, McPhaul RN, Phillips S, Gershon R, Lipscomb J: Protecting home health care workers: A
challenge to pandemic influenza preparedness planning. American Journal of Public Health 2009, 99:S301-S307.
30. Leppin A, Aro AR: Risk perception to SARS and Avian influenza: Theoretical foundations of
current empirical research. International Journal of Behavioral Medicine 2009, 16:7-29.
31. Witte K: Putting the pear back into fear appeals: The extended parallel process model. Communication Monograph 1992, 59:329-349.
32. Fischhoff B: Risk perception and communication unplugged: Twenty years of process. Risk Analysis 1995, 15:137-145.
33. Slovic P, Finucane MI, Peters E, MacGregor DG: Risk as analysis and risk as feelings: Some thoughts
about affect, reason, risk, and rationality. Risk analysis 2004, 24, 2:311-322.
34. Slovic P, Fischhoff B, Lichtenstein S: Characterizing perceived risk. In Perilous Programs: Managing the Hazards of Technology. Edited by Kates RW, Hohenemser C, Kasperson JX, Westview, BoulderColo; 1985:91-125.
35. Fischhoff B. Slovic P, Lichtenstein S. Read S. Combs B: How safe is safe enough? A psychometric
study of attitudes toward technological risks and benefits. Policy Sciences 1978, 9:127-152.
36. Rubin, DB: Multiple Imputation for Nonresponse in Surveys. J. Wiley & Sons, New York; 1987. 37. Kim JO, Mueller, CW: Introduction to factor analysis: What it is and how to do it. Newbury Park, CA:
Sage Publications; 1978.
38. Kaiser HF: The application of electronic computers to factor analysis. Educational and Psychological Measurement 1960, 20:141-151.
39. Devnani M: Factors Associated with the Willingness of Health Care Personnel to Work During an
Influenza Public Health Emergency: An Integrative Review, Prehospital and Disaster Medecine 2012,
26
40. Smith VK, Desvousges WH: An Empirical analysis of the economic value of risk changes. The Journal of Political Economy 1987, 95:89-114.
41. Smith VK, Johnson FR: How do risk perceptions respond to information: The case of radon. The Review of Economics and Statistics 1988, 70:1-8.
42. Cameron TA: Updating subjective risks in the presence of conflicting information: An application to
climate change. Journal of risk and Uncertainty 2005, 30:63-97.
43. Viscusi WK, Hersch J: Cigarette smokers as job risk takers. Review of Economics and Statistics 2001, 83:269-280.
44. Morrow BH: Risk behavior and risk communication: Synthesis and expert interviews expert interviews 2009, SocResearch, Miami: 53 pages.
45. Imai H, Matsuichi K, Ito A, Mouri K, Kitamura N, Akimoto K, Mino K, Kawazoe A, Isobe M, Mita T:
Factors associated with motivation and hesitation to work among health professionals during a public crisis: a cross sectional study of hospital workers in Japan during the pandemic (H1N1) 2009.
BMC Public Health 2010, 10:672-679.
46. Ma X, He Z, Wang Y, Jiang L, Xu Y, Qian C, Sun R, Chen E, Hu Z, Zhou L, Zhou F, Qin T, Cao X, An Y, Sun R, Zhang X, Lin J, Ai Y, Wu D, Du B: Knowledge and attitudes of healthcare workers in
Chinese intensive care units regarding 2009 H1N1 influenza pandemic. BMC Infectious Diseases
2011, 11:24-30.
47. Bruge J, Aro AR, Richardur JH: Risk Perceptions and behavior: Towards pandemic control of
emerging infectious diseases. Int. J. Behav. Med. 2009, 16:3-6.
48. Cowden J, Crane L, Lezotte D, Glover J, Nyquist AC: Pre-pandemic planning survey of healthcare
workers at a tertiary care children's hospital: ethical and workforce issues. Influenza Other Respi
Viruses 2010, 4:213-22.
49. Garrett AL, Park YS, Redlener I: Mitigating absenteeism in hospital workers during a pandemic. Disaster Med Public Health Prep 2009, 3:S141-7.
27
50. Ehrenstein BP, Hanses F, Salzberger B: Influenza pandemic and professional duty: family or patients
first? A survey of hospital employees. BMC Public Health 2006, 6:311.
51. Anikeeva O, Braunack-Mayer AJ, Street JM: How will Australian general practitioners respond to an
influenza pandemic? A qualitative study of ethical values. Med J Aust 2008, 189:148-150.
52. Dalton CB, Durrheim DN, Conroy MA: Likely impact of school and childcare closures on public
health workforce during an influenza pandemic: A survey. Commun Dis Intell 2008, 32:261-262.
53. Mounier-Jack S, Coker R: How prepared is Europe for pandemic influenza? Analysis of national
plans. Lancet 2006, 367:1405-1411.
54. Seale H, Leask J, Po K, MacIntyre CR: Will they just pack up and leave – Attitude and intended
behavior of hospital health care workers during an influenza pandemic. BMC Health Care Services
28
Table 1. Steps of the methodology
Step 1
• SURVEY AND PROFESSION MISIDENTIFICATION
• 7 questions on risk perception, 3 questions on report for work during influenza pandemic, and 21 questions on control variables.
• Treatment of profession misidentification in the survey.
Step 2
• TREATMENT OF MISSING DATA
• PROC MI (Multiple Imputation) in SAS version 9.3 to create 100 imputed data sets of 3,574 HCWs for 21 control variables from the survey.
F
or
e
ac
h
of
t
h
e
100 d
at
a s
et
s
Step 3
• RISK PERCEPTION
• Estimation of 19 predicted probabilities from 7 multinomial logit models*
• One model for each risk perception question with 4 alternatives (Overestimate, Underestimate, Unbiased, Unable to answer this question) with 10 personal explanatory variables obtained from different questions in the survey. One risk perception question had only 3 alternatives.
Step 4
• FACTOR ANALYSIS
• Three factor analyses to reduce the number of variables for the analysis of willingness to report for work. • To obtain individual risk perception scores for overestimate, underestimate and unbiased alternatives. One
factor analysis by alternative.
Step 5
• INFLUENZA PANDEMIC SCENARIOS AND REPORTING FOR WORK
DURING AN INFLUENZA PANDEMIC
• Influenza pandemic scenarios for dependent variables.• Estimation of a multinomial logit model for presence at work*
• Present, Not present, I don’t know alternatives as a function of the risk perception scores and other organizational explanatory variables obtained from the survey.
Step 6
• SUMMARY OF THE 100 MULTINOMIAL LOGIT ESTIMATES
• PROC MIanalyze in SAS version 9.3 to generate valid statistical inferences by combining the results from the 100 imputed data sets.
Step 7
• ROBUSTNESS ANALYSIS
• Additional analyses (Step 3 to Step 5) with 3,971 HCW observations and with 3,574 HCW observations using missing as a variable category instead of imputing missing values.
29
Table 2. Health care workers on the Island of Montreal and survey participation
Profession Number of workers* A (%) Number of respondents B (%) Response Rate (%) B/A Mean age Population C Mean age Sample D Physician 10,660 (11.3) 502 (12.6) 4.71 46.3 45.5 Nurse 28,725 (30.4) 862 (21.7) 3.00 42.6 42.2 Nursing assistant 4,760 (5.0) 273 (6.9) 5.74 43.0 44.1 Dentist 2,590 (2.7) 90 (2.3) 3.47 44.3 48.5 Occupational therapist 1,655 (1.8) 77 (1.9) 4.65 36.7 35.5 Registered respiratory therapist 1,345 (1.4) 95 (2.4) 7.06 36.7 42.3
Pharmacist 2,725 (2.9) 169 (4.3) 6.20 42.3 40.3
Physiotherapist 2,310 (2.4) 74 (1.9) 3.20 37.9 39.1
Psychologist 3,920 (4.1) 102 (2.6) 2.60 45.9 45.9
Registered technologist 1,980 (2.1) 137 (3.5) 6.92 40.4 39.8 Radiology technologist 2,055 (2.2) 118 (3.0) 5.74 39.5 41.7 Social worker in health care** 2,210 (2.3) 156 (3.9) 2.95 41.9 43.5 Support staff*** 26,149 (27.7) 1,063 (26.8) 3.23 40.8 43.4
Administrator*** 1,175 (1.2) 181 (4.6) 8.15 47.7 49.6
Others **** 2,211 (2.3) 72 (1.8) 4.47 40.4 41.5
Total 94,470 (100.0) 3,971 (100.0) 3.79 42.3 43.1
*
Number comes from Statistics Canada (2007) unless otherwise specified.
**
Number comes from social workers association because Statistics Canada does not separate social workers in health care from other social workers.
***
Number comes from eleven health institutions in Montreal.
****
Other categories include Chemist (3 respondents), Dietitian (35 resp.), Speech Therapist and Audiologist (30 resp.), and Midwife (4 resp.). Numbers come from Statistics Canada.
30
Table 3. Questions on risk perception and corresponding knowledge or behavior RISK PERCEPTION OF INFLUENZA PANDEMIC
QUESTION 6:INFLUENZA PANDEMIC CASES -MTL
Now assuming that Montreal were to be affected by an influenza pandemic… Out of every 1,000 Montrealers, how many do you predict would be infected during the total duration of the pandemic? Knowledge question: Since 2003, how many cases of birds flu (H5N1) have been reported in human worldwide?
QUESTION 7:INFLUENZA PANDEMIC DEATHS -MTL
Out of every 1,000 Montrealers infected with pandemic influenza, how many do you predict will die of the disease?
Knowledge question: Among these cases (bird flu – H5N1 – reported since 2003), what percent died from the illness?
RISK PERCEPTION OF WORK ACTIVITIES
QUESTION 18:NEEDLE STICK –HIV ACQUISITION
For every 10,000 health care workers who are accidentally pricked by a needle tainted by blood of an HIV infected patient, how many are at risk of contracting HIV in the absence of prevention?
Behavior question: Do you follow the recommended procedures for disposal of sharps to avoid accidently being pricked by a needle tainted with a patient’s blood?
QUESTION 20:VIRAL ENTERITIS –HCWS AFFECTED
Of all the cases of viral gastro-enteritis in health establishments in Montreal from September 2006 to May 2007, what percentage were health care workers?
Behavior question: If you work in a health establishment where there are cases of viral gastro-enteritis, do you wash your hands as recommended?
RISK PERCEPTION OF PERSONAL ACTIVITIES
QUESTION 11:FLU VACCINE – MILD SIDE EFFECTS
Among the 10 million Canadians vaccinated against seasonal influenza, how many do you think will suffer mild side effects?
Behavior question: During the past 12 months, did you receive the flu vaccine (seasonal influenza)?
QUESTION 16:SMOKING –LUNG CANCER
By how much does a man who smokes regularly increase his chances of dying of lung cancer, compared to a non-smoker?
Behavior question: Do you currently smoke cigarettes?
QUESTION 22:DRINKING & DRIVING – CAR ACCIDENTS
It is suspected that on any given Friday night, there are about 20,000 drivers in Quebec who drive with impaired faculties. In your opinion, how many of them will have an accident, regardless of whether they are responsible for the accident and regardless of the severity of the crash?
Behavior question: During the past 3 months, how many times did you drive a car after having had 2 or more drinks during the preceding hour?
31
Table 4. Presence at work during an influenza pandemic Panel A
Three fictitious scenarios of the IP wave in Montreal
Scenario 1 Scenario 2 Scenario 3
Time in Montreal (MTL) 1 week 2 weeks 6 weeks
Total ill in MTL 13 14,915 85,770 Total hospitalized in MTL 1 148 1,206 Total deaths in MTL 0 4 160 Total HCWs ill in MTL 1 746 4,289 Total HCWs hospitalized in MTL 0 7 60 Total HCWs deaths in MTL 0 0 8 Panel B
Health care workers presence or absence at work in the three fictitious scenarios for an IP
Scenario 1 Scenario 2 Scenario 3
N % N % N % Yes 3,159 88.39 2,614 76.39 1,652 52.06 No 152 4.25 249 7.28 580 18.28 I don’t know 263 7.36 559 16.33 941 29.66 Total 3,574 100.00 3,422 100.00 3,173 100.00 Panel C
If there would be an urgent shortage of health care workers, could that change your decision to report for work?
Not present in Don’t know if would
be present in Scenario 3
Scenario 1 Scenario 2 Scenario 3
Yes 60 39.47 98 39.36 259 44.66 538 57.17
No 85 55.92 128 51.40 255 43.97 222 23.59
I don’t know 7 4.61 23 9.24 66 11.38 181 19.24
32
Table 5. Principal component analyses (PCA) of risk perception and Varimax rotated component matrix*
STANDARDIZED PREDICTED PROBABILITIES OF RISK PERCEPTION PRINCIPAL COMPONENTS Communality
Factor analysis 1: PCA on Overestimate Risk PC 1.1 PC 1.2
Overestimated influenza pandemic cases 0.06 0.89 0.79
Overestimated influenza pandemic deaths 0.08 0.87 0.77
Overestimated mild side effects of flu vaccine 0.69 -0.09 0.48
Overestimated the risk of contracting HIV in absence of prevention 0.83 -0.06 0.69 Overestimated cases of viral enteritis among HCWs 0.43 0.10 0.20 Overestimated chances of a smoker of dying of lung cancer 0.48 0.15 0.25 Overestimated number of accidents with impaired faculties 0.71 0.13 0.53
% of the total variance explained: 53%
Factor Analysis 2: PCA on Underestimate Risk PC 2.1 PC 2.2
Underestimated mild side effects of flu vaccine 0.16 0.62 0.41
Underestimated the risk of contracting HIV in absence of prevention 0.86 -0.14 0.77 Underestimated cases of viral enteritis among HCWs 0.88 0.10 0.78 Underestimated chances of a smoker of dying of lung cancer -0.05 0.64 0.41 Inverse of underestimated number of accidents with impaired
faculties
-0.18 0.74 0.59
% of the total variance explained: 59%
Factor analysis 3: PCA on Unbiased Perception PC 3.1 PC 3.2
Unbiased perception of influenza pandemic cases 0.32 0.64 0.51 Unbiased perception of influenza pandemic deaths -0.25 0.71 0.57 Unbiased perception of mild side effects of flu vaccine 0.80 0.21 0.68 Unbiased perception of contracting HIV in absence of prevention 0.81 0.25 0.72 Unbiased perception of cases of viral enteritis among HCWs 0.74 -0.13 0.56 Unbiased perception of the chances of a smoker of dying of lung
cancer
0.73 0.00 0.53
Unbiased perception of number of accidents with impaired faculties 0.12 0.59 0.36
% of the total variance explained: 56%
*. Salient or “large” loadings (≥ 0.40) are indicated in bold. They measure a high correlation between the
33
Table 6. Odds ratio (95% confident interval) on the probability of being present at work in the third scenario
relative to that of not being present for at least one scenario (qi indicates the survey question i)*
Variable
3,574 impute data & weight variables OR (95% CI) p-value 3,574 missing as category OR (95% CI) p-value 3,971 missing as category OR (95% CI) p-value Risk perception score (RPS)
RPS of overestimated risk of personal and work activities
(q11 q18 q20 q16 q22) 0.72 (0.65 –0.80) <.001 0.76 (0.69 – 0.83) <.001 0.77 (0.70 – 0.84) <.001
RPS of overestimated risk of influenza pandemic (q6 q7) 1.03 (0.94 – 1.13) 0.525 1.04 (0.94 – 1.14) 0.496 1.03 (0.94 – 1.13) 0.541
RPS of underestimated risk of work activities (q18 q20) 1.21 (1.10 – 1.34) <.001 1.14 (1.04 – 1.26) 0.008 1.14 (1.04 – 1.25) 0.006
RPS of underestimated risk of personal activities (q11 q16
q22)
1.21 (1.09 – 1.34) <.001 1.26 (1.14 – 1.39) <.001 1.26 (1.15 – 1.38) <.001 RSP of unbiased risk perception of personal and work
activities (q11 q18 q20 q16) 1.06 (0.95 – 1.18) 0.336 1.08 (0.97 – 1.19) 0.166 1.03 (0.93 – 1.13) 0.580
RPS of unbiased risk perception of influenza pandemic and
personal activity (q6 q7 q22) 1.06 (0.96 – 1.16) 0.235 1.13 (1.03 – 1.24) 0.010 1.14 (1.04 – 1.25) 0.004
Hygiene safety measures (q5)
Highly sufficient 0.82 (0.59 – 1.13) 0.222 0.84 (0.61 – 1.17) 0.301 0.83 (0.61 – 1.12) 0.223
Sufficient 1 1 1
Insufficient 0.59 (0.48 – 0.72) <.001 0.58 (0.47 – 0.72) <.001 0.58 (0.48 – 0.70) <.001 Highly insufficient 0.38 (0.26 – 0.56) <.001 0.40 (0.27 – 0.59) <.001 0.44 (0.30 – 0.63) <.001 Missing --- --- 0.69 (0.39 – 1.24) 0.212 0.60 (0.35 – 1.03) 0.065 Preparation at workplace for a pandemic (q8)
Highly insufficient 0.88 (0.66 – 1.17) 0.379 0.82 (0.62 – 1.10) 0.182 0.80 (0.61 – 1.04) 0.098 Insufficient 1.00 (0.80 – 1.25) 0.983 1.01 (0.81 – 1.26) 0.960 0.98 (0.80 – 1.21) 0.872
Sufficient 1 1 1
Exaggerated 0.79 (0.32 – 1.99) 0.621 0.90 (0.37 – 2.20) 0.819 0.98 (0.41 – 2.31) 0.959 Missing --- --- 1.58 (1.12 – 2.21) 0.009 1.46 (.106 – 2.01 0.021 Know your role at work in the event of pandemic(q9a)
Very well 1.98 (1.23 – 3.18) 0.005 1.85 (1.17 – 2.91) 0.008 2.01 (1.30 – 3.11) 0.002 Well 1.63 (1.22 – 2.19) 0.001 1.66 (1.24 – 2.21) <.001 1.64 (1.24 – 2.15) <.001 Not very well 1.02 (0.83 – 1.25) 0.823 1.08 (0.88 – 1.32) 0.488 1.10 (0.91 – 1.34) 0.332
Not at all 1 1 1
Missing --- --- 1.05 (0.42 – 2.67) 0.912 1.02 (0.43 – 2.40) 0.970 Your role at work during an influenza pandemic (q9)
Essential 1.95 (1.50 – 2.53) <.001 2.18 (1.68 – 2.84) <.001 2.21 (1.72 – 2.84) <.001 Very important 1.40 (1.12 – 1.77) 0.004 1.56 (1.24 – 1.96) <.001 1.56 (1.25 – 1.93) <.001
Important 1 1 1
Of little importance 0.47 (0.36 – 0.61) <.001 0.47 (0.36 – 0.62) <.001 0.46 (0.35 – 0.59) <.001 Not at all important 0.46 (0.29 – 0.70) <.001 0.46 (0.29 – 0.74) 0.001 0.41 (0.27 – 0.65) <.001 Missing --- --- 1.18 (0.47 – 2.98) 0.724 0.95 (0.41 – 2.20) 0.908 Changed your behavior at work for fear of contracting an
infectious disease (q32)
Yes 1 1 1
No 1.58 (1.19 – 2.11) 0.002 1.52 (1.14 – 2.03) 0.005 1.56 (1.18 – 2.04) 0.002 Missing --- --- 0.56 (0.21 – 1.51) 0.253 0.65 (0.25 – 1.70) 0.383
34 Variable
3,574 impute data & weight variables OR (95% CI) p-value 3,574 missing as category OR (95% CI) p-value 3,971 missing as category OR (95% CI) p-value Avoid car-pooling or public transportation during a
pandemic (q33)
Yes 1 1 1
No 3.11 (2.45 – 3.95) <.001 3.59 (2.80 – 4.60) <.001 3.60 (2.84 – 4.57) <.001 Missing --- --- 3.17 (1.86 – 5.40) <.001 3.64 (2.16 – 6.15) <.001 Other method of transportation than car-pooling or
public transportation (q34)
Yes 1 1 1
No 0.62 (0.48 – 0.80) <.001 0.55 (0.42 – 0.71) <.001 0.55 (0.43 – 0.70) <.001 Missing --- --- 0.22 (0.04 – 1.13) 0.070 0.22 (0.05 – 0.92) 0.038 Risk perception score
Average predicted probabilities to report for work
(95% CI)
N
Average predicted probabilities to report for work
(95% CI)
N
Average predicted probabilities to report for work
(95% CI)
N RPS of overestimate risk of personal and work activities
(q11 q18 q20 q16 q22)
0.36 (0.35 – 0.37) 723 0.38 (0.36 – 0.39) 725 0.38 (0.37 – 0.39) 782 RPS of underestimate risk of work activities (q18 q20) 0.53 (0.52 – 0.54) 562 0.52 (0.50 – 0.54) 552 0.54 (0.52 – 0.55) 598
RPS of underestimate risk of personal activities (q11 q16 q22) 0.49 (0.48 – 0.50) 640 0.50 (0.48 – 0.51) 663 0.51 (0.49 – 0.52) 754
Overall 0.46 (0.46 – 0.46) 3,574 0.46 (0.45 – 0.47) 3,574 0.47 (0.46 – 0.47) 3,971
*
The values of the risk perception scores (RPS) are the sum of the products of the standardized predicted
probabilities and their respective standardized scoring coefficients, which are computed by multiplying the inverse of the predicted probabilities correlation matrix by the loadings in the matrix documented in the two PC columns of Table 5.