Airline Fleet Assignment and Schedule Design:
Integrated Models and Algorithms
by
Manoj Lohatepanont
B.Eng., Chulalongkorn University (1995)
MST, Massachusetts Institute of Technology (1999)
SM OR, Massachusetts Institute of Technology (1999)
Submitted to the Department of Civil and Environmental Engineering
in partial fulfillment of the requirements for the degree of
Doctor of Science in Transportation and Logistics Systems
at the
MASSACHUSETTS INSTITUTE OF TECHONOLOGY
February 2002
@
Massachusetts Institute of Techonology 2002
BARKER
MASSACHUSETTS iNgTITUTE OF TECHNOLOGYMAR 0
6 2002
LIBRARIES
Signature of Author ... -...Department of Civil and Environmental Engineering
September 7, 2001
C ertified by ...
.
.
...
Cynthia Barnhart
Associate Professor of Civil and Environmental Engineering
/Co-Director,
Operations Research Center
C
irwcty, Center for Transportation Studies
Thesis Supervisor
A ccepted by ...
Airline Fleet Assignment and Schedule Design:
Integrated Models and Algorithms
by
Manoj Lohatepanont
Submitted to the Department of Civil and Environmental Engineering on September 7, 2001, in partial fulfillment of the
requirements for the degree of
Doctor of Science in Transportation and Logistics Systems
Abstract
In scheduled passenger air transportation, airline profitability is critically influenced by the airline's ability to construct flight schedules containing flights at desirable times in profitable markets. In this dissertation, we study two elements of the schedule generation process, namely, schedule design and fleet assignment. The schedule design problem involves selecting an optimal set of flight legs to be included in the schedule, while the fleet assignment problem involves assigning aircraft types (or fleets) to flight legs to maximize revenues and minimize operating costs simultaneously.
With the fleet assignment problem, we investigate the issues of network effects, spill, and
recapture. On a constrained flight leg in which demand exceeds capacity, some passengers are
not accommodated, or spilled. When passengers travel on two or more constrained legs, flight
leg interdependencies or network effects arise because spill can occur on any of these legs. In
most basic fleet assignment models, simplistic modeling of network effects and recapture leads to sometimes severe, miscalculations of revenues. Recapture occurs when some of the spilled passengers are re-accommodated on alternate itineraries in the system. In this dissertation, we develop new fleet assignment models that capture network effects, spill, and recapture. Another benefit of one of our models is its tractability and potential for further integration with other schedule planning steps. Our study shows that the benefits of modeling these elements can be as large as $100 million annually for a major U.S. airline. In addition, we show that modeling flight leg interdependence is more important than demand stochasticity for hub-and-spoke fleet assignment problems.
We develop two models for schedule design, one assuming that the market share of an airline remains constant with schedule changes; and the other assuming that market share varies with schedule changes. The constant market share model, while less precise in its modeling, is much easier to solve than the variable market share model. We estimate that the potential benefits of these models range from $100 to $350 million annually.
Thesis Supervisor: Cynthia Barnhart
Title: Associate Professor of Civil and Environmental Engineering Co-Director, Operations Research Center
Acknowledgements
My sincere gratitude goes to Professor Cynthia Barnhart for her constant understanding and support. Her advice contributed in large measures to the success of this dissertation. She has always been an understanding mentor and trusted friend. I have learned many valuable lessons from her.
I sincerely thank Professors Nigel Wilson, Peter Belobaba, and John-Paul Clarke for their invaluable advice. Their insightful comments and suggestions at the committee meetings have contributed greatly to my dissertation.
I am grateful to the Ananda Mahidol Foundation who provides me a wonderful opportunity to pursue my higher education here at MIT. Thanks are also due to faculty members at the Department of Civil Engineering, Chulalongkorn University.
Many thanks go to people at United Airlines, particularly, Raj Sivakumar, Chris Spidle, Amit Mukherjee, and Jon Goodstein, for their assistance.
I wish to thank my colleagues at MIT, notably, Tim Kniker, Andy Armacost, Amr Farahat, Amy Mainville Cohn, Stephane Bratu, Shan Lan, and Su Shen. Their contributions to my research are greatly appreciated. Staffs at the Center for Transportation Studies have been very helpful and supportive. I thank Maria Marangiello, in particular, for her wonderful assistance in all matters.
Many thanks are due to many of my friends both in Thailand and in the US, namely, Kla, Nick, Toey, Tee+, Nog, Nam, Vijak, Jad, Berm, Isra&Sao, Chalee ,Malee, Josh, Pep, Teng, Ya, Kung, Yot, Koi, Oy, Paan, Tao, Eak, and p'Ae. I would like to thank Boy, in particular, for his wonderful suggestions and friendly support.
Finally, I would like to thank the most important people in my life-my family. Their support, love, and blessing are most precious and invaluable to me. I love them all.
Contents
1 Introduction 19
1.1 An Overview of Airline Planning Process . . . . 20
1.1.1 Fleet Planning . . . . 20
1.1.2 Schedule Planning . . . 22
1.1.3 Revenue Management . . . 25
1.1.4 Crew Scheduling . . . 27
1.1.5 Airport Resource Planning . . . 28
1.1.6 An Example of An Airline's Planning Process . . . 29
1.2 Dissertation Objectives and Outline . . . 30
2 The Fleet Assignment Problem: An Overview 33 2.1 Introduction . . . 33
2.1.1 O utline . . . 33
2.2 Assumptions in Airline Fleet Assignment Models . . . . 34
2.2.1 Demand Issues and Assumptions in the Fleeting Process . . . . 34
2.2.2 Network Related Assumption . . . . 36
2.3 Airline Fleet Assignment Literature Review . . . 37
2.4 Review of Airline Fleet Assignment Models . . . 39
2.4.1 N otation . . . 39
2.4.2 Input D ata . . . 40
2.4.3 Fleet Assignment Model . . . 43
2.5 Summary . . . .
3 Network Effects and Recapture in the Airline Fleet Assignment Problem 51
3.1 Introduction ... ... 51
3.1.1 Outline ... ... 52
3.2 Network Effects ... ... 52
3.3 Review of Passenger Mix and Itinerary-Based Fleet Assignment Models . . . . . 55
3.3.1 Terminology and Notation . . . . 55
3.3.2 Passenger Mix Model . . . 58
3.3.3 Itinerary-Based Fleet Assignment Model . . . . 63
3.4 Data . . .. . ... ... ... ... ... .... 68
3.5 Analysis of IFAM Contribution . . . 68
3.5.1 Results and Analysis . . . . 69
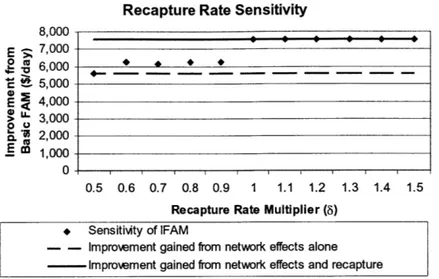
3.6 IFA M Sensitivity . . . 72
3.6.1 Sensitivity of Fleeting Decisions to Recapture Rates . . . . 73
3.6.2 Demand Uncertainty . . . . 76
3.6.3 Imperfect Control of Passenger Choices . . . . 78
3.6.4 Demand Forecast Errors . . . . 79
3.7 Sum m ary . . . . 80
4 Integrated Models for Airline Schedule Design and Fleet Assignment 83 4.1 Introduction . . . . 83
4.1.1 O utline . . . 84
4.2 Demand and Supply Interactions . . . . 84
4.3 Integrated Models for Schedule Design and Fleet Assignment: An Overview . . . 88
4.3.1 Previous W orks . . . . 88
4.3.2 Development Framework . . . . 90
4.4 Supporting Tools . . . . 93
4.4.1 Schedule Evaluation Model . . . . 94
4.4.2 Candidate Flight Generation Model . . . 94
4.5 N otation . . . 103 50
4.6 Schedule Design with Constant Market Share . . . . 4.6.1 An Approximate Treatment of Demand and Supply Interactions 4.6.2 Objective Function . . . . . . . 105 . . . 105 108 4.6.3 Formulation . . . 109 4.6.4 Solution Approach . . . 110 4.6.5 Computational Experiences . . . 114
4.6.6 Full Size Problems . . . 117
4.7 Schedule Design with Variable Market Share . . . 117
4.7.1 An Explicit Treatment of Demand and Supply Interactions . . . 120
4.7.2 Objective Function . . . 122
4.7.3 Formulation . . . 123
4.7.4 Solution Approach . . . .. . . . 125
4.7.5 Computational Experiences . . . 128
4.8 Summary . . . 128
5 Alternative Formulation for the Airline Fleet Assignment Problem
5.1 Introduction . . . .
5.1.1 O utline . . . .
5.2 Network Effects: A Closer Look . . . . 5.2.1 Example: Consistent Passenger Flow and Flight Leg Interdependency
(Network Effects) . . . . 5.2.2 Network Mapping . . . . 5.2.3 Binding Itineraries in the Context of the Fleet Assignment Problem . . 5.2.4 Network Partitions: Isolating Network Effects . . . . 5.2.5 Sum m ary . . . . 5.3 Network Partitioning . . . . 5.3.1 Mathematical Representation . . . . 5.3.2 Elementary, Full, and Complete Partitions . . . . 5.4 An Alternate Formulation for the Fleet Assignment Problem . . . . 5.5 The Subnetwork-Based Fleet Assignment Model Formulation . . . . 5.5.1 Strength of SFAM Formulation . . . .
131 131 . 132 132 132 134 136 . 136 139 139 139 140 140 . 143 145
5.6 Solution Approach . . . 145
5.6.1 Partition Construction . . . 145
5.6.2 Parsimonious Column Enumeration . . . 154
5.6.3 Solving SFAM . . . 155
5.7 Bounds on The Objective Function Values . . . 155
5.8 Computational Experiences . . . 157
5.8.1 Network Partition . . . 157
5.8.2 Problem Size . . . 158
5.8.3 R untim e . . . 158
5.8.4 Contribution . . . 161
5.8.5 Actual Cross-Network Error . . . 162
5.8.6 Strength of Formulation . . . 164
5.9 Sum m ary . . . 164
6 Subnetwork-Based Fleet Assignment Model Extensions 167 6.1 Introduction . . . 167
6.1.1 O utline . . . 167
6.2 SFAM with Recapture . . . 168
6.2.1 Modeling Recapture in SFAM . . . 168
6.2.2 Building Network Partitions for SFAM with Recapture . . . 170
6.2.3 SFAM with Recapture: Formulation and Solution Algorithm . . . 172
6.3 An Alternate Modeling Approach for Recapture . . . 173
6.4 SFAM in the Context of Schedule Design . . . 176
6.4.1 The Schedule Design Problem with Constant Market Share . . . 176
7 Conclusions 179 7.1 Summary of Contributions. . . . 179
7.1.1 Fleet Assignment . . . 179
7.1.2 Schedule Design . . . 181
7.2 Directions for Future Research . . . 182
7.2.2 Multiple Fare Class Models . . . 183 7.2.3 Subnetwork Based Fleet Assignment . . . 183 7.3 Final Thoughts . . . 185
List of Figures
1-1 1-2
An Overview of Airline Planning Process . . . . The Domestic Aircraft Scheduling Process at a Major U.S. Carrier [Adapted from Goodstein (1997)] . . . .
2-1 Unconstrained Leg Level Demand Distribution . . . . 2-2 Constrained (Observed) Leg Level Demand Distribution . . . .
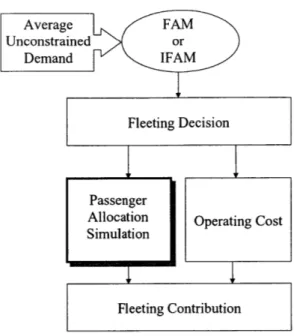
3-1 The direct solution approach for the combined fleet assignment and passenger m ix m odel . . . . 3-2 M ethodology . . . .
3-3 Evaluation of Impacts of Recapture and Network Effects . . . . 3-4 Methodology for Testing Model Senstitivity to Recapture Rate . . . 3-5 Recapture Rate Sensitivity for 1N-3A Data Set . . . . 3-6 Recapture Rate Sensitivity for 2N-3A Data Set . . . . 3-7 Methodology for Simulation 1 (Measuring the Performance of FAM
under simulated environment) . . . . 3-8 Model Sensitivity to Forecast Errors for Problem 1N-3A . . . . 3-9 Model Sensitivity to Forecast Errors for Problem 2N-3A . . . .
and IFAM
Basic Network Structures for n = 4 Cities and n(n - 1) Markets . . . . Master Flight List Construction Diagram . . . . An Outline of the Proposed Candidate Flight Generation Process . . . . Market Categorization Matrix . . . . Proposed Modification Mapping . . . .
. . . 87 . . . 92 . . . 95 . . . 98 . . . 100 21 30 36 37 67 69 70 73 74 75 76 80 81 4-1 4-2 4-3 4-4 4-5
4-6 Frequency Modification Module . . . 102
4-7 Indirect Effect of Recapture Rate and Capacity Constraint on Effective Market Share ... ... ... ... 106
4-8 The Approximate Solution Approach . . . 112
4-9 The solution algorithm for ISD-FAM . . . 113
4-10 Testing M ethodology . . . 116
4-11 Our Approach for Capturing Demand and Supply Interaction . . . 120
4-12 The Exact Solution Approach . . . 126
5-1 An Illustrative Network for Understanding Network Effects . . . 133
5-2 An Example of Network Mapping . . . 135
5-3 Network Partition . . . 138
5-4 Graphical Representation of the Sufficiently Complete Partition in Two Full-Size D ata Sets . . . .. . . .. . . . 147
5-5 Graphical Representation of Our Approach . . . 148
5-6 Subdividing a Subnetwork by Breaking the Potentially Binding Connection . . . 149
5-7 Breaking A Potentially Binding Itinerary . . . 151
5-8 Three Levels of Possible Subnetwork Division . . . 152
5-9 Bounds on Objective Function Value of SFAM . . . 156
6-1 An Example of Network Partition that Does Not Allow Effective Modeling of Recapture ... ... ... .169 6-2 A Conceptual Diagram for Modeling Recapture Externally in the Fleeting Process174
List of Tables
2.1 Flight Connection Example . . . . 48
3.1 D em and data . . . . 52
3.2 Seating Capacity . . . . 53
3.3 Operating costs . . . . 54
3.4 Possible fleeting configurations . . . . 54
3.5 The minimum spill costs and resulting contributions for each fleeting combination 54 3.6 The contribution using a greedy algorithm . . . 54
3.7 PMM Model Example: Flight Schedule . . . 59
3.8 PMM Model Example: Itinerary Level Demand . . . 59
3.9 The characteristics of the data sets . . . 68
3.10 The improvement in the fleeting contribution for data set 1N-9 in dollars per day compared to basic FAM. . . . 70
3.11 The improvement in the fleeting contribution for data set 2N-9 in dollars per day compared to basic FAM. . . . 70
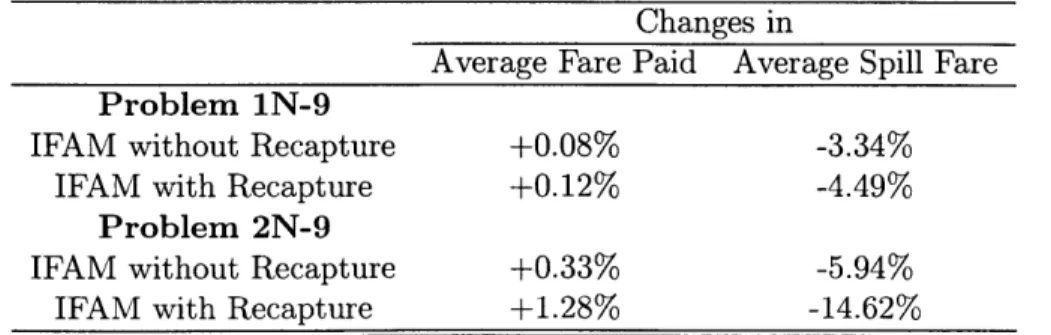
3.12 The changes in average fare paid and average spill fare compared to basic FAM. 71 3.13 Comparison of the Performance of FAM and IFAM in Simulation 1 ($/day).... 77
3.14 Comparison of the Performance of FAM and IFAM in Simulation 2 ($/day).. . . 78
4.1 Data Characteristics . . . 115
4.2 Contribution Comparision . . . 118
4.3 Problem Sizes (RMP's) and Solution Times . . . 118
4.5 Data Characteristics . . . 118
4.6 Contribution Comparison . . . 119
4.7 Resulting Schedule Characteristics . . . 119
4.8 Problem Sizes (RMP's) and Solution Times . . . 119
4.9 Contribution Comparison . . . 127
4.10 Problem Sizes (RMP's) and Solution Times . . . 127
4.11 Resulting Schedule Characteristics . . . 127
5.1 Examples of Consistent Passenger Flows . . . 134
5.2 Leg-Level Demand . . . 136
5.3 Number of Potentially Binding Itineraries in Full Size Data Sets . . . 137
5.4 Itinerary D ata . . . 142
5.5 Fleet Type Data . . . 142
5.6 Example of Composite Variables . . . 146
5.7 Sufficiently Complete Partition . . . 146
5.8 Example of Composite Variables . . . 154
5.9 The characteristics of the data sets . . . 157
5.10 Network Partitions for Data Set 1N-9 . . . 157
5.11 Network Partitions for Data Set 2N-9 . . . 158
5.12 Problem Sizes for Data Set 1N-9 . . . 159
5.13 Problem Sizes for Data Set 2N-9 . . . 159
5.14 Runtimes (sec) for Data Set 1N-9 . . . 160
5.15 Runtimes (sec) for Data Set 2N-9 . . . 160
5.16 Contributions ($/day) for Data Set 1N-9 . . . 161
5.17 Contributions ($/day) for Data Set 2N-9 . . . 163
5.18 Actual Cross-Network Errors ($/day) for Data Set 1N-9 . . . 163 5.19 Difference between the Root Node LP Relaxation and Best IP Solutions ($/day) 164
Chapter 1
Introduction
In scheduled passenger air transportation, airline profitability is critically influenced by the airline's ability to construct flight schedules containing flights at desirable times in profitable markets (defined by origin-destination pairs). Airlines engage in a complex decision making process generally referred to as airline schedule planning, which is comprised of many tasks (detailed in Section 1.1), in order to produce operational schedules. Generating an optimal schedule for any given period is of utmost interest and importance to the airlines. In the past, these tasks are divided and optimized in a sequential manner because the integrated model to optimize the entire process is enormous and unsolvable. Today, advanced technologies and better understanding of the problems have allowed operations researchers to begin integrating and globally optimizing these sequential tasks.
In this dissertation, we are interested in particular in the airline schedule design and fleet
assignment problems. The schedule design problem involves selecting an optimal set of flight
legs to be included in the schedule based on forecasted demand, while the fleet assignment problem involves optimally assigning aircraft types to flight legs to maximize revenue and minimize operating cost. We review and validate existing fleet assignment models and present a new approach. Based on the knowledge of the fleet assignment problem, we propose new approaches to integrate the airline schedule design and fleet assignment problems.
1.1
An Overview of Airline Planning Process
In order to facilitate the comprehension of this complex decision making process, we refer to Figure 1-1, which simplifies the airline planning process into several sequential steps. On the left axis of Figure 1-1, the vertical bar describes the time horizon of this sequential process from several years out to a few days before flight departures. The right axis categorizes the nature of the decisions involved in this planning process, ranging from strategic at the top down to tactical/operational decisions at the bottom. Note, however, that different approaches are taken at different airlines; thus, the steps depicted in Figure 1-1 should be interpreted only as a representative approach.
1.1.1 Fleet Planning
The first step in creating an operational airline schedule is fleet planning, in which the airline decides how many and what types of aircraft it should acquire, either through buying or leas-ing. Fleet planning is one of the most important strategic decisions and involves huge capital investment. Major fleet planning is done infrequently and each decision has long lasting ef-fects and implications that will greatly affect, or often times restrict, the downstream planning process. Minor revision of the fleet planning is done more frequently and often affects only a small number of aircraft. There are two major approaches to fleet planning (Belobaba, 1999):
1. "Top-Down" Approach, and 2. "Bottom-Up" Approach.
The "top-down" approach involves high level, system wide financial analysis of the impacts of options. It typically utilizes system level estimates of demand, revenue, and aggregate cost information. This approach is most common in practice because it does not involve sophisticated models or detailed analysis, requiring a full range of assumptions and unreliable forecasts, for uncertain 5 - 15 year scenarios.
The "bottom-up" approach, however, goes through a series of detailed simulations of airline operations, ranging from route structure to operations. This approach depends heavily on the quality of the data, especially the detailed forecasts of future scenarios.
.o Schedule Design
o Fleet Assignment
0 Aircraft Rotations
F* i 0
Revenue Crew Scheduling
Management - Pricing
- Seat Inventory Airport Resource ControlPlanning
Vaysse (1998) presents an example of models in the "bottom up" family. Her approach can be decomposed into two dimensions; namely, single-period demand allocation and multi-period fleet optimization. The former focuses on allocations of passengers to schedules, maximizing potential profitability. The latter focuses on optimal assignments of aircraft types to schedules from different periods, minimizing operating cost and maintaining consistency of fleet family.
Once an airline selects particular fleets, it often commits to them for a very long period of time. Thus, most of the time, the rest of the planning process will take as given the fleet family. There has not been efforts to integrate fully the fleet planning decision into the rest of the planning process because the time horizon involved in fleet planning differs greatly from the rest of the planning process. Thus, in this paper, we will also assume that the fleet composition of the airline is given. Note, however, that some of the tools developed for the rest of the planning process, in particular, those for the schedule design and fleet assignment steps, can be adapted and used for fleet planning purposes, as we will explain later.
1.1.2 Schedule Planning
The schedule planning step typically begins 12 months before the schedule goes into operation and lasts approximately 9 months. Airlines spend a great amount of time and resource in this step in order to come up with a competitive and profitable schedule. In the beginning, the schedule planning step begins with route development, in which the airline decides which
markets, defined by origins and destinations, it wants to serve, based primarily on system-wide
demand information. Major route developments are done infrequently, typically at the launch of the airline operation and afterwards in major route revisions, such as the introduction of a new hub . Most of the time, the schedule planning step starts from an existing schedule, with a well developed route structure. Changes are then introduced to the existing schedule to reflect changing demands and environment; this is referred to as schedule development. There are three major components in the schedule development step:
1. Schedule Design, 2. Fleet Assignment, and 3. Aircraft Rotations.
As pointed out earlier, these sequential steps should not be interpreted as a standard, rather they facilitate our understanding of the process. Different airlines have different tools, culture, and management styles, and therefore, the actual implementations may differ in the details.
Schedule Design
The schedule design step is arguably the most complicated step of all and traditionally has been decomposed into two sequential steps:
1. frequency planning, and
2. timetable development.
In frequency planning, planners determine the appropriate service frequency in a market. In timetable development, planners place the proposed services throughout the day subject to approximate network considerations and other constraints.
Frequency Planning. The objective of frequency planning is to match daily or weekly fre-quency to the anticipated demand in every market ensuring that the level of demand anticipated and the frequency are balanced and reasonable. This depends on many market-dependent factors, such as length of haul and market type, for example. If the market is a long-haul inter-national market, the airline might be able to offer only a limited number of flights daily, while in a popular short haul domestic market, hourly flight offerings are common. If the market is composed heavily of business travelers, then schedule convenience measured in terms of flight availability is important, and thus, frequent flight offerings are necessary to build presence in the market. On the other hand, if the market is composed primarily of leisure travelers, flight availability is of lesser importance and high levels of frequency are not necessary.
Teodorovic and Krcmar-Nozic (1989) present a methodology that determines optimal flight frequencies on a network maximizing total profit and market share and minimizing the total schedule delay of all passengers on the network. They incorporate approximate vehicle consid-erations by setting a maximum number of services in each market and a maximum number of seat-hours (a measure of an airline's production level) for the entire system.
Timetable Development. After the airline decides how many flights it wants to offer in each market, the next step is to decide at what times should these flight be offered. This depends on market characteristics as well as schedule constraints. For example, in business markets, hourly flight offerings are desired because it gives business travelers both schedule availability and reliability. The departure times of these flights, however, have to be synchronized such that the schedule is (or potentially is) flyable by the available number of aircraft.
Berge (1994) presents a sub-timetable optimization approach, in which sub-timetable, a small part of the network, is optimized and augmented to the master (existing) timetable. The sub-timetable optimization model takes as input, among other things, a list of candidate flight legs specified by origin, destination, departure and arrival times. The model optimized the schedule by selecting flight legs that maximize market coverage, the probability that a random passenger finds at least one path, i.e., a sequence of flight legs from origin to ultimate destination, in his/her decision window. Full scale timetable optimization is still not feasible currently because of its size and complexity (Belobaba, 1999).
Fleet Assignment
The purpose of fleet assignment is to assign the available aircraft to every flight leg such that the seating capacity on the aircraft closely matches the demand for every flight. If too small an aircraft is assigned to a particular flight, many potential passengers are turned away, or spilled, resulting in potential lost revenue. On the other hand, if too big an aircraft is assigned to a particular flight, many empty seats, which can potentially be utilized more profitably elsewhere, are flown. The assignment of aircraft to flight legs has to respect conservation of aircraft flow, that is, an aircraft entering a station has to leave that station at some later point in time. The airlines cannot assign more aircraft than are available. If the schedule cannot be fleeted with the available number of aircraft, minor changes must be made to the schedule.
Dantzig (1954), Daskin and Panayotopoulos (1989), Abara (1989), Hane et al. (1995), Rexing et al. (2000), Barnhart, Kniker, and Lohatepanont (2001), and Jacobs, Smith and Johnson (2000) study the fleet assignment problem from many aspects. The fleet assignment with time windows model by Rexing et al. (2000), in particular, allow minor re-timing of flight legs, thus potentially allowing otherwise infeasible schedules to be fleeted. The itinerary-based
fleet assignment model by Barnhart, Kniker, and Lohatepanont (2001) improves upon the basic fleet assignment model by Hane et al.(1995), by considering network effects and recapture. Network effect refers to the problem of inconsistent passenger flow that might occur because of flight leg independence assumptions in the basic fleet assignment model. Recapture happens when some of the otherwise spilled passengers are recaptured by the airline on other flight legs in the system.
Aircraft Rotations
The objective of the aircraft rotation step is to find a maintenance feasible rotation (or rout-ing) of aircraft, given a fleeted schedule (from the previous step) and the available number of aircraft of each type. A rotation is a sequence of connected flight legs that are assigned to a specific aircraft, beginning and ending at the same location, over a specific period of time. A
maintenance feasible rotation is a routing of an aircraft that respects the maintenance rules of
the airlines and regulatory agencies.
Note that in many fleet assignment models (for example, Hane et al 1995, and Clarke et al 1996), maintenance requirements are modeled only approximately by ensuring a sufficient number of maintenance opportunities for each fleet type. A maintenance opportunity exists when an aircraft overnights at one of its maintenance locations. While this ensures that, on average, enough aircraft of each type are in maintenance nightly, it does not guarantee that individual aircraft are treated equally: one aircraft might have one maintenance opportunity per day while another might not have any in a week. The aircraft maintenance routing problem addresses this issue in detail.
Simpson (1969) reviews several models for the aircraft routing problem. Recent works in this area include Gopalan and Talluri (1993), Clarke et al. (1996), and Barnhart et al. (1997). In Barnhart et al. (1997), maintenance routing is integrated with fleet assignment and applied to an application involving a long-haul flight schedule.
1.1.3 Revenue Management
Given a fleeted schedule, the objective of revenue management is to maximize revenue. An ideal revenue management system consists of two distinct but closely related components (Belobaba,
1987):
1. differential pricing, and 2. seat inventory control.
Pricing
After deregulation in 1978, the airline industry has evolved significantly from an industry with very stable pricing to one with a volatile and complicated pricing structure. Most airlines now practice price differentiation, that is, offering different "fare products" with different restrictions at different prices (Belobaba, 1999). This concept fully takes advantage of the economic concept of passenger "willingness to pay1". The differential price offering aims to stimulate demand with low fare offerings and to capture the willingness to pay of high fare passengers. Fare restrictions attempt to prevent demand dilution from diversion-the pattern of existing high fare passengers opt to take advantage of low fare offering.
There are a number of papers in this area, including, for example, Oum, Zhang, and Zhang (1993), Weatherford (1994), Gallego (1996), and Gallego and Van Ryzin (1997).
Seat Inventory Control
The objective of seat inventory control is to determine the number of seats on a flight to be made available to a particular fare product. The idea is to limit low-fare seats and protect higher-fare seats for later-booking passengers. Airlines utilize a set of tools to achieve this objective (Belobaba, 1992):
1. overbooking: acceptance of bookings in excess of capacity to minimize the potential empty seats on board,
2. fare class mix: limiting the availability of seats sold at various price levels on a flight leg; and
1 In short, the same product can be sold for different prices to different consumers based on the values that the consumers associate with the product. If the product is of higher value to a consumer, the producer would charge a higher price knowing that he/she would pay for it. On the other hand, if the product is of lesser value to another customer, the producer would alternatively charge a lower price to that customer. In an ideal world, if the producer could charge each customer the highest price he/she would be willing to pay, the producer's profit would be maximized.
3. itinerary control: discrimination among passengers traveling on different multiple leg itineraries.
Overbooking and fare class mix have been the focus of early revenue management efforts (see Belobaba, 1989, 1992, Curry, 1990, Brumelle et al., 1990, and Wollmer, 1992, for example). Recent development is progressing towards origin-destination or network level inventory control, that is, a move towards incorporating itinerary control (see, for example, Simpson, 1989, Smith
et al., 1992, Williamson, 1992, and Bratu, 1999).
One of the most crucial inputs for any seat inventory control practice is the forecasted demand. The level of detail differs for each model, ranging from leg-based fare classes to origin-destination-based fare classes (see, for example, Heureux, 1986, Lee, 1990, Gallego, 1996, and Kambour, Sivaramakrishnan, and Boyd, 2000).
Clearly there are many potential benefits to be gained from integrating pricing and seat inventory control into one seamless revenue management system (Marcotte and Savard, 2000, and Lieberman, 2000). Surprisingly, these tasks are still performed separately at most airlines, often by different departments. This arises partly because of the dominant practice in airline pricing of "matching" fares offered by competitors (Belobaba, 1987).
1.1.4 Crew Scheduling
In crew scheduling, the objective is to find the minimum cost assignment of flight crews (pilots and/or flight attendants) to flight legs subject to several restrictions, some of which are: pilots are qualified to fly only certain aircraft types; work schedules must satisfy maximum
time-away-from- base (the period that flight crews are away from their domicile stations) restrictions;
crews are not allowed to stay on duty longer than a maximum flying time requirement; and work schedules must satisfy minimum rest time. Crew scheduling is typically broken into two steps (Barnhart and Talluri, 1996):
1. the crew pairing problem, and 2. the crew assignment problem.
The objective of the crew pairing problem is to find a set of work schedules that cover each flight the appropriate number of times and minimize total crew costs. Crew pairing
problems are usually formulated as Set Partitioning problems where each row corresponds to a scheduled flight and each column corresponds to a legal crew pairing (1997). A pairing is composed of duties, separated by rest periods. A duty is a sequence of flight legs to be flown consecutively in one day that satisfies all work rules. In some instances, deadheading (flight crews being repositioned by flying as passengers) is allowed. Deadheading can be advantageous, especially in long-haul crew pairing problems as shown by Barnhart et al. (1995). Vance et al. (1994) present a formulation for crew pairing optimization with decision variables based on duty periods rather than pairings. Subramanian and Marsten (1994) present an integrated model for the fleet assignment and crew pairing problems.
In crew assignment, these pairings are combined with rest periods, vacations, training time, etc., to create extended work schedules that can be performed by an individual. The objective of the crew assignment problem is to find a minimum cost assignment of employees to these work schedules. There are two traditional approaches for crew assignment:
1. rostering, and
2. bidline generation.
With rostering, a common practice in Europe, schedules are constructed for specific individ-uals. A subset of schedules is selected such that each individual is assigned to a schedule, and all pairings in the crew pairing problem solution are contained in the appropriate number of sched-ules. With bidline generation, a common practice in North America, the cost-minimizing subset of schedules is selected without referring to specific individuals. Employees then reveal their relative preferences for these schedules through a bidding process. The airline assigns schedules to employees based on individual priority rankings, which are often related to seniority.
1.1.5 Airport Resource Planning
Primary tasks that are done in the airport resource planning step are gate allocation, slot al-location (if applicable), and ground personnel scheduling. Gate allocation involves assigning available gates at stations to arriving and departing aircraft such that all flight legs are covered, aircraft servicing can be accomplished, and passenger connections can be made within
reason-able amounts of time. See, for example, Mangoubi and Mathaisel (1984), Vanlaningham and
West (1988), and Richardson (1991).
Slot allocation is closely related to gate allocation but only applies to slot controlled airports. In the U.S., these are Washington National, New York J.F.K., New York LaGuardia, and Chicago O'Hare airports. At these airports, the number of takeoffs and landings (slots) is controlled by regulatory agencies in order to alleviate flight delay problems resulting from congestion. Slots are allocated, by an allocation committee, in advance, to carriers serving these airports. Airlines have to schedule according to the slots allocated, which must be synchronized with gate allocation and incorporated into the schedule building process in order to avoid potential infeasibilities or violations.
Ground personnel scheduling involves scheduling staff to several airport ground positions, including check-in agents, gate agents, aircraft servicing staff, luggage handling staff, and field staff. See for example, Buch (1994), and White (1997).
1.1.6 An Example of An Airline's Planning Process
Figure 1-2 depicts the domestic aircraft scheduling process at a major U.S. carrier (Goodstein, 1997). The fleet planning and route development processes begin as much as 5 years before the departure date. The period from one year to 52 days before the departure date is divided into three phases:
1. Schedule Planning (1 year to 108 days before the departure date), 2. Intermediate Scheduling (108 to 80 days before the departure date), and 3. Current Scheduling (80 to 52 days before the departure date).
In Schedule Planning, planners prepare a schedule for the next period by modifying existing schedules. This step requires a relatively long amount of time to perform because of the com-plexity involved. At this step, operational constraints are incorporated only approximately. Once a schedule is developed, the Intermediate Scheduling group begins to investigate the op-erational feasibility of the proposed schedule in terms of fleet assignment, maintenance routing, crew scheduling, etc. Revenue management begins when the schedule goes into the Current
S 5 years 1 year Interm Sche chedul lannin Current Scheduling ediate duling e g 108 days 80 days 52 days Profit Focus
Operational Feasibility Focus
Figure 1-2: The Domestic Aircraft Scheduling Process at a Major U.S. Carrier [Adapted from
Goodstein (1997)]
Scheduling phase. Minor changes can be made to the planned schedule as additional data be-come available. Demand data is of particular interest because re-fleeting models (Goodstein, 1997) are available to modify the fleeting decisions slightly in order better to match capacity with demand, as the departure date approaches. Notice also that the focus or objectives of planners shift from profitability maximization to operational feasibility as we move from the early stages of planning to the departure date.
1.2
Dissertation Objectives and Outline
Earlier in this chapter, we present a detail overview of the airline planning process. In this dissertation, our primary focus is on schedule design and fleet assignment. In Chapter 2, we present an extended review of the fleeting process. In particular,
1. modeling assumptions of most fleet assignment models are explained in detail; 2. we present relevant literature on airline fleet assignment; and
r-3. we review basic fleet assignment models.
In Chapter 3, we review an enhanced fleet assignment model, the itinerary-based fleet assignment model (Barnhart, Kniker, and Lohatepanont, 2001), which we use to study the influence of network effects and recapture in the fleeting process. Network effects refer to the phenomenon in which flight legs in the network interact when passengers travel on more than one leg. Recapture occurs when some of the otherwise spilled passengers are re-accommodated on alternate itineraries in the system. We present a set of experiments designed to validate several assumptions used in this enhanced model.
Integration of the fleeting and schedule design processes is of particular interest to us and will be accomplished by extending the itinerary-based fleet assignment model (Barnhart, Kniker, and Lohatepanont, 2001). Two models will be developed, in Chapter 4, based on two different models of airline market share:
1. Constant Market Share, and 2. Variable Market Share.
In the constant market share case, we assume that the market share of the airline remains constant with schedule changes; whereas in the variable market share case, the market share of the airline changes with schedule changes. While the constant market share assumption might not be accurate under all scenarios, we will demonstrate its applicability. Its advantage is its superior tractability relative to variable market share models. We will investigate the performance of variable market share models under other scenarios, and report computational results.
We revisit the issue of network effects in the fleeting process in Chapter 5. We are inter-ested in understanding how network effects arise and how exactly flight legs interact with each other. Based on this knowledge, we present a new approach for solving the fleet assignment problem. It attempts to model passenger flow more accurately without explicitly considering actual passenger flow variables. The model formulation and solution algorithms are presented. The primary advantage of this approach is its potential to integrate with other airline planning problems, such as schedule design or aircraft maintenance routing. In Chapter 6, we discuss
some possible extensions of our new fleeting model presented in Chapter 5. The extensions include recapture and application to the schedule design problem. Finally, in Chapter 7, we present a summary of contributions and directions for future research.
Chapter 2
The Fleet Assignment Problem: An
Overview
2.1
Introduction
In general, the fleet assignment problem involves assigning available aircraft to flight legs such that revenue is maximized and simultaneously operating cost is minimized. Although the application of operations research techniques to the fleet assignment problem can be traced as far back as 1954 by Dantzig and Ferguson (1954), there are many aspects of the problem that are yet to be investigated thoroughly. In this chapter we describe some of the underlying assumptions used in most fleet assignment models and provide a review of recent literature. Two basic fleet assignment models are reviewed to provide a basis for our discussions in the remainder of this dissertation.
2.1.1 Outline
In Section 2.2, we detail some of the assumptions used in most fleet assignment models. Next, in Section 2.3, we review the airline fleet assignment literature. We present one of the most basic formulations for the fleet assignment problem and an extension in Section 2.4. Finally, we provide concluding remarks in Section 2.5.
2.2
Assumptions in Airline Fleet Assignment Models
Recall from Figure 1-2 that airlines start the fleeting process long before the schedule become effective. One could imagine that there are many uncertainties that could affect the selected fleeting. Major airlines, however, cannot afford to wait until the very last minute until every-thing is more certain to start planning their schedule because of the scale and complexity of their operations. Therefore, assumptions have to be made to allow getting the planning process started. Additional assumptions might be needed as well from a modeling standpoint. In this section, we discuss those assumptions underlying the airline fleet assignment process.
2.2.1 Demand Issues and Assumptions in the Fleeting Process
Every fleet assignment model requires as input an estimate of demand at flight leg or itinerary level. In this section, we discuss how such demand forecasts can be developed, focusing on the underlying assumptions. There are a number of factors that complicate the demand forecasting process, namely:
1. fare class differentiation, 2. demand variation,
3. observed vs. unconstrained demand, and 4. demand recapture.
Fare Class Differentiation
After the deregulation of the U.S. airline industry in 1978, price differentiation has become a normal practice. As a result, demand is categorized based on the fare level. An ideal fleet assignment model would recognize this differentiation, that is, the passenger pool is non-homogeneous-some passengers pay higher prices while others pay lower fares. Most fleet assignment models, however, assume that there is only one fare class-an average fare, typically. Thus, these models require that different fare class demands be aggregated into one fare class, using various assumptions. Belobaba and Farkas (1999) refer to this kind of aggregation as
Farkas (1996) and Kniker (1998) show that fare class differentiation can theoretically be recognized in fleet assignment models. To our knowledge, there have been no attempts, how-ever, to solve fare class differentiated fleet assignment models on large scale problems.
Demand Variation
Air travel demand varies by day of week as well as by season, that is, the numbers of passengers for a given flight on different days are different. We focus on day-of-week variations because airlines often maintain a consistent fleeting throughout the week (Belobaba and Farkas, 1999). Because the fleeting remains largely the same throughout the week, while demand varies from day to day, a representative demand is needed for the fleet assignment model. In particular, demands from different days of the week must be aggregated into a representative day demand. Belobaba and Farkas (1999) refer to such aggregation as horizontal aggregation.
It should be noted, however, that solving day-of-week fleet assignment models is feasible computationally. Day-of-week fleet assignment models, however, likely alter the fleeting from day to day, resulting in highly complicated operations. Thus, major U.S. airlines have not taken steps to move to day-of-week fleeting models.
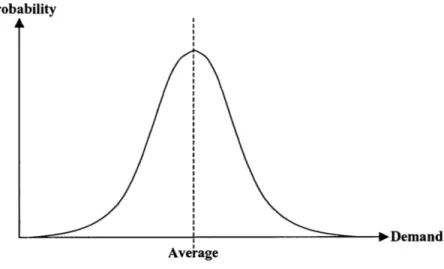
Note that it is generally assumed that aggregated demand distribution at the leg level follows a Guassian distribution (Belobaba and Farkas, 1999). Thus, most fleet assignment models often take as input such aggregated, leg level demand distributions. This assumed distribution is used to derive the profitability of assigning a fleet type to a flight leg (see Section 2.4.3 for detailed descriptions).
Observed vs. Unconstrained Demand
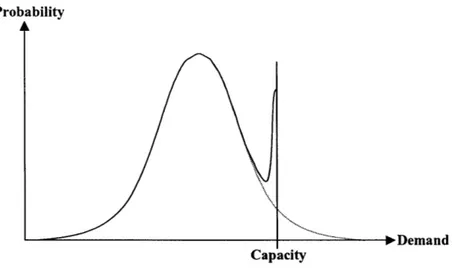
Virtually all of the fleet assignment models take as input some form of unconstrained demand, that is, the maximum demand for air travel that an airline can experience regardless of the airline's network capacity. Figure 2-1 depicts an example of unconstrained demand at the leg level. All of the observed demand data, however, is constrained demand, which reflects network capacity. Figure 2-2 depicts typical constrained demand data observed at the leg level. In particular, the distribution is truncated at the capacity of the fleet type assigned to that leg. Therefore, these observed data must be "unconstrained" by planners, using some assumptions
Probability
ooDemand Average
Figure 2-1: Unconstrained Leg Level Demand Distribution
regarding the demand distribution. Oppitz and Pblt (1997) present an example of the demand unconstraining process.
Demand Recapture
Recapture occurs when some of the otherwise spilled passengers are accommodated on alternate itineraries in the system. That is, passengers are accommodated on alternate itineraries because their desired itineraries are not available due to limited capacity. Most fleet assignment models ignore recapture. Modeling recapture is difficult partly because it is difficult to observe. Kniker, Barnhart, and Lohatepanont (2001) present a way of modeling recapture in the fleeting process, utilizing a set of assumptions. We review their model in Chapter 3 and test some of these assumptions.
2.2.2 Network Related Assumption
Most fleet assignment models assume that flight legs are independent of one another. This
flight leg independence assumption is not true because a significant proportion of passengers,
especially in the U.S., travel on multi-leg itineraries, resulting in flight leg interdependencies in the network. Specifically, fleet assignment models that assume flight leg independence
Probability A
---.. ...-... D em and Capacity
Figure 2-2: Constrained (Observed) Leg Level Demand Distribution
contain revenue estimation errors due to connecting passengers traveling on only a portion of their multi-leg itineraries. We discuss this assumption in detail in Chapter 3 and provide quantitative evidence that by making this assumption, fleet assignment models can ignore an important aspect of the problem.
2.3
Airline Fleet Assignment Literature Review
Typically, the fleet assignment model takes as input the available types and numbers of aircraft and a given schedule with fixed departure times. The objective of the fleet assignment problem is to find the contribution maximizing assignment of aircraft types to flight legs such that:
1. each flight leg is assigned to exactly one aircraft type;
2. the number of flights assigned to an aircraft type into and out of a location are equal (or balanced); and
3. the number of aircraft of each type assigned does not exceed the number of each type available.
Additional constraints considering maintenance requirements, noise and gate constraints can also be included. The fleeting contribution (or contribution) is defined as the total passenger
revenue less the total flight operating costs, ignoring aircraft ownership costs, overhead costs, etc. Another objective function for the fleet assignment model is the one that minimizes the
assignment cost, defined as the summation of total flight operating costs and total estimated spill cost. The estimated spill cost is the cost incurred when insufficient capacity is assigned
to a flight leg and passengers are not accommodated, or are spilled, on this flight leg. Under certain conditions, it can be shown that the two objective functions are equivalent (see Chapter 3). Section 2.4.3 describes in greater details several heuristics that are used to estimate the spill costs.
The application of linear programming to fleet assignment problems can be traced back as early as 1954 by Dantzig and Ferguson (1954). They consider the fleet assignment problem for non-stop routes. They formulate the problem as a linear program thus allowing fractional solutions. However, fractional solutions might not be critical if the assignment is considered over some period of time since, in most cases, planners would be able to find integer solutions for different sub-period intervals (e.g., days in a weekly schedule) that yield these fractional averages.
Developments in this area throughout the years have been impressive. Recent developments include Daskin and Panayotopoulos (1989), Abara (1989), Hane et al. (1995), Rexing et al. (2000), and Jacobs, Smith and Johnson (2000). Daskin and Panayotopoulos (1989) present an integer programming model that assigns aircraft to routes, use Lagrangian relaxation to obtain lower bounds on the optimal objective value and develop heuristics to obtain a feasible solution. Abara (1989) presents a model that uses the underlying connection arcs as decision variables, often leading to an explosion in the number of variables. A limitation of his model is that it does not allow different turn times (minimum ground service times) for different fleet types at various locations.
The basis for several fleet assignment models currently used by the airlines in the industry is the model proposed by Hane, et al.(1995). They model the fleet assignment problem as a multicommodity network flow problem, where fleet types are to be assigned to flight legs in the network once, using only the available number of aircraft. Several problem size reduction techniques are devised, for example, node consolidation and island construction. Node consoli-dation is used to reduce the number of nodes by separating a consolidated series of arrival nodes
from a consolidated series of departure nodes. Island construction is employed mostly at spoke stations where flight connections occur sparsely during the day. Rexing et al. (2000) presents an expanded fleet assignment model, based on the model by Hane et al. (1995), allowing flight re-timings within small time window. Jacobs, Smith and Johnson (2000) present an iterative method for solving the fleet assignment model that enhances the spill estimation process, which is static in the basic (Hane et al 1995) model. The algorithm begins by solving a special LP relaxation of the basic fleet assignment model on an instance of estimated passenger flow. The results are then used to revise the passenger flow in the network. The algorithm keeps iterating until certain conditions are achieved. The integer solution is obtained afterward.
2.4
Review of Airline Fleet Assignment Models
In this section, we review three variations of the Fleet Assignment Models, namely, 1. Basic Fleet Assignment Model (FAM),
2. Fleet Assignment Model with Time Windows (FAMTW).
The basic fleet assignment model or FAM, as its name suggests, serves as the basis for most of other variations. The fleet assignment with time windows model is built on the basic FAM by allowing slight re-timing of flight departure and/or arrival times. It enhances the fleeting decision by allowing greater flexibility in flight connections. Before describing each model in details, we present the complete list of notation.
2.4.1 Notation
Sets
A: the set of airports indexed by o.
L: the set of flight legs in the flight schedule indexed by i. K: the set of different fleet types indexed by k.
T: the sorted set of all event (departure or availability) times at all airports, indexed by tj.
N: the set of nodes in the timeline network indexed by {k, o, tj}. Nki: the set of copies of flight leg i E L for fleet type k E K.
CL(k): the set of flight legs that pass the count time when flown by fleet type k. I(k, o, t): the set of inbound flight legs to node {k, o, tj}.
O(k, o, t): the set of outbound flight legs from node {k, o, tj}.
Decision Variables
=k,i: 1 if flight leg i E N is assigned to fleet type k
E K; 0 otherwise.
n,k,i: = I if copy n E Nki of flight leg i E N is assigned to fleet type k E K;
{
0 otherwise.Yk,,t+: the number of fleet type k E K aircraft that are on the ground at airport o E A
immediately after time tj E T.
Yk,O,t: the number of fleet type k aircraft that are on the ground at airport o E A immediately before time tj E T. If ti and t2 are the times associated with adjacent events, then
Ykot = Yk,o,t<*
Parameters/Data
Nk: the number of aircraft in fleet type k, Vk E K.
Ck,i: the assignment cost when fleet type k E K is assigned to flight leg i E L.
Cnki: the assignment cost when fleet type k E K is assigned to copy n E Nki of flight leg i E L.
2.4.2 Input Data
Most fleet assignment models require as input three types of data:
1. flight schedule
3. fleet characteristics
Flight Schedule
Define a flight leg or flight as an aircraft flight taking off from an origin and landing at a destination. The flight schedule specifies origins, destinations, departure and approximate arrival times of all flight legs in the network. (Actual schedule arrival times depend also on the assigned fleet types.) Planners determine this flight schedule in the schedule design step (recall Figure 1-1) taking into account approximate information of available fleet types and crews. In the fleet assignment step, the schedule is considered fixed.
Actual airline schedules remain largely constant during weekdays, but are significantly dif-ferent for weekends. The general practice at airlines is to solve the daily fleet assignment model for a "representative" day of the week (usually Wednesday) and assume that every week day repeats similarly. Minor adjustments are made manually for slight differences that occur during weekdays. One input into the fleet assignment model, therefore, is the network schedule for the representative weekday. For weekend schedules, the fleet assignment model is resolved, using weekend schedules. The connections between the end of Friday and the start of Saturday, and the end of Sunday and the start of Monday can be determined manually or with help from automated tools.
In this dissertation, all flight schedules are obtained from a major U.S. airline. Full size schedules represent daily operations of a major U.S. airline, containing 5 major hub airports and approximately 150 spoke airports. The hub-and-spoke network has significant connect-ing activities occurrconnect-ing frequently at the hub airports. Smaller schedules are generated by extracting parts of full-size schedule, including at least one hub airport.
Demand and Fare Data
Demand for a future flight schedule is typically forecasted based on historical data. The forecasting model takes into account flight schedules of other carriers as well as other projected socioeconomic data. In general, a total (unconstrained) demand for air travel in each market (origin-destination pair) is first forecasted. This total market demand is then allocated to each carrier depending on a number of service-related factors, including daily frequency, departure
time, and fare, for example. Specifically, total demand for a market m is allocated to itineraries, which are sequences of flight legs, in market m to produce unconstrained itinerary-level demands. A standard allocation approach in the industry is to use Quantitative Share Index (QSI), that is, a measure of the "attractiveness," based on service-related factors, of an itinerary relative to the entire set of all itineraries (including those of competing airlines) in that market. Unconstrained demand for a carrier is defined as the sum of the unconstrained itinerary-level demands of that carrier. We refer to unconstrained demand as the (share of) demand in a market experienced by the carrier of interest.
Note that for other purposes, such as revenue management, demand is forecasted at even finer levels. In particular, revenue management requires demand forecasts at itinerary, fare class levels. That is, for each itinerary, itinerary-level demand is further allocated to several available fare class buckets. Most fleet assignment models do not account for fare class differentiation, therefore, itinerary-level demand suffices for the purpose of our research.
An average fare is often used to represent the revenue generated from accommodating a passenger on his or her itinerary. This fare is averaged from different fare classes available on that itinerary. To the best of our knowledge, no major U.S. airlines have successfully solved fare-class differentiated fleet assignment models on large scale problems.
Because air travel demand is subject to forecast errors, in Section 3.6, we provide a sensitivity analysis on how demand forecast errors can affect fleet assignment models.
Fleet Data
Fleet data specifies the types of aircraft available. For each aircraft type, the number of seats, minimum turn time, and operating costs are specified. The minimum turn time is the least amount of time required for an arriving aircraft to be serviced before taking off on its next departure. Operating costs are fleet-type and flight-leg dependent. Thus, fleet type k assigned to flight leg i and fleet type 1 assigned to flight leg i have different associated operating costs. For each flight leg, operating costs of all assignable fleet types are specified.

![Figure 1-2: The Domestic Aircraft Scheduling Process at a Major U.S. Carrier [Adapted from Goodstein (1997)]](https://thumb-eu.123doks.com/thumbv2/123doknet/13914768.449263/30.918.175.721.117.485/figure-domestic-aircraft-scheduling-process-carrier-adapted-goodstein.webp)