Removal of dyes from textile effluents by chemical coagulation
M. Janeczko, S. Gaydardzhiev
Brandenburg University of Technology, Cottbus, Germany
ABSTRACT: Surface charge density studies as well as characterizations of coagulated dye sludge were investigated to explain the mechanism which takes place during removal of dyes from effluents by chemical coagulation. A simple laboratory model was used to compare two commercially used textile azo dyes: CI “Reactive Black 5” and “Acid Black 1” that were coagulated with synthetic primary coagulants have been chosen. Parallel to measurement of surface charge density of coagulated dye sludge, size and shape analysis of flocs was done in order to link surface charge data with floc properties and on this basis to outline the predominant mechanism of colour removal.
1 INTRODUCTION
The efficient removal of dyes from textile wastewaters is still a major challenge both for scientific and industrial community. Discharge of coloured effluents has pronounced harmful impact on recipient streams; due not only to aesthetical problems but also by reducing light penetration which can cause the changes in photosynthetic activity of aquatic life. Textile colorants cover approximately 11 000 types of different dyes and pigments. Reactive and acid dyes which due to their high water solubility are the most difficult for removal represent respectively about 23 % and 18.6 % of the global market share (Zollinger, 2003). The literature survey shows a large spectra of well established conventional decolourization methods involving physicochemical, chemical and biological processes, as well as couple of new emerging techniques like sonochemical or advanced oxidation processes, but the fact is that there is no any single economically and technically viable method and usually two or three methods have to be combined in order to guarantee adequate level of colour removal (Hatton 1986; Kang 1997; Robinson 2001). Researches conducted on chemical coagulation present this method as one of the most practised processes and regardless of the generation of considerable amount of sludge, it is still used in developed and in developing countries. Because the mechanism of coagulation applied to decolorize waste water is still not clear, colour removal by coagulation is found in some cases very effective, in another cases however, has failed at all. In an attempt to approach this problem, a study towards
evaluation of surface charge density effects upon the predominant colour removal pattern during chemical coagulation was initiated, with an additional aim to investigate the dye floc features like size and shape as well.
2 MATERIALS AND METHODS 2.1 Dyes and coagulants
A commercially used textile disazo based dyes CI “Reactive Black 5” and “Acid Black 1” supplied by CIBA and Boruta-Color respectively were used in this study. Synthetic solutions simulating spent dye-bath effluent with concentration of 100 mg/L were prepared by dissolving a 100 mg of dye powder in 1.0 L of distilled water. Table 1 illustrates the main characteristics of the dyes, while Table 2 shows the characteristic of the primary cationic coagulants used in our study. They were used as stock solutions with concentration of 0.5 % active matter and were prepared daily as fresh batches.
Table 1. Main characteristics of dyes
Chemical index Chemical structure
Wavelength λmax ,(nm) Reactive Black 5 disazo 593
Table 2. Main characteristics of coagulants Ciba “ZETAG” Index Type Activity (%) 7101 Polyamine 50 7102 Polyamine 55 7103 Polyamine 55 7197 Polyamine 50 7125 Polydadmac 40 2.2 Coagulation Test
For each experimental trial, two parallel tests were always carried out. A 100 mL of the prepared dye solution was transferred inside a 250 mL beaker and placed on a jar-rig assembly consisting of 3-cm six-blade stirrer. Before agitation start, surface charge density of the pure dye solution was determined. Then, a pre-determined amount of coagulant was added and the sample was mixed rapidly by stirring at 200 rpm for two minutes and further at 25 rpm for five minutes. After stirring time elapsing, pH was recorded. Immediately after, 10ml of the sample was taken for surface charge density determination, the rest from the sample being utilized for colour removal estimation following filtration and centrifugation. Filtration under gravity was carried out using a Whatman “blue” and “yellow” stripe filters with pore openings below 2 µm and between 4-7 µm respectively. Centrifugation was performed at speed of 3000 rpm within 3 minute duration. After the solid/liquid separation stage has taken place, a required amount from the filtrate or the centrate was delivered for determination of residual colour concentration. The second sample, coagulated under the same conditions, was left for plain sedimentation for 2 hours, the colour removal degree being likewise determined based on supernatant analysis. 2.3 Surface Charge Density Determination
Surface charge density measurements were performed by means of a particle charge detector PCD-O3-pH from Mütek, Germany. The instrument consists of a cylindrical test cell with fitted displacement piston which moves back and forth at constant frequency, forcing a relative motion of liquid and particles, thus inducing development of streaming potential of either positive or negative sign. The cationic standard titrant was 0.001 normal polydiallyldymethylammonium chloride solution (Poly-Dadmac), while the anionic one was 0.001 normal sodium polyethylene sulphate solution (Na-PES). The exact amount of charge was estimated by titration of the sample with oppositely charged polyelectrolyte until neutralization of the streaming potential to zero value and was expressed as surface charge density as follows:
where:
V – volume of spent titrant until neutralization point [L],
c – normality of titrant - 0,001, W – mass of active substance [g] 2.4 Colour Removal Determination
Colour concentration was estimated by means of VIS spectral photometry (Spectrophotometer model Genesys 10, Thermo Spectronics) at the wavelength giving maximum absorbance. Colour removal degree was calculated based on the difference between colour concentration in the original dye-bath solution and the one after sludge/liquid separation.
2.5 Dye Flocs Characterization 2.5.1 Median diameter
Measurement of particle size distribution of the coagulated dye sludge was done by employing a CIS-100 GALAI system, which is a laser based particle counter and size analyzer, working on time-off-transition principle. The system is providing the number size distribution as a primary output, which is used further to yield volume size distribution. During measurement, the dye flocs were kept in motion inside the glass cuvette by means of magnetic stirrer rotating at slow speed without disturbing floc structures.
2.5.2 Fractal dimension
Flocs fractal dimension was estimated with a Malvern Mastersizer X laser scattering instrument, working in Low Angle Light Scattering (LALS) mode. The LALS technique as described by recent studies (Jung 1995; Bushel 2002) consists of recording raw light energy data after each measurement and plotting it versus scattering angle. The fractal dimension is taken as equal to the slope of the fitted to the linear section of the relationship trend line. In order to avoid flocs disruption during measurement, instead of using the normal sample cell, the dye sludge was transferred from the beaker to the measuring cell by means of a 150 ml syringe fitted with tubing. Considering the anticipated flocs size range, a 300 mm focal range was used.
2.5.3 Image analysis
Image analysis of aggregates in flocculated dye sludge was carried out by means of a Kappa CF 8/1 colour camera mounted on a Q600 HRSYS, Leica
[
eq g]
W c V
System. Small volume of sludge was transferred onto the observation glass by means of a wide mouth pipette and was subsequently diluted with distilled water. During all measurements, constant light level was maintained and for each captured image, between 50 and 100 objects was accounted by the system. The presented values are an average from ten independent measurements.
3 RESULTS AND DISCUSSION
3.1 Colour removal and surface charge density The results discussed further, relate only to the case when the coagulant 7101 was used. This is due to the fact that all the rest polyamine coagulants tested, have been found to behave in similar manner in terms of colour removal efficiency and trend in surface charge progression. Only in case of Acid Black 1 dye, when polydadmac coagulant 7125 was used, the mechanism of colour removal was different than charge neutralisation.
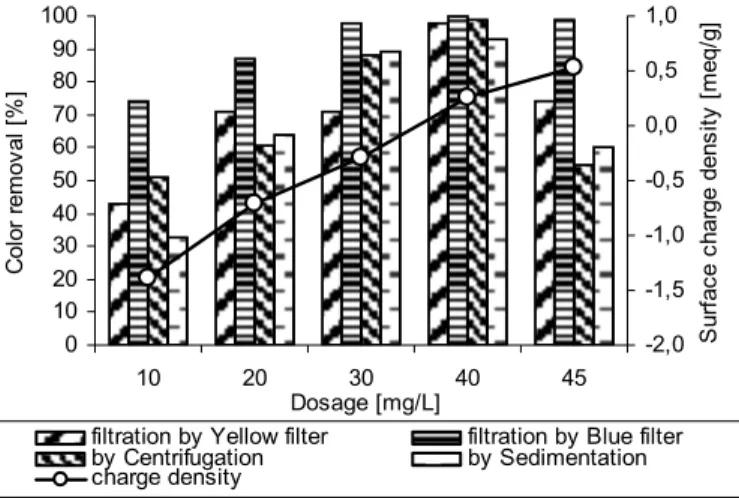
Figure 1 summarizes the effect of coagulant dose level on colour removal after filtration, sedimentation and centrifugation and surface charge density in case of RB5, while Figure 2 shows the same results in case of AB1 dye.
At Figures 1 and 2, one could notice a quite good correlation between surface charge density and colour removal. With coagulant dose increase, the negative surface charge density of coagulated dye sludge decreases and reaches a zero point around 50 mg/L in case of RB5 and 40 mg/L in case of AB1, where the best colour removal was achieved. The evident correlation between surface charge density and colour removal provides assumption that the adsorption of the positive coagulant species onto dye colloid surface is leading to their charge neutralization and their subsequent aggregation by electrostatic forces. 0 10 20 30 40 50 60 70 80 90 100 10 20 30 40 50 60 75 Dosage [mg/L] C olo r r emo va l [ % ] -2,0 -1,5 -1,0 -0,5 0,0 0,5 1,0 1,5 2,0 S ur fa ce c har ge dens ity [ m eq/ g]
filtration by Blue filter by Centrifugation by Sedimentation charge density
Figure 1. Relationship between surface charge density of sludge and colour removal at different coagulant dose levels; the case of RB5 dye
0 10 20 30 40 50 60 70 80 90 100 10 20 30 40 45 Dosage [mg/L] C olo r r emo va l [ % ] -2,0 -1,5 -1,0 -0,5 0,0 0,5 1,0 S urf ac e c har ge d ens ity [ m eq /g ]
filtration by Yellow filter filtration by Blue filter by Centrifugation by Sedimentation charge density
Figure 2. Relationship between surface charge density of sludge and colour removal at different coagulant dose levels; the case of AB1 dye
At the optimal dose level of 50 mg/L the colour removal by filtration, sedimentation and centrifugation has reached more than 95 % and at 40 mg/L – 93 % in case of RB5 and AB1 respectively. The further increase in coagulant dose up to 75 mg/L in case of RB5, above this optimal dose renders the surface charge density positive, what is manifested by colour removal decrease to 74 % by centrifugation and 70 % by sedimentation only. The same tendency was found out with AB1 dye, where increase of the dose even up to 45 mg/L, cause decrease in efficiency of colour removal by yellow filter (94 %), centrifugation (53 %) and sedimentation (60 %). Only filtration of the dye sludge by blue filter has secured continuous high colour removal even when the coagulant dose was increased further above the optimal dose level, which could be attributed to the quite small pore openings of the applied paper filter, being able to retain even the re-stabilized dye flocs.
3.2 Flocs characteristic
Table 3 summarizes some key data about floc characteristics and colour removal achieved by plain sedimentation at the different dose levels of coagulant in case of both dyes.
The perusal of these results indicates a correlation between floc characteristics and colour removal by sedimentation. Both floc size and fractal dimension increase with concomitant increase in amount of coagulant added. The largest floc size and the highest value of fractal dimension correspond to the best colour removal obtained. At lower dose levels of coagulant, the flocs exist as small primary aggregates, at the optimal dose level however they could be seen as larger flocs having a median size of around 209 µm and fractal dimension reaching 2.88 for RB5. In case of AB1, floc median was 209 µm and fractal diameter 2.86.
Table 3. Floc characteristics and colour removal by sedimentation
Dye Dosage of coagulant [mg/L] Removal by sedimentation [%] Median diameter [µm] Fractal dimension 10 14 133 2.41 20 62 148 2.60 30 71 179 2.75 40 84 205 2.88 50 96 209 2.88 60 84 198 2.85 RB5 75 70 188 2.42 10 33 155 2.33 20 63 155 2.72 30 87 178 2.82 40 93 194 2.86 AB1 45 60 180 2.71
The above observation suggests that the flocs produced at optimal coagulant dose are characterised by dense structure and improved settling behaviour. With further increase in coagulant dose levels, flocs median and fractal dimension decrease and the removal by sedimentation drops slightly as well. 3.3 Image analysis
The left hand side of Figures 3 and 4 below illustrates an image analysis view of a typical floc clusters coming from coagulation done at 20 mg/L ZETAG 7101 from both dyes. Worth to mention is the relatively large amount of fine primary particles. In contrast, when the coagulant was supplied at the optimal dose level of 50 mg/L and 40mg/L for RB5 and AB1 respectively, fairly compacted aggregate structures could be observed (right hand view). These characteristics are supporting to some extent the flocs settling behaviour discussed above.
Figure 3. Image analysis micrographs of dye aggregates of RB5 (coagulant at 20 mg/L – left and 50 mg/L – right).
Figure 4. Image analysis micrographs of dye aggregates of AB1 (coagulant at 20 mg/L – left and 40 mg/L – right).
4 CONCLUSIONS
The results of this study indicate that:
• Chemical coagulation of CI Reactive Black 5 and Acid Black 1 dye from synthetic dye effluents using a primary coagulants, takes place predominately under charge neutralization pattern. At the optimally established dose level of coagulant, an efficient destabilization of dye colloids occurs, leading to development of flocs with improved settling properties, which fact is further corroborated by their size and fractal dimension
• The approach for characterization of surface charge density of coagulated dye sludge and of the respective dye flocs in terms of size and shape could certainly be expanded to other coagulated sludges derived from textile dyes commonly met in effluents from dyeing mills
• Results obtained during investigation of the other reactive and acid dyes suggest in most cases very clear correlation like this observed in case of presented two dyes both in flocs characteristic and surface charge density studies
• Thus, the presented findings apart from having implication to the area of waste-water treatment could be likewise useful to issues relative to characterization of complex bodies possessing fractal character
5 REFERENCES
Bushel, G., Yan, D., Woodfield, D., Raper, J., Amal, R., On Techniques for the Measurement of the Mass Fractal Dimension of Aggregates, Adv. in Coll. & Interf. Sc., 95, 1-50 (2002)
Hatton, H., Simpson, A., Enhanced Colour Removal from Sewage Effluents using Chemically Flocculants. Env. Technol, Lett. 7, 413-424 (1986)
Jung, A., Amal, R., Raper, J., The Use of Small Angle Light Scattering to Study Structure of Flocs, Part. Part. Syst. Charact. 12, 274-278 (1995)
Kang, S., Chang, H., Coagulation of Textile Secondary Effluents with Fenton’s Reagent, Wat. Sci. Technol., 36, 215-222 (1997)
Robinson, T., Mcmullan, G., Marchant, R., Nigham, P., Remediation of Dyes in Textile Effluent: a Critical Review on Current Treatment Technologies with Proposed Alternatives, Biores. Technol. 77, 247-255 (2001)
Zollinger, H., Color Chemistry: Synthesis, Propertis, And Applications of Organic Dyes And Pigments, 2003, VHCA & WILEY – VCH, Switzerland