Cystatin C standardization decreases assay variation and improves
assessment of glomerular filtration rate
Natalie Ebert1, Pierre Delanaye2, Michael Shlipak3, Olga Jakob4, Peter Martus5, Jan Bartel6, Jens Gaedeke7,
Markus van der Giet8, Mirjam Schuchardt8, Etienne Cavalier9, and Elke Schaeffner1
1Charité University Medicine, Institute of Public Health, Berlin, Germany; 2Division of Nephrology; Centre
Hospitalier Universitaire du Sart-Tilman, Liège, Belgium; 3San Francisco VA Medical Center and University of
California, San Francisco, USA; institute of Biostatistics and Clinical Epidemiology, Charité, Berlin; Institute of Clinical Epidemiology and Medical Biostatistics, University Tubingen, Germany; 6Limbach Laboratory,
Heidelberg, Germany; 7Division of Nephrology, Charité University Medicine, Campus Mitte, Berlin; 8Division
of Nephrology, Charité University Medicine Campus Benjamin Franklin, Berlin; 9Department of Clinical
Chemistry, Centre Hospitalier Universitaire du Sart-Tilman, Liège, Belgium.
Abstract
Background: Cystatin C is increasingly used in glomerular filtration rate (GFR) estimation equations. The
dependence of cystatin C results upon the analytical method has been a major source of controversy.
Methods: Cystatin C was measured with non-standardized turbidimetric Roche Generation 1 and standardized
nephelometric Siemens assays in 3666 and additionally with standardized Roche Generation 2 and Siemens in 567 blood samples of the Berlin Initiative Study. Cystatin C-based GFR was assessed with CKD-EPIcys (Chronic Kidney Disease Epidemiology) and CAPA (Caucasian, Asian, Pediatric, Adult) equations and the impact of the assays on GFR estimation was determined. Equation performance compared to measured GFR was evaluated.
Results: Concordance of Roche Gen2 and Siemens was high with median difference of 0.003±0.13mg/L (limits
of agreement: -0.12 to 0.12) and Passing Bablok correlation was essentially perfect. Roche Gen1 assay showed worse concordance with Siemens: median difference was 0.08±0.13mg/L (limits of agreement: -0.18 to 0.34) and correlation was inferior. Mean difference (±SD) of estimated GFRCKD-EPIcys was 0±4mL/min/1.73m2 for
Gen2 and Siemens compared to -5±8 with Gen1. Performance of GFR estimating equations was not influenced by the choice of Siemens or Gen2 assays.
Conclusions: Standardization of Roche Gen2 assay improved accuracy of cystatin C measurement compared to
Siemens. It suggests only negligible method bias and results in equal performance of both assays when estimating GFR indicating that successful calibration has led to major progress in cystatin C analysis.
Highlights
• Cystatin C results of Siemens (PENIA) and Roche Gen2 (PETIA) assays are basically identical. • GFR equation performance is not influenced by the choice of these cystatin C assays.
• Successful assay calibration has led to major progress in cystatin C analysis.
Keywords: cystatin C, renal biomarkers, assay standardization, glomerular filtration rate
1. INTRODUCTION
Since its first description by Grubb and colleagues [1] the role of cystatin C (cysC) has gained importance for estimating GFR. Large cohort studies have demonstrated the added value of cysC-based or combined (including both cysC and creatinine) equations over solely creatinine-based GFR equations [2-4]. Compared to serum creatinine, the main advantages of cysC are its lower dependency on muscular mass as well as superior predictability of mortality and ESRD risk [5-7]. Additionally, it has been shown that including cysC into GFR equations has led to higher accuracy of GFR estimates compared to measured GFR [3;4;8]. As a consequence the "kidney disease improving global outcome" (KDIGO) guidelines recommend to confirm the diagnosis of chronic kidney disease (CKD) using a cysC-based GFR equation in patients with a creatinine-based GFR value between 45 and 59ml/min/1.73m2 In the context of estimating GFR, standardization of biomarker measurement
methods is of outstanding importance. Several authors have illustrated the negative impact of lack of standardized calibration for GFR estimation based on both creatinine and/or cysC [9-14]. As a consequence,
major improvements have been achieved in the creatinine standardization process. At present the majority of creatinine enzymatic assays are standardized to mass spectrometry and can be considered IDMS (isotope dilution mass spectrometry)-traceable [15]. To achieve the same level of standardization as for creatinine, an international standard and a reference method for accurate quantification of cysC in the standard material [16] are mandatory. An important step in the standardization of cysC assays was achieved in 2010 when the International Federation for Clinical Chemistry and Laboratory Medicine (IFCC) working group made the international certified reference material ERM-DA471/IFCC available to manufactures [17; 18]. Also, an ID/LSMS method has been recently published for cysC [16] which would allow the determination of the exact concentration of cysC in the content of the IFCC standard. However, in recent papers it has been shown that the use of such material has been inconsistent, leading to doubt about the accuracy of several cysC assays on the market: Grubb et al. have shown that the variability of different cysC assays could be reduced [19], but these optimistic results have not yet been confirmed by others [13; 19-22]. For example, Eckfeld et al. analyzed the results of cysC from 132 laboratories and showed large bias in cysC results concluding that manufacturers needed to improve their cysC measurement and calibration procedure [19;22]. The goal of the present study was to investigate analytical differences between the two commonly used cysC assays in Europe (nephelometry by Siemens, turbidimetry by Roche) and to study the impact of calibration on their inter-changeability. A second focus was to investigate the difference in estimated GFR of two commonly used cysC-based equations, the CKD-EPIcys (for "Chronic Kidney Disease epidemiology") [3] and CAPA (Caucasian, Asian, Pediatric, Adult) [19] with either assay. Finally, we compared the impact of those assays on the accuracy of cysC-based equations to estimate measured GFR using blood samples of the Berlin Initiative Study (BIS), a cohort investigating the epidemiology of CKD in older adults.
2. MATERIALS AND METHODS 2.1. Study participants and characteristics
Participants of the present study were part of the BIS, a cohort study that started in 2009. Details on inclusion and exclusion criteria as well as study design and goals can be found elsewhere [4]. 2069 participants were recruited for the baseline visit between January 2010 and June 2011 of which 1699 were followed longitudinally for two years follow up until 2013. Among the initial 2069 subjects, 2065 had dual cystatin C measurement (nephelometric Siemens and turbidimetric Roche analysis) at baseline and 1601 at the 2-year follow up, summing up to a total sample of 3666 subjects with two measurement points. Additionally, in a sub-study of 570 out of the 2069 baseline participants, we performed iohexol plasma clearance for exact measurement of the GFR. Out of these 570 subjects there were 567 with dual cystatin C measurement. The methodology used to measure GFR has been described elsewhere [4;23]. Briefly, iohexol solution 5 mL (Accupaque, GE Healthcare Buchler, Braunschweig, Germany), was administered intravenously. Blood samples were obtained from the contralateral arm at eight time points over the course of five hours after injection. High performance liquid chromatography (HPLC) on a Hitachi HPLC system with a Diode array detector (Hitachi, Mannheim, Germany] was used. GFR was calculated with the area under the receiver-operating characteristic curve of plasma concentration versus time. External quality control was provided by Equalis (Equalis AB, Uppsala, Sweden). Iohexol results were indexed for body surface area according to the DuBois and DuBois formula. All procedures involving participants and data were in accordance with the revised Helsinki Declaration of 2000, concerning ethical principles for medical research involving human subjects.
2.2. Cystatin C assays
All samples were frozen at -80 degrees Celsius, as cystatin C is known to be stable at this temperature [5]. In 2010, we used the non-calibrated particle-enhanced turbidimetric (PETIA) Roche Tina-quant® Generation 1
assay, on the Roche/Hitach Cobas S system (Integra 800) at Labor Synlab, Heidelberg. In the following text we will refer to this assay as "Gen1". The interassay coefficients of variation for the Ger assay were 5.57% and 4.51 % at mean concentrations of 1.04 mg/L and 4.48 mg/L, respectively. In 2013, cysC was measured at Labor Limbach Heidelberg using the particle enhanced nephelometric (PENIA) N Latex® assay on the BN™ II System
(Siemens Health Care Diagnostics, ex-Dade-Behring, Marburg, Germany). The interassay coefficients of variation for serum cysC were 3.4% and 4.6% at concentrations of 1.13 and 2.29 mg/L, respectively. The manufacturer's reference interval for healthy subjects is 0.59 - 1.05 mg/L, after standardization of cysC according to ERM - DA 471/IFCC for BN Systems. All reagents and control materia were provided by Siemens Health Care Diagnostics.
Additionally, cysC was measured in 2014 at Labor Limbach, Heidelberg using the newly developed and calibrated Tina-quant® Generation 2 assay on the Roche/Hitachi Cobas S system (Cobas c 501). This assay will
be referred to as "Gen2". The interassay coefficients of variation were 2.3%, 3.2% and 1.3% at mean concentrations of 1.0 mg/L, 1.7 mg/L and 4.1 mg/L, respectively. All reagents and control material was provided by Roche Diagnostics.
The Gen1 assay was not standardized to ERM - DA 471/IFCC, in contrast to the more recent Gen2 assay, which has been available for commercial clinical use since 2014.
2.3. Comparison of assays
Roche Gen1 and Siemens were compared in the total BIS cohort (n=3666). Roche Gen2 and Siemens were compared in the sub-population with iohexol measurements (n=567).
2.4. Comparison of estimated GFR with different assays
In both study groups, the BIS population (n=3666) and the iohexol-subpopulation (n=567), we compared GFR results estimated by the CKD-EPIcys and CAPA equations, as both have been developed with ERM-DA471/IFCC-standardized cysC values and included individuals above the age of 70 in their equation development samples.
CKD-EPIcys [3]:
Cystatin C ≤0.8: 133*(CysC/0.8)-0.499*0.996Age(*0.932 if female)
Cystatin C >0.8: 133*(CysC/0.8)-1.328*0.996Age(*0.932 if female)
CAPA [19]:
130*CysC-1.069*Age-0.117-7.
Finally the performances of these equations with Siemens and Gen2 assays were compared to the reference method, i.e. GFR measured with iohexol.
2.5. Statistical Analysis
Descriptive analyses included means, standard deviations (SD), medians and quartiles for continuous variables as well as absolute frequencies and percentages for categorical variables.
For assay comparisons, we performed the Passing Bablok method [24], a linear regression procedure that does not include specific assumptions regarding the distribution of the samples or measurement errors. The advantage of the non-parametric Passing Bablok procedure for comparing two analytical methods is that it is much less influenced by outliers. We used Bland-Altman plots for method comparison including limits of agreement taking into account random measurement errors when performing assay comparison [25]. Bias between assays was assed as the mean difference between PETIA Roche and PENIA Siemens (PETIA Roche -PENIA Siemens), with positive values indicating an overestimation with the PETIA Roche assay.
For comparison between estimations and comparison of estimated GFR versus measured GFR, we focused on Bland and Altman analysis. Bias was assessed as the mean difference between eGFR and mGFR. Precision was assessed as the SD of the bias, and accuracy as the percentage of estimates within 10% and 30% of the mGFR (P10 and P30). Testing for significant difference of equation performance was done with the McNemar Test.
3. RESULTS
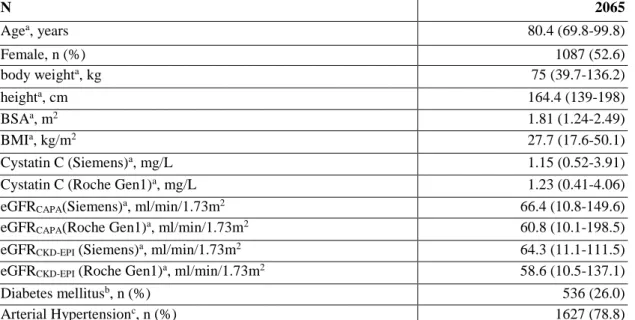
Main characteristics of the BIS population at baseline (n=2065 out of which n=1601 had a second cysC measurement within two years, totaling n=3666 cysC blood samples) and the iohexol subpopulation (n=567) are displayed in Table 1a and 1b, respectively. Mean age was slightly higher in the BIS population at baseline with 80.4 versus 78.5 years in the iohexol population. There were 53% females, 79% on antihypertensive medication, 26% were diabetics, and the mean BSA was 1.81 m2 in the total BIS population; characteristics of the iohexol
population were 43% females, 77% individuals with hypertension, 24% diabetics, and a mean BSA of 1.85 m2 In Table 2 an overview of the three cysC assays and the two BIS study populations is displayed.
Figure 1A: Passing Bablok correlation with details on slope, intercept, random difference and linear validity for
comparison of Roche Gen1 (PETIA) and Siemens (PENIA) cystatin C (mg/L) assays (n=3666).
Correlation equation: y (Siemens) = -0.0689101 + 0.998336 x (Gen1); details: intercept A= -0.068919 (95% Cl: -0.08107 to -0.05574); slope B= 0.9983 (95% Cl: 0.9872 to 1.0088); residual standard deviation (RSD)= 0.09301 ±0.1823, no significant deviation from linearity (p=0.08).
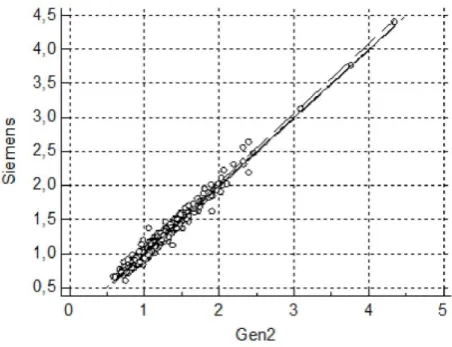
Figure 1B: Passing Bablok correlation with details on slope, intercept, random difference and linear validity for
comparison of Roche Gen2 (PETIA) and Siemens (PENIA) cystatin C (mg/L) assays (n=567).
Correlation equation: y (Siemens) = 0.00 +1.00x (Gen2): intercept A= 0.00 (95% Cl: -0.01837 to 0.00); slope B=1.00 (95% Cl of 1.00 to 1.0204); residual standard deviation (RSD)=0.04272 ±0.08373; no significant deviation from linearity (p=1.00).
3.1. Comparison of assays
PETIA Roche Gen1 versus PENIA Siemens
Mean (±SD) cysC concentrations (n=3666) were 1.18±0.41 and 1.26±0.42 mg/L for the Siemens and Gen1, respectively. The Passing Bablok regression shows the following equation: y(Siemens) = -0.0689101 + 0.998336 x (Gen1) (Figure 1A). Bland Altman (Figure 2A) analysis of both cysC assays revealed a mean difference (±SD) between Gen1 and Siemens of 0.08±0.13mg/L and limits of agreement were -0.18 and 0.34 mg/L. Relative difference between the Gen1 and Siemens assay was 7% (± 10). Agreement of Roche Gen1 compared to Siemens assay was acceptable and P10, P20, and P30 were 62%, 90%, and 98%, respectively.
PETIA Roche Gen2 versus PENIA Siemens
Mean (±SD) cysC concentrations (n=567) were 1.14±0.38 and 1.14±0.37 mg/L for the Siemens and Gen2, respectively. The Passing Bablok regression showed an essentially perfect equation up to (blank) decimal places: y(Siemens) = 0,00 + 1,00 x (Gen2) (Figure 1B). Bland Altman (Figure 2B) analysis of both cysC assays revealed a mean difference (±SD) between Gen2 and Siemens of 0.003±0.06 mg/L and limits of agreement were -0.12 and 0.12 mg/L. Relative difference between the Siemens and Gen2 assay was -0.06% (± 5). Agreement of Gen2 compared with Siemens assay was substantially improved: P10, P20, and P30 were 95%, 100%, and 100%, respectively.
Figure 2A: Bland and Altman of PETIA Roche Gen1 versus PENIA Siemens cystatin C (mg/L) assay (n=3666).
The bias is represented by the solid middle line (0.08 mg/L). The upper (0.38 mg/L) and lower limits (-0.18 mg/L) of the interval of agreement are represented by the dashed lines.
Figure 2B: Bland and Altman of PETIA Roche Gen2 versus PENIA Siemens cystatin C (mg/L) assay (n=567).
The bias is represented by the solid middle line (0.003 mg/L). The upper (0.12 mg/L) and lower limits (-0.12 mg/L) of the interval of agreement are represented by the dashed lines.
3.2. Comparison of CKD-EPIcys and CAPA estimates of GFR using each cystatinC assay
PETIA Roche Gen1 versus PENIA Siemens:
Mean estimated GFRs based on CKD-EPIcys equation (n=3666) were 63±21 and 57±19 mL/min/1.73 m2, for
the Siemens and Roche Gen1, respectively. Bland Altman analysis revealed a mean difference (±SD) between Gen1 and Siemens of -5±8 mL/min/1.73 m2 (Figure 3A). Agreement for eGFR
CKD-EPI with Gen1 as compared to
Siemens was acceptable and P10, P20, and P30 were 54%, 88%, and 98%, respectively.
PETIA Roche Gen2 versus PENIA Siemens:
Mean estimated GFRs based on CKD-EPIcys equation (n=567) were 65±20 and 65±20 mL/min/1.73 m2, for the
Siemens and Roche Gen2, respectively. Bland Altman analysis revealed a mean difference (±SD) between Gen2 and Siemens of 0±4 mL/min/1.73 m2 (Figure 3B). Agreement for eGFR
CKD-EPI between Gen2 and Siemens was
substantially improved: P10, P20, and P30 were to 89%, 99%, and 100%, respectively.
3.3. Performance of estimated GFR versus measured GFR (n=567)
The mean measured GFR was 60±16 mL/min/1.73m2. Mean difference of eGFR
CKD-EPI compared to mGFR was
5±10 mL/min/1.73m2 for Roche Gen2 and 5±11 mL/min/1.73m2 for Siemens. There was no significant
difference in bias, precision or accuracy between Siemens and Gen 2 for eGFRCKD-EPI as compared to mGFR (Table 3)
For the CAPA equation, mean eGFR values were 67±19 mL/min/1.73m2 with Roche Gen2 and 66±19
mL/min/1.73m2 with Siemens. Mean difference of eGFR
CAPA compared to mGFR was 6±10 mL/min/1.73m2 for
difference in bias, precision and accuracy between Siemens and Gen2 for eGFRCAPA as compared to mGFR (Table 3).
Comparing the performance of both GFR equations with mGFR, CKD-EPI showed a significantly better P30 (89%) value with Roche Gen 2 as compared to CAPA (86%) (p-value of 0.02). Otherwise no significant differences in equation performance were found between both equations.
Table 1a: Main Characteristics of BIS participants at Baseline
N 2065 Agea, years 80.4 (69.8-99.8) Female, n (%) 1087 (52.6) body weighta, kg 75 (39.7-136.2) heighta, cm 164.4 (139-198) BSAa, m2 1.81 (1.24-2.49) BMIa, kg/m2 27.7 (17.6-50.1) Cystatin C (Siemens)a, mg/L 1.15 (0.52-3.91)
Cystatin C (Roche Gen1)a, mg/L 1.23 (0.41-4.06)
eGFRCAPA(Siemens)a, ml/min/1.73m2 66.4 (10.8-149.6)
eGFRCAPA(Roche Gen1)a, ml/min/1.73m2 60.8 (10.1-198.5)
eGFRCKD-EPI (Siemens)a, ml/min/1.73m2 64.3 (11.1-111.5)
eGFRCKD-EPI (Roche Gen1)a, ml/min/1.73m2 58.6 (10.5-137.1)
Diabetes mellitusb, n (%) 536 (26.0)
Arterial Hypertensionc, n (%) 1627 (78.8)
BSA= body surface area, BMI = body mass index, eGFR = estimated GFR, Gen1 = Generation 1 assay from Roche
amean, (range)
bDiabetes was defined as either hemoglobin A1c>6.5% or prescription of antidiabetic medication cHypertension was defined as prescription of antihypertensive medication
Table 1b: Main characteristics of the iohexol cohort participants
N 567 Agea, years 78.5 Female, n (%) 242 (42.7) body weighta, kg 77.4 (47.0-136.2) heighta, m 166.3 (143.0-192.0) BSAa, m2 1.85 (1.35-2.40) BMIa, kg/m2 27.9 (19.0-47.1) Cystatin C (Siemens)a 1.14 (0.61-4.40)
Cystatin C (Roche Gen2)a 1.14 (0.59-4.35)
mGFRa, ml/min/1.73m2 60.3 (15.5-116.7)
eGFRCAPA(Siemens)a, ml/min/1.73m2 66.4 (9.0-127)
eGFRCAPA(Roche Gen2)a, ml/min/1.73m2 66.5 (9.2-131)
eGFRCKD-EPI (Siemens)a, ml/min/1.73m2 65.1 (9.4-114)
eGFRCKD-EPI (Roche Gen2)a, ml/min/1.73m2 65.2 (9.5-107)
Diabetes mellitusb, n (%) 136 (24.0)
Arterial Hypertensionc, n (%) 436 (76.9)
BSA= body surface area, BMI = body mass index, mGFR = measured GFR, eGFR = estimated GFR, Gen2= Generation 2 assay from Roche
amean, (range)
bDiabetes was defined as either hemoglobin A1c>6.5% or prescription of antidiabetic medication cHypertension was defined as prescription of antihypertensive medication
GFR estimating equations:
CKD-EPIcys [3]: Cystatin C ≤ 0.8: 133*(CysC/0.8)-0.499*0.996Age(*0.932 if female)
Cystatin C >0.8: 133*(CysC/0.8)-1.328*0.996Age(*0.932 if female)
CAPA [19]: 130*CysC-1.069*Age-0.117-7.
Table 2: Overview of study samples, number of blood samples and type of cystatin C assay
Sample non-standardized PETIA Roche Gen 1 assaya standardized PENIA Siemens assayb standardized PETIA Roche Gen 2 assayc BIS cohort (n=3666): 2065 baseline and 1601 follow up cystatin C samples X X BIS lohexol subpopulation (n=567) X X
anon-standardized turbidimetric Tina quant® Genereation 1 assay from Roche bstandardized nephelometric N-Latex® assay from Siemens
cnon-standardized turbidimetric Tina quant® Generation 2 assay from Roche (on the market since 2014)
Figure 3A: Bland and Altman of GFR (ml/min/1.73m2) estimated by CKD-EPI
CYS with PETIA Roche Gen1
versus PENIA Siemens (n=3666). The bias is represented by the solid middle line (-5 mL/min/1.73 m2). The upper (10 mL/min/1.73 m2) and lower limits (-20 mL/min/1.73 m2) of the interval of agreement are represented
Figure 3B: Bland and Altman of GFR (ml/min/1.73m2) estimated by CKD-EPIcys with PETIA Roche Gen2
versus PENIA Siemens (n=567). The bias is represented by the solid middle line (0 mL/min/1.73 m2). The upper
(9 mL/min/1.73 m2) and lower limits (-9 mL/min/1.73 m2) of the interval of agreement are represented by the
dashed lines.
Table 3: Bias, precision and accuracy for eGFRCAPA and eGFRCKD-EPI as compared to measured GFR with cysC
Siemens and Roche Gen2.
Mean Bias (ml/min/1.73 m2) SD of Differences (ml/min/1.73 m2) Mean relative Bias (%) SD of relative Bias (%) P10 (%) P30 (%) eGFRCAPA Siemens 6 10 11 18 41 86 Roche Gen2 6 10 11 18 41 86a eGFRCKD-EPI Siemens 5 11 8 18 41 88 Roche Gen2 5 10 8 18 42 89a
aComparing the performance of both GFR equations with mGFR, CKD-EPI showed a significantly better P30
value with Roche Gen 2 as compared to CAPA (p-value of 0.02). Otherwise no significant differences in equation performance were found between both equations.
eGFR: estimated GFR, mGFR: measured GFR, SD: Standard deviation, Bias was assessed as mean difference between eGFR and mGFR, P10 and P30 were calculated as the percentage of estimates within 10 and 30% of mGFR. GFR estimating equations:
Cystatin C ≤ 0.8: 133*(CysC/0.8)-0.499*0.996Age(*0.932 if female)
Cystatin C >0.8: 133*(CysC/0.8)-1.328*0.996Age(*0.932 if female)
CAPA [19]:
130*CysC-1.069*Age-0.117-7.
4. DISCUSSION
In this study, we were able to demonstrate that the current calibrated cystatin C (cysC) assays provided by Siemens (PENIA) and Roche (PETIA) give very comparable results. The bias between Roche and Siemens cysC assays was reduced from 7% with the Gen1 down to 0% with the Gen2 assay demonstrating that actually Gen2 and Siemens can be used inter-changeably. Consequently the bias between assays when calculating eGFR has also been reduced from -5 down to 0 ml/min/1.73m2 Additionally we could show that eGFR assessed with either
Siemens or Gen2 from Roche achieve the same accuracy when compared to mGFR. Estimating GFR with equations based on biomarkers requires that the measurement of such biomarkers be accurate and standardized to minimize method-specific bias. Indeed, most equations have been developed from regression models in which biomarkers, creatinine or cysC, had predominant mathematical weight [26]. Moreover, the relationships between GFR and creatinine or cysC are exponential, so small variations in biomarker concentration, such as those observed with the non-standardized Gen1 assay, could be sufficient to induce important differences in GFR estimates [9-14;26;27]. This point is particularly relevant at normal creatinine or cysC levels and is easily explained by the exponential relationship between renal biomarkers and GFR [26]. Therefore, standardization of both serum creatinine and cysC measurement is very important in the general population and in particular in epidemiological studies examining the association of kidney function with morbidity and mortality. Several studies have illustrated large differences in CKD prevalence after the creatinine assay was standardized [12;27]. Today, the most popular creatinine-based equations have been developed with a calibrated, standardized and traceable creatinine assay [2;4;28;29]. Manufacturers have successfully implemented standardization by calibrating their assays against a reference method, i.e. mass spectrometry (the so-called IDMS-traceable assays). Independent studies have shown that most enzymatic assays are effectively IDMS-traceable [15;30]. The situation is less evident for Jaffe assays, even when manufacturers claim that traceability has been obtained [30;31]. Due to its molecular structure, the measurement of cysC by mass spectrometry is much more complex even if such a method has been recently made available [16]. However, to the best of our knowledge, this method has not yet been used to determine the "true value" of the cysC content of the reference material ERM-DA471/IFCC proposed by the IFFC working group that manufacturers should use to calibrate their assays [17; 18]. CysC standardization is required to improve large discrepancies between the nephelometric and turbidimetric methods, but also differences observed between different assays using the same turbidimetric methods [9;11;13;14;20-22;32]. This will also prevent that, within a single method, calibrations change over time, as it has been described with the PENIA method from Siemens [33]. Just as for creatinine, the standardization of cysC measurement was a prerequisite before proposing cysC-based equations to estimate GFR in clinical practice [3; 19]. Calibration is possible today but it remains to be proven whether manufacturers actually use calibration procedures. Some authors have recently reported significant and relevant cysC discrepancies, which warrants doubt about the manufacturer's commitment to use calibration effectively [13;20-22]. Our results should be reassuring, as two of the most commonly used cysC assays, Roche (PETIA) and Siemens (PENIA), give concordant results in terms of cysC concentrations and estimated GFR. Sensu stricto, we are not able to prove that these assays are calibrated to the reference material. However, the fact that the new assay proposed by Roche (Gen2) demonstrates more consistent results with the Siemens assay than the prior one (Gen1) is an indirect but important indication for calibration. Another indirect argument is the excellent agreement of estimated GFR results observed in two equations, which were specifically developed with calibrated cysC methods. These two cysC-based equations, i.e. the CKD-EPIcys and the CAPA equations, show an acceptable performance with both assays to estimate GFR, with an accuracy within 30% of around 85-90% in our general population of elderly subjects. There are two limitations to our study. First, our conclusions are only applicable to the three specific assays studied here and additional comparisons between multiple assays available on the market may be required to support their use. Second, our conclusion is applicable for these assays provided in Europe. Based on the current literature, it is possible that calibration could be applied differently in the US, as it has been speculated for the Siemens assay [13;20-22]. Globally, the studies about cysC calibration show better concordance in European studies, including ours, [10;19;34;35] than in American ones [20-22]. However, this hypothesis should be addressed in future studies.
In summary, in our large cohort of older individuals, we show that both the Siemens (PENIA) and the newly developed Roche Gen2 (PETIA) assay give basically identical results of cysC. Equation performance is not influenced by the choice of either of these cysC assays and likewise CKD-EPIcys and CAPA can be used to
estimate GFR with cysC in older adults. This work indicates that successful calibration has led to major progress in cystatin C analysis.
Acknowledgements
We thank Jaqueline Herrmann for her excellent work with biobank samples and are grateful for the contribution of Ingrid Zahn at Labor Limbach. This work has been submitted as an abstract (# 16-A-1086-ERA-EDTA) for the ERA-EDTA meeting 2016
Statement of Competing Financial Interests: All authors declared no competing interests. Grant Support
By the Kuratorium für Dialyse und Nierentransplantation (KfH) Foundation of Preventive Medicine and the Stiftung für Pathobiochemie und Molekulare Diagnostik.
Reference List
1. Grubb A, Simonsen O, Sturfelt G, Truedsson L, Thysell H. Serum concentration of cystatin C, factor D and beta 2-microglobulin as a measure of glomerular filtration rate. Acta Med Scand 1985; 218:499-503.
2. Bjork J, Grubb A, Larsson A et al. Accuracy of GFR estimating equations combining standardized cystatin C and creatinine assays: a cross-sectional study in Sweden. Clin Chem Lab Med 2015; 53:403-14.
3. Inker LA, Schmid CH, Tighiouart H et al. Estimating glomerular filtration rate from serum creatinine and cystatin C. N Engl J Med 2012; 367:20-9.
4. Schaeffner ES, Ebert N, Delanaye P et al. Two novel equations to estimate kidney function in persons aged 70 years or older. Ann Intern Med 2012; 157:471-81.
5. Séronie-Vivien S, Delanaye P, Pieroni L, Mariat C, Froissart M, Cristol JP. Cystatin C: current position and future prospects. Clin Chem Lab Med 2008; 46:1664-86.
6. Shlipak MG, Matsushita K, Arnlov J et al. Cystatin C versus creatinine in determining risk based on kidney function. N Engl J Med 2013; 369:932-43.
7. Peralta CA, Shlipak MG, Judd S et al. Detection of chronic kidney disease with creatinine, cystatin C, and urine albumin-to-creatinine ratio and association with progression to end-stage renal disease and mortality. JAMA 2011; 305:1545-52.
8. Shlipak MG, Mattes MD, Peralta CA. Update on cystatin C: incorporation into clinical practice. Am J Kidney Dis 2013; 62:595-603.
9. Delanaye P, Pieroni L, Abshoff C et al. Analytical study of three cystatin C assays and their impact on cystatin C-based GFR-prediction equations. Clin Chim Acta 2008; 398:118-24.
10. Donadio C, Kanaki A, Caprio F, Donadio E, Tognotti D, Olivieri L. Prediction of glomerular filtration rate from serum concentration of cystatin C: comparison of two analytical methods. Nephrol Dial Transplant 2012; 27:2826-38.
11. Shlipak MG, Weekley CC, Li Y, Hansson LO, Larsson A, Whooley M. Comparison of cardiovascular prognosis by 3 serum cystatin C methods in the Heart and Soul Study. Clin Chem 2011; 57:737-45. 12. Van Biesen W, Vanholder R, Veys N et al. The importance of standardization of creatinine in the
implementation of guidelines and recommendations for CKD: implications for CKD management programmes. Nephrol Dial Transplant 2005; 21:77-83.
13. Voskoboev NV, Larson TS, Rule AD, Lieske JC. Importance of cystatin C assay standardization. Clin Chem 2011; 57:1209-11.
14. White CA, Rule AD, Collier CP et al. The impact of interlaboratory differences in cystatin C assay measurement on glomerular filtration rate estimation. Clin J Am Soc Nephrol 2011; 6:2150-6.
15. Pieroni L, Delanaye P, Boutten A et al. A multicentric evaluation of IDMS-traceable creatinine enzymatic assays. Clin Chim Acta 2011; 412:2070-5.
16. Gonzalez-Antuna A, Rodriguez-Gonzalez P, Ohlendorf R, Henrion A, Delatour V, Garcia Alonso Jl. Determination of Cystatin C in human serum by isotope dilution mass spectrometry using mass overlapping
peptides. J Proteomics 2015; 112:141-55.
17. Blirup-Jensen S, Grubb A, Lindstrom V, Schmidt C, Althaus H. Standardization of Cystatin C:
development of primary and secondary reference preparations. Scand J Clin Lab Invest Suppl 2008; 241:67-70. 18. Grubb A, Blirup-Jensen S, Lindstrom V, Schmidt C, Althaus H, Zegers I. First certified reference material for cystatin C in human serum ERM-DA471/IFCC. Clin Chem Lab Med 2010; 48:1619-21.
19. Grubb A, Horio M, Hansson LO et al. Generation of a New Cystatin C-Based Estimating Equation for Glomerular Filtration Rate by Use of 7 Assays Standardized to the International Calibrator. Clin Chem 2014;53:403-14.
20. Voskoboev NV, Larson TS, Rule AD, Lieske JC. Analytic and clinical validation of a standardized cystatin C particle enhanced turbidimetric assay (PETIA) to estimate glomerular filtration rate. Clin Chem Lab Med 2012; 50:1591-6.
21. Zhao Z, Sacks DB. Detrimental Effects of not Using International Reference Materials to Calibrate Cystatin C Assays. Clin Chem 2015. In Press.
22. Eckfeldt JH, Karger AB, Miller WG, Rynders GP, Inker LA. Performance in Measurement of Serum Cystatin C by Laboratories Participating in the College of American Pathologists 2014 CYS Survey. Arch Pathol Lab Med 2015; 139:888-93.
23. Ebert N, Loesment A, Martus P et al. lohexol plasma clearance measurement in older adults with chronic kidney disease-sampling time matters. Nephrol Dial Transplant 2015; 30:1307-14.
24. Passing H, Bablok. A new biometrical procedure for testing the equality of measurements from two different analytical methods. Application of linear regression procedures for method comparison studies in clinical chemistry, Part I. J Clin Chem Clin Biochem 1983; 21:709-20.
25. Bland JM, Altman DG. Statistical methods for assessing agreement between two methods of clinical measurement. Lancet 1986; 1:307-10.
26. Delanaye P, Cavalier E, Cristol JP, Delanghe JR. Calibration and precision of serum creatinine and plasma cystatin C measurement: impact on the estimation of glomerular filtration rate. J Nephrol 2014; 27:467-75. 27. Coresh J, Astor BC, McQuillan G et al. Calibration and random variation of the serum creatinine assay as critical elements of using equations to estimate glomerular filtration rate. Am J Kidney Dis 2002; 39:920-9. 28. Levey AS, Coresh J, Greene T et al. Using standardized serum creatinine values in the modification of diet in renal disease study equation for estimating glomerular filtration rate. Ann Intern Med 2006; 145:247-54. 29. Levey AS, Stevens LA, Schmid CH et al. A new equation to estimate glomerular filtration rate. Ann Intern Med 2009; 150:604-12.
30. Hoste L, Deiteren K, Pottel H, Callewaert N, Martens F. Routine serum creatinine measurements: how well do we perform? BMC Nephrol 2015; 16:21.
31. Boutten A, Bargnoux AS, Carlier MC et al. Enzymatic but not compensated Jaffe methods realh the desirable specifications of NKDEP at normal levels of creatinine. Results of the French multicentric evaluation. Clin Chim Acta 2013; 419:132-5.
32. Larsson A, Malm J, Grubb A, Hansson LO. Calculation of glomerular filtration rate expressed in mL/min from plasma cystatin C values in mg/L. Scand J Clin Lab Invest 2004; 64:25-30.
33. Larsson A, Hansson LO, Flodin M, Katz R, Shlipak MG. Calibration of the Siemens cystatin C immunoassay has changed over time. Clin Chem 2011 ; 57:777-8.
34. Obiols J, Bargnoux AS, Kuster N et al. Validation of a new standardized cystatin C turbidimetric assay: evaluation of the three novel CKD-EPI equations in hypertensive patients. Clin Biochem 2013; 46:1542-7. 35. Ristiniemi N, Savage C, Bruun L, Pettersson K, Lilja H, Christensson A. Evaluation of a new immunoassay for cystatin C, based on a double monoclonal principle, in men with normal and impaired renal function. Nephrol Dial Transplant 2012; 27:682-7.