Pagès et al. BMC Evolutionary Biology 2010, 10:184 http://www.biomedcentral.com/1471-2148/10/184
Open Access
RESEARCH ARTICLE
© 2010 Pagès et al; licensee BioMed Central Ltd. This is an Open Access article distributed under the terms of the Creative Commons Attribution License (http://creativecommons.org/licenses/by/2.0), which permits unrestricted use, distribution, and reproduction in any medium, provided the original work is properly cited.
Research article
Revisiting the taxonomy of the Rattini tribe: a
phylogeny-based delimitation of species
boundaries
Marie Pagès*
1, Yannick Chaval
1, Vincent Herbreteau
2,3, Surachit Waengsothorn
4, Jean-François Cosson
1,
Jean-Pierre Hugot
5, Serge Morand
6,7and Johan Michaux
1,8Abstract
Background: Rodents are recognized as hosts for at least 60 zoonotic diseases and may represent a serious threat for
human health. In the context of global environmental changes and increasing mobility of humans and animals, contacts between pathogens and potential animal hosts and vectors are modified, amplifying the risk of disease emergence. An accurate identification of each rodent at a specific level is needed in order to understand their implications in the transmission of diseases. Among the Muridae, the Rattini tribe encompasses 167 species inhabiting South East Asia, a hotspot of both biodiversity and emerging and re-emerging diseases. The region faces growing economical development that affects habitats, biodiversity and health. Rat species have been demonstrated as significant hosts of pathogens but are still difficult to recognize at a specific level using morphological criteria. DNA-barcoding methods appear as accurate tools for rat species identification but their use is hampered by the need of reliable identification of reference specimens. In this study, we explore and highlight the limits of the current taxonomy of the Rattini tribe.
Results: We used the DNA sequence information itself as the primary information source to establish group
membership and estimate putative species boundaries. We sequenced two mitochondrial and one nuclear genes from 122 rat samples to perform phylogenetic reconstructions. The method of Pons and colleagues (2006) that determines, with no prior expectations, the locations of ancestral nodes defining putative species was then applied to our dataset. To give an appropriate name to each cluster recognized as a putative species, we reviewed information from the literature and obtained sequences from a museum holotype specimen following the ancient DNA criteria.
Conclusions: Using a recently developed methodology, this study succeeds in refining the taxonomy of one of the
most difficult groups of mammals. Most of the species expected within the area were retrieved but new putative species limits were also indicated, in particular within Berylmys and Rattus genera, where future taxonomic studies should be directed. Our study lays the foundations to better investigate rodent-born diseases in South East Asia and illustrates the relevance of evolutionary studies for health and medical sciences.
Background
Among mammals, rodents are recognized as major hosts and vectors of parasites and pathogens, some of them causing important zoonoses and representing a serious threat for human health [1-5]. Most epidemiological studies have focused on the most common rodents with emphasis on commensal species such as the laboratory
rat, Rattus norvegicus. A common assumption is that the rodent species responsible for disease transmission are those living close to humans, but since wild species dis-tant from human settlements have been proven to play a key role in maintaining, spreading and transmitting pathogens and parasites (e.g. [4]), this point of view is being questionned. Specific diversity within the host community has also been shown to play an important function in the maintenance of a disease and in the prob-ability of its transmission to humans [6,7]. Consequently,
* Correspondence: marie.pages@supagro.inra.fr
1 INRA, UMR CBGP (INRA/IRD/Cirad/Montpellier SupAgro), Campus
International de Baillarguet, CS 30016, 34988 Montferrier-sur-Lez cedex, France
Pagès et al. BMC Evolutionary Biology 2010, 10:184
http://www.biomedcentral.com/1471-2148/10/184 Page 2 of 27
researchers are now focusing not on a single particular host species but on the whole host community and are endeavouring to understand the role of each rodent spe-cies in the context of the entire host-pathogen commu-nity.
Today this knowledge is more urgent than ever since biodiversity in many areas is being altered rapidly by the ongoing global change. Because of anthropogenic distur-bances, the host-pathogen interactions are being dramat-ically modified leading to new and unexpected disease risks and the emergence and/or re-emergence of infec-tious diseases [6-10]. To be able to predict and to antici-pate some of these risks, one should be able in the case of rodent host communities, to identify first and foremost each rodent at a specific level, a real challenge when con-sidering that rodents represent 40% of mammalian spe-cies [11] including many cryptic spespe-cies, and that new genera and species are yearly described (e.g. Laonastes aenigmamus, [12]; Saxatilomys paulinae, [13]; Mayermys germani, [14]; Tonkinomys daovantieni, [15]).
Among Muridae rodents, the Rattini tribe encompasses 35 genera corresponding to 167 rat species [16] following the tribal arrangement of the Murinae proposed by Lecompte et al. [17]. Nearly all representatives of this tribe inhabit South East Asia, a major hotspot of biodi-versity [18] faced with a runaway economic growth dam-aging habitats, biodiversity and health but also a hotspot of emerging and re-emerging diseases [19,20]. If the par-tition of the tribe among five divisions (i.e. Crunomys, Dacnomys, Maxomys, Micromys and Rattus divisions) [16,17] is widely accepted, its taxonomy remains however largely untested phylogenetically and its delimitations are not yet secured. Chiropodomys, Vandeleuria, Hapalomys, Haeromys and Vernaya genera were included in the Micromys division by Musser and Carleton [16]. As the Eurasian harvest mouse, Micromys was proven to belong to the Rattini tribe ([17,21]), the whole Micromys division should belong to the Rattini tribe if Musser and Carle-ton's assumption is right. However, some of these genera (i.e. Chiropodomys and Vandeleuria) were recently shown to be unaffiliated to Micromys according to molecular evidences [21], while putative representatives of the Rat-tini tribe (i.e. Tonkinomys daovantieni, Saxatilomys pau-linae, Srilankamys sp., Hapalomys sp., Haeromys sp., Vernaya sp.) have not been investigated using molecular data and are currently considered as Murinae incertae sedis [17]. Numerous rat species have been demonstrated or postulated as major hosts of pathogens (e.g. Hantavi-ruses described from bandicoot rat, Bandicota indica in Thailand, [22,23]; Bandicota indica, B. savilei, Berylmys berdmorei, Niviventer sp., and Rattus sp. serologically tested positive for Rickettsia tsutsugamushi, the agent responsible for scrub typhus [24]; etc.). Although easily identified at a generic level by an expert, Asian rats are
often difficult to discriminate at a specific level using morphological or cytological criteria. The wide range of intra-specific morphological variation makes morpholog-ical criteria unsuitable for accurate rat species identifica-tion and has led to an over-descripidentifica-tion of species and to a confusing taxonomy, hampered by an overabundance of synonyms. It is particularly true concerning the Rattus genus (e.g. 41 synonyms for R. norvegicus, 83 for R. rattus, etc. [16] and see also [25]) that consists of a heteroge-neous accumulation of species and of several monophyl-etic clusters that may or may not prove to be grouped in a single genus [16]. This polyphyletic pattern is highlighted by the six species groups proposed by Musser and Carle-ton [16] (i.e. the Rattus rattus, Rattus exulans, Rattus norvegicus, Rattus fuscipes, Rattus leucopus and Rattus xanthurus species groups) and a seventh assemblage con-taining unaffiliated species (i.e. the Rattus species group unresolved) for which phylogenetic affinities are uncer-tain; some representatives will eventually be removed from the genus. Even karyotypic criteria, which previ-ously claimed to be species diagnostic tools, were recently revealed to be unsuitable to discriminate between Asian rat species [26]. DNA-based methods, however, appear to be promising tools for easy and accu-rate rat species-specific identifications [26].
Robins et al. [25] were the first to attempt to identify Rattus species using mitochondrial DNA sequences mostly obtained from museum tissue samples. Neverthe-less, their conclusions based on DNA-barcoding and tree based methods were limited because these methods need reliably identified specimens as reference. Specimens and tissues offered by museums to scientists are collected by many different people and it seems likely, given the extent of some misidentifications, that rat species identification is not an easy task even for mammal specialists. More-over, the taxonomy of the tribe Rattini is complex and changing and often different to that in use when samples were first described and listed in museums [25].
Level of variation in cytochrome b sequences was also proposed as a reference point in making decisions con-cerning species-level distinctions [27]. Based on the anal-ysis of 4 genera of rodents, Bradley and Baker [27] suggested that genetic distance values lesser than 2% were indicative of intraspecific variation and values higher than 11% of species recognition. But how to con-clude between 2 and 11% ? The DNA-based species delimitation approach proposed by Pons et al. [28] relies on DNA sequence information itself as the primary infor-mation source for establishing group membership and defining putative species and does not require defining entities as priors. This method was shown to be useful for identifying meaningful entities among groups whose cur-rent taxonomy is incomplete (e.g. tiger beetles of the genus Rivacindela, [28]) or uncertain (e.g. aphids of the
Pagès et al. BMC Evolutionary Biology 2010, 10:184
http://www.biomedcentral.com/1471-2148/10/184 Page 3 of 27
genus Brachycaudus) and has already been successfully applied when species are difficult to conceptualize (e.g. bacteria [29] or for asexual animals, [30,31]). Using a like-lihood framework, this new procedure detects the point of transition in the rate of lineage branching of a tree from interspecific long branches to intraspecific short burgeoning branching and identifies clusters of speci-mens corresponding to putative species.
In our study, we used molecular data to test the limits of the current taxonomy of the Rattini tribe. We aimed at identifying where species boundaries are unclear and where further investigations need to be carried out to provide a more rigorous systematic framework for epide-miological surveys. As molecular data are useful to detect and distinguish morphologically similar species, this study investigated the existence of putative cryptic spe-cies among the Rattini tribe (i.e. two or more spespe-cies that are classified as a single nominal species because they are at least superficially morphologically indistinguishable [32]). To these aims, we first sequenced two mitochon-drial and one nuclear genes from rat specimens coming from Southeast Asia (Thailand, Cambodia and Lao Peo-ple's Democratic Republic) to perform phylogenetic reconstructions. Then, as morphological characters are often misleading, we applied the method developed by Pons et al. [28] that determines, with no prior expecta-tions, the locations of ancestral nodes to define putative species. Finally, we endeavoured to give a name to each cluster recognized as a putative species using information from the literature and also sequences obtained from a museum holotype specimen following all the ancient DNA guidelines.
Methods
1. Sampling
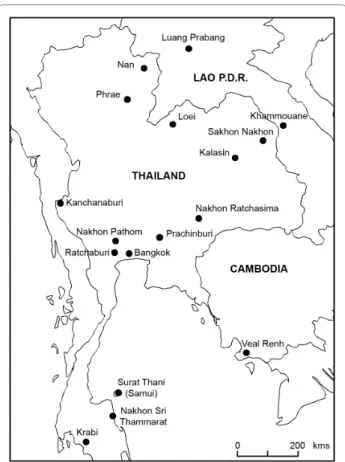
116 specimens of Rattini were selected among the 3,000 trapped by our team in the fields mostly in Thailand and punctually in Cambodia and in Lao PDR. Specimens selected were chosen in order to maximise the number of species and geographic locations analysed. Field speci-men identifications and locality information are listed in Table 1 and indicated in Figure 1. Field identifications were made based on morphological criteria according to [11,33-35]. Based on morphological and cytological evi-dences, no specimen was identified by us as a representa-tive of the cosmopolitan Rattus rattus species. Considering their preponderant place in epidemiological surveys, 4 worldwide black rat specimens (identified in [36]) were added to the sample set. To provide an appro-priate outgroup, we included specimens of the Eurasian harvest mouse, Micromys belonging to the Rattini tribe and previously recognized as the sister lineage to the Rat-tus group sensu lato of Verneau et al., [37,38,17,21]. In total, our taxa sampling consisted of 122 rats.
For nomenclatural prospects, a small piece of skin from the holotype specimen of Leopoldamys neilli was also analysed in this study. The type specimen is the male n°54-4330 from the Centre for Thai National Reference collections, collected by W.A. Neill in 1973 at Wat Tham Prapothisat, in the Saraburi Province (Kaengkhoi Dis-trict, Thailand, 14°35'N X 101°8'E) (see [33] for further details).
2. Sequence acquisition
Three genes proven valuable for rodent systematics were considered for the phylogenetic analyses [39,40,25,17]. We targeted two mitochondrial markers, the cytochrome b (cytb) and the cytochrome c oxydase I (COI) genes and the first exon of the nuclear gene encoding the interpho-toreceptor retinoid binding protein (IRBP).
To avoid contamination, pre-amplification procedures and post-amplification analyses were performed in inde-pendent rooms in the laboratory. DNA was extracted from tissue with DNEasy Tissue Kit (Qiagen) in accor-dance with the manufacturer's instructions. Primer sets used to amplify the cytb, COI and IRBP genes are listed in Table 2. All amplifications were carried out in 25 μL reac-tions containing about 30 ng of extracted DNA, 0.2 mg/ mL BSA (Roche, 1 mg/mL), 300 μM of each dNTP, 0.2 μM of each primer, 1 unit of Taq polymerase (Qiagen), 2.5 μL of 10X buffer, 0.5 mM of extra MgCl2. Cycling condi-tions were as follows: one activation step at 94°C for 4 min followed by 40 cycles of denaturation at 94°C for 30 s, annealing at 48°C-58°C depending on the primers (Table 2) for 30 s, elongation at 72°C for 45 s-1'30 min depend-ing on the length of the target (1 minute per kb), and a final extension at 72°C for 10 min. PCR products were sequenced by Macrogen (Seoul, South Korea).
3. Phylogenetic analyses
Sequences were aligned by eye using SEAVIEW [41] and translated into peptide sequences using the Transeq EMBOSS tool [42] to exclude putative NUMt copies and to ensure sequence orthology. As the risk of homoplasy by convergence and reversal is reduced by considering a large number of characters [43], we combined the three genes into a single dataset using the DAMBE software [44]. Thus, a total of 3,068 bp were considered in the sub-sequent phylogenetic analyses.
Base composition bias was evaluated using PAUP* v4.0b10 [45], and a chi-square test was performed to check for taxa with deviations of nucleotide composition. Substitutional saturation was assessed via saturation plots. Using DAMBE [44], the absolute number of transi-tions was plotted against MLComposite TN93 (Tamura-Nei Model) distance for all pairwise comparisons of taxa. For the three genes, the curve did not reach a plateau when subtracting the third codon position, but did reach
Pagès et a l. BM C Ev ol ut io na ry B io lo gy 2 01 0, 10 :1 84 ht tp :// w w w .b io m ed ce nt ral. com/147 1-21 48/1 0/184 Pag e 4 of 2 7
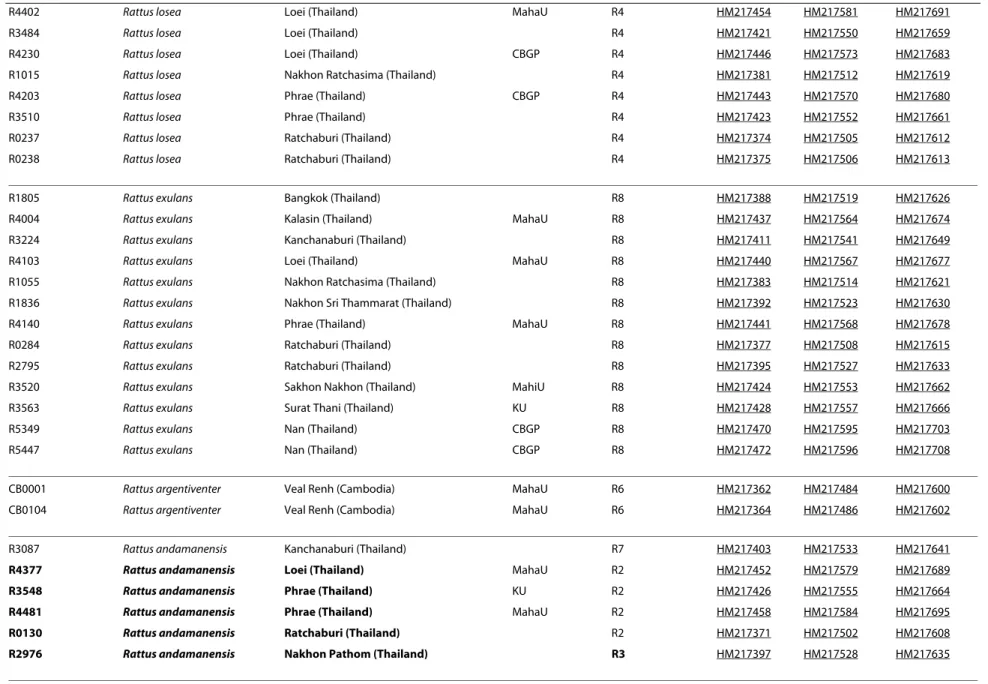
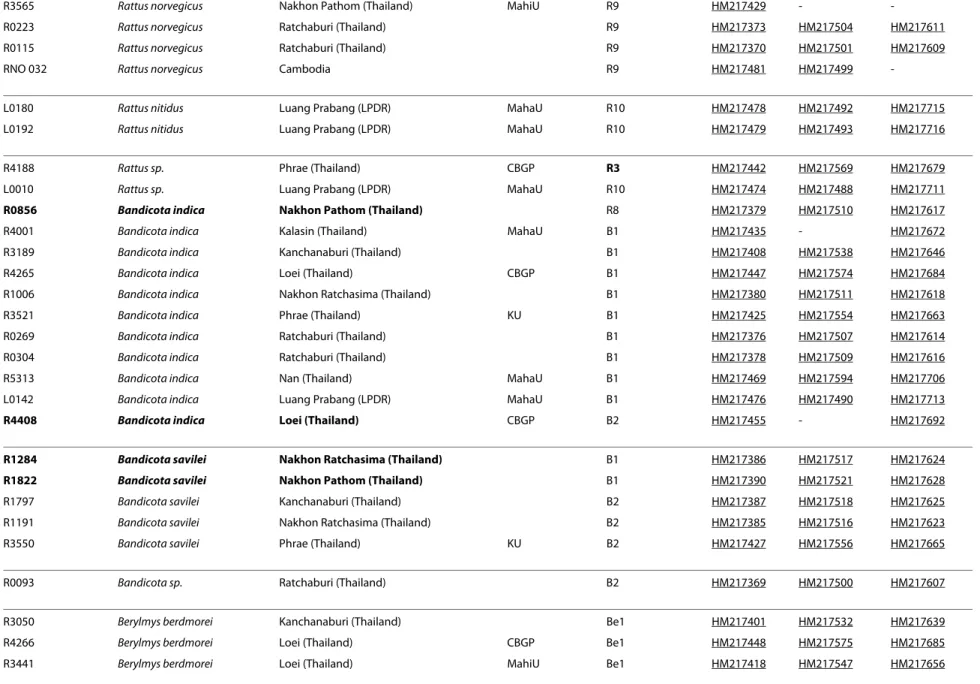
Table 1: Samples used in this study.
Sample information GenBank Accession Number
Laboratory sample
number Field Identification Locality Voucher localisation Phylogenetic species Cyt b COI IRBP
MDZ10Mada Rattus rattus Madagascar R1 HM217368 HM217495 HM217603
ratcosT820 Rattus rattus India R1 HM217367 HM217498 HM217606
ratcosR12 Rattus rattus Oman R1 HM217366 HM217496 HM217604
ratcosTE4264 Rattus rattus Tanzania R1 HM217365 HM217497 HM217605
R4003 Rattus tanezumi Kalasin (Thailand) MahaU R2 HM217436 HM217563 HM217673
R2953 Rattus tanezumi Kanchanaburi (Thailand) R7 HM217396 HM217525 HM217634
R2996 Rattus tanezumi Kanchanaburi (Thailand) R2 HM217398 HM217529 HM217636
R3122 Rattus tanezumi Kanchanaburi (Thailand) R2 HM217407 HM217537 HM217645
R3214 Rattus tanezumi Kanchanaburi (Thailand) R2 HM217410 HM217540 HM217648
R3573 Rattus tanezumi Nakhon Pathom (Thailand) KU R2 HM217430 HM217558 HM217667
R4016 Rattus tanezumi Phrae (Thailand) CBGP R2 HM217438 HM217565 HM217675
R4424 Rattus tanezumi Phrae (Thailand) MahaU R2 HM217456 HM217582 HM217693
R4436 Rattus tanezumi Phrae (Thailand) MahaU R2 HM217457 HM217583 HM217694
R5294 Rattus tanezumi Nan (Thailand) MahaU R2 HM217466 HM217592 HM217704
R5296 Rattus tanezumi Nan (Thailand) CBGP R2 HM217467 HM217593 HM217705
L0100 Rattus tanezumi Luang Prabang (LPDR) MahaU R2 HM217475 HM217489 HM217712
L0194 Rattus tanezumi Luang Prabang (LPDR) MahaU R2 HM217480 HM217494 HM217717
R3029 Rattus tanezumi Bangkok (Thailand) R3 HM217399 HM217530 HM217637 R1843 Rattus tanezumi Krabi (Thailand) R3 HM217393 HM217524 HM217631 R1147 Rattus tanezumi Nakhon Ratchasima (Thailand) R3 HM217384 HM217515 HM217622 R1016 Rattus tanezumi Nakhon Ratchasima (Thailand) R3 HM217382 HM217513 HM217620 R1818 Rattus tanezumi Prachinburi (Thailand) R3 HM217389 HM217520 HM217627 R2794 Rattus tanezumi Ratchaburi (Thailand) R3 HM217394 HM217526 HM217632 R0169 Rattus tanezumi Ratchaburi (Thailand) R3 HM217372 HM217503 HM217610 CB0028 Rattus tanezumi Veal Renh (Cambodia) MahaU R3 HM217363 HM217485 HM217601 R1833 Rattus tanezumi Nakhon Sri Thammarat (Thailand) R5 HM217391 HM217522 HM217629
Pagès et a l. BM C Ev ol ut io na ry B io lo gy 2 01 0, 10 :1 84 ht tp :// w w w .b io m ed ce nt ral. com/147 1-21 48/1 0/184 Pag e 5 of 2 7
R4402 Rattus losea Loei (Thailand) MahaU R4 HM217454 HM217581 HM217691
R3484 Rattus losea Loei (Thailand) R4 HM217421 HM217550 HM217659
R4230 Rattus losea Loei (Thailand) CBGP R4 HM217446 HM217573 HM217683
R1015 Rattus losea Nakhon Ratchasima (Thailand) R4 HM217381 HM217512 HM217619
R4203 Rattus losea Phrae (Thailand) CBGP R4 HM217443 HM217570 HM217680
R3510 Rattus losea Phrae (Thailand) R4 HM217423 HM217552 HM217661
R0237 Rattus losea Ratchaburi (Thailand) R4 HM217374 HM217505 HM217612
R0238 Rattus losea Ratchaburi (Thailand) R4 HM217375 HM217506 HM217613
R1805 Rattus exulans Bangkok (Thailand) R8 HM217388 HM217519 HM217626
R4004 Rattus exulans Kalasin (Thailand) MahaU R8 HM217437 HM217564 HM217674
R3224 Rattus exulans Kanchanaburi (Thailand) R8 HM217411 HM217541 HM217649
R4103 Rattus exulans Loei (Thailand) MahaU R8 HM217440 HM217567 HM217677
R1055 Rattus exulans Nakhon Ratchasima (Thailand) R8 HM217383 HM217514 HM217621
R1836 Rattus exulans Nakhon Sri Thammarat (Thailand) R8 HM217392 HM217523 HM217630
R4140 Rattus exulans Phrae (Thailand) MahaU R8 HM217441 HM217568 HM217678
R0284 Rattus exulans Ratchaburi (Thailand) R8 HM217377 HM217508 HM217615
R2795 Rattus exulans Ratchaburi (Thailand) R8 HM217395 HM217527 HM217633
R3520 Rattus exulans Sakhon Nakhon (Thailand) MahiU R8 HM217424 HM217553 HM217662
R3563 Rattus exulans Surat Thani (Thailand) KU R8 HM217428 HM217557 HM217666
R5349 Rattus exulans Nan (Thailand) CBGP R8 HM217470 HM217595 HM217703
R5447 Rattus exulans Nan (Thailand) CBGP R8 HM217472 HM217596 HM217708
CB0001 Rattus argentiventer Veal Renh (Cambodia) MahaU R6 HM217362 HM217484 HM217600 CB0104 Rattus argentiventer Veal Renh (Cambodia) MahaU R6 HM217364 HM217486 HM217602
R3087 Rattus andamanensis Kanchanaburi (Thailand) R7 HM217403 HM217533 HM217641
R4377 Rattus andamanensis Loei (Thailand) MahaU R2 HM217452 HM217579 HM217689 R3548 Rattus andamanensis Phrae (Thailand) KU R2 HM217426 HM217555 HM217664 R4481 Rattus andamanensis Phrae (Thailand) MahaU R2 HM217458 HM217584 HM217695 R0130 Rattus andamanensis Ratchaburi (Thailand) R2 HM217371 HM217502 HM217608 R2976 Rattus andamanensis Nakhon Pathom (Thailand) R3 HM217397 HM217528 HM217635
Pagès et a l. BM C Ev ol ut io na ry B io lo gy 2 01 0, 10 :1 84 ht tp :// w w w .b io m ed ce nt ral. com/147 1-21 48/1 0/184 Pag e 6 of 2 7
R3565 Rattus norvegicus Nakhon Pathom (Thailand) MahiU R9 HM217429 -
-R0223 Rattus norvegicus Ratchaburi (Thailand) R9 HM217373 HM217504 HM217611
R0115 Rattus norvegicus Ratchaburi (Thailand) R9 HM217370 HM217501 HM217609
RNO 032 Rattus norvegicus Cambodia R9 HM217481 HM217499
-L0180 Rattus nitidus Luang Prabang (LPDR) MahaU R10 HM217478 HM217492 HM217715
L0192 Rattus nitidus Luang Prabang (LPDR) MahaU R10 HM217479 HM217493 HM217716
R4188 Rattus sp. Phrae (Thailand) CBGP R3 HM217442 HM217569 HM217679
L0010 Rattus sp. Luang Prabang (LPDR) MahaU R10 HM217474 HM217488 HM217711
R0856 Bandicota indica Nakhon Pathom (Thailand) R8 HM217379 HM217510 HM217617
R4001 Bandicota indica Kalasin (Thailand) MahaU B1 HM217435 - HM217672
R3189 Bandicota indica Kanchanaburi (Thailand) B1 HM217408 HM217538 HM217646
R4265 Bandicota indica Loei (Thailand) CBGP B1 HM217447 HM217574 HM217684
R1006 Bandicota indica Nakhon Ratchasima (Thailand) B1 HM217380 HM217511 HM217618
R3521 Bandicota indica Phrae (Thailand) KU B1 HM217425 HM217554 HM217663
R0269 Bandicota indica Ratchaburi (Thailand) B1 HM217376 HM217507 HM217614
R0304 Bandicota indica Ratchaburi (Thailand) B1 HM217378 HM217509 HM217616
R5313 Bandicota indica Nan (Thailand) MahaU B1 HM217469 HM217594 HM217706
L0142 Bandicota indica Luang Prabang (LPDR) MahaU B1 HM217476 HM217490 HM217713
R4408 Bandicota indica Loei (Thailand) CBGP B2 HM217455 - HM217692 R1284 Bandicota savilei Nakhon Ratchasima (Thailand) B1 HM217386 HM217517 HM217624 R1822 Bandicota savilei Nakhon Pathom (Thailand) B1 HM217390 HM217521 HM217628
R1797 Bandicota savilei Kanchanaburi (Thailand) B2 HM217387 HM217518 HM217625
R1191 Bandicota savilei Nakhon Ratchasima (Thailand) B2 HM217385 HM217516 HM217623
R3550 Bandicota savilei Phrae (Thailand) KU B2 HM217427 HM217556 HM217665
R0093 Bandicota sp. Ratchaburi (Thailand) B2 HM217369 HM217500 HM217607
R3050 Berylmys berdmorei Kanchanaburi (Thailand) Be1 HM217401 HM217532 HM217639
R4266 Berylmys berdmorei Loei (Thailand) CBGP Be1 HM217448 HM217575 HM217685
R3441 Berylmys berdmorei Loei (Thailand) MahiU Be1 HM217418 HM217547 HM217656
Pagès et a l. BM C Ev ol ut io na ry B io lo gy 2 01 0, 10 :1 84 ht tp :// w w w .b io m ed ce nt ral. com/147 1-21 48/1 0/184 Pag e 7 of 2 7
R5310 Berylmys berdmorei Nan (Thailand) MahaU Be1 HM217468 - HM217709
L0006 Berylmys berdmorei Luang Prabang (LPDR) MahaU Be1 HM217473 HM217487 HM217710
R3618 Berylmys berdmorei Phrae (Thailand) KU Be1 HM217432 HM217560 HM217669
R3603 Berylmys berdmorei Phrae (Thailand) KU Be1 HM217431 HM217559 HM217668
R4400 Berylmys bowersi Loei (Thailand) MahaU Be2, a HM217453 HM217580 HM217690
R3425 Berylmys bowersi Loei (Thailand) KU Be2, a HM217415 HM217544 HM217653
R3415 Berylmys bowersi Loei (Thailand) KU Be2, a HM217413 HM217542 HM217651
R5410 Berylmys bowersi Nan (Thailand) MahaU Be2, a HM217471 - HM217707
L0151 Berylmys bowersi Luang Prabang (LPDR) MahaU Be2, a HM217477 HM217491 HM217714 R3268 Berylmys bowersi Kanchanaburi (Thailand) KU Be2, b HM217412 HM217597 HM217650 R4098 Leopoldamys sabanus Loei (Thailand) CBGP L1 HM217439 HM217566 HM217676 R4222 Leopoldamys sabanus Loei (Thailand) MahaU L1 HM217444 HM217571 HM217681 R4296 Leopoldamys sabanus Phrae (Thailand) MahaU L1 HM217450 HM217577 HM217687 R4276 Leopoldamys sabanus Phrae (Thailand) CBGP L1 HM217449 HM217576 HM217686 R4370 Leopoldamys sabanus Phrae (Thailand) CBGP L1 HM217451 HM217578 HM217688
R3111 Leopoldamys sabanus Kanchanaburi (Thailand) L3 HM217404 HM217534 HM217642
R3033 Leopoldamys sabanus Kanchanaburi (Thailand) L3 HM217400 HM217531 HM217638
R4517 Leopoldamys neilli Loei (Thailand) MahaU L2 HM217462 HM217588 HM217699
R4527 Leopoldamys neilli Loei (Thailand) MahaU L2 HM217463 HM217590 HM217701
R4486 Leopoldamys neilli Phrae (Thailand) MahaU L2 HM217460 HM217586 HM217697
R4485 Leopoldamys neilli Phrae (Thailand) MahaU L2 HM217459 HM217585 HM217696
R3419 Leopoldamys sp. Loei (Thailand) KU L1 HM217414 HM217543 HM217652
R4723 Niviventer fulvescens Loei (Thailand) MahaU N1 HM217465 HM217591 HM217702
R3212 Niviventer fulvescens Kanchanaburi (Thailand) KU N2 HM217409 HM217539 HM217647
R4525 Niviventer sp. Loei (Thailand) MahaU N1 HM217464 HM217589 HM217700
R3427 Niviventer sp. Loei (Thailand) KU N1 HM217416 HM217545 HM217654
R3429 Niviventer sp. Loei (Thailand) KU N1 HM217417 HM217546 HM217655
Pagès et a l. BM C Ev ol ut io na ry B io lo gy 2 01 0, 10 :1 84 ht tp :// w w w .b io m ed ce nt ral. com/147 1-21 48/1 0/184 Pag e 8 of 2 7
R3459 Niviventer sp. Loei (Thailand) KU N1 HM217419 HM217548 HM217657
R4497 Niviventer sp. Phrae (Thailand) MahaU N1 HM217461 HM217587 HM217698
R3492 Niviventer sp. Loei (Thailand) KU N1 HM217422 HM217551 HM217660
R3077 Niviventer sp. Kanchanaburi (Thailand) MahiU N3 HM217402 - HM217640
R3795 Nu Deng* Khammouane (LPDR) MahiU N4 HM217433 HM217561 HM217670
R3796 Nu Deng* Khammouane (LPDR) MahiU N4 HM217434 HM217562 HM217671
R3118 Maxomys surifer Kanchanaburi (Thailand) M1 HM217406 HM217536 HM217644
R3116 Maxomys surifer Kanchanaburi (Thailand) M1 HM217405 HM217535 HM217643
R4223 Maxomys surifer Loei (Thailand) CBGP M2 HM217445 HM217572 HM217682 R3464 Maxomys surifer Loei (Thailand) KU M2 HM217420 HM217549 HM217658
MK0509 BZ02 Micromys minutus China CBGP Outgroup HM217360 HM217482 HM217598
MK0509 BZ07 Micromys minutus China CBGP Outgroup HM217361 HM217483 HM217599
Field identifications were achieved based on morphological criteria according to [33-35] and [11]. "Phylogenetic species" relies on the DNA-based species delimitation method (see also Figure 3).
Mismatches between field identifications and phylogenetic species are highlighted in bold and reflect the difficulty to identify rat species even for experts. "Nu deng*" was assigned to animal identified but impossible to assigned to a particular species; in Thai language, "red rat".
"-" corresponds to missing data in the phylogenetic analyses. Voucher locations:
CBGP: Centre de Biologie et de Gestion des Populations, Montpellier, France - curator of the collections, Y. Chaval, chaval@supagro.inra.fr
/KU: Kasetsart University, Bangkok, Thailand - curator: W. Rerkamnuaychoke/MahiU: Mahidol University, Nakhon Pathom, Thailand - curator: V. Herbreteau, vincent.herbreteau@cirad.fr
/MahaU: Mahasarakham University, Mahasarakham, Thailand - curator: S. Soonchan See Figure 1 for additional information about sample locations.
Pagès et al. BMC Evolutionary Biology 2010, 10:184
http://www.biomedcentral.com/1471-2148/10/184 Page 9 of 27
a plateau when considering the entire sequences (data not shown). To discard fast evolving transitions and improve inferences without drastically compromising the resolu-tion, we decided to recode the third codon position nucleotides to two state categories, R (purine) and Y (pyrimidine), (RY-coding strategy; [46]).
Phylogenetic trees were reconstructed using two prob-abilistic approaches: maximum likelihood (ML) and Bayesian inferences (BI). The appropriate model of evolu-tion was first determined for each gene and for the con-catenated dataset (with and without RY-coding) using corrected Akaike information criterion (AICc) and MrAIC [47]. The HKY+I+Γ model was selected for both the cytb and COI genes while the GTR+ Γ was selected for the IRBP gene and the combined dataset (with and without RY-coding). ML analyses were performed with PhyML-v2.4.4 [48]. For each analysis, the transition/ transversion ratio, the proportion of invariable sites as well as the gamma distribution parameter (if necessary) were estimated and the starting tree was determined by BioNJ analysis of the dataset (default settings). Using optimization options, 500 bootstrap (Bp) replicates were performed. PhyML analyses were first run independently on each locus and then on the combined dataset (with
and without RY-coding). Taking into account that PhyML does not allow data-partitioning, partitioned ML analysis was also performed using RAxML 7.0.4 [49]. As the model choice is limited in RAxML, the general time-reversible (GTR) + Γ model (option -m GTRGAMMA) was selected for the three partitions (option -q multip-leModelFileName), and individual α-shape parameters, GTR-rates and base frequencies were estimated and opti-mized for each partition. Robustness of the tree was assessed using the rapid bootstrap procedure (option -f a) with 100 replications (option -# numberOfRuns) [50].
Bayesian analyses were performed using MrBayes v3.1 [51]. Four independent runs of 5,000,000 generations each were performed applying appropriate independent models of evolution to each gene. A burn-in period of 1,000,000 generations was determined graphically using Tracer1.2 [52]. For each dataset, all runs gave similar tree topologies and posterior probability (pp) values.
Alternative topologies were finally tested for signifi-cance using the Shimodaira-Hasegawa test (SH test) [53] (RELL option, 1000 Bp replicates) in PAUP* v4.0b10 [45].
4. Species delimitation: DNA-based species delimitation method
We used the DNA-based approach proposed by Pons et al. [28]. Using a likelihood framework, this new proce-dure detects the switch in the rate of lineage branching of a tree from interspecific long branches to intraspecific short budding branching and identifies clusters of speci-mens corresponding to putative species. Two models are implemented to account for the branching process of the entire tree. Under the null model, the whole sample derives from a single population obeying a coalescent process. The alternative model, called general mixed Yule coalescent (GMYC) model combines equations that sepa-rately describe branching within populations (coalescent process) and branching between species (a Yule model including speciation and extinction rates). Under the GMYC model, a threshold (T) is optimized such that nodes before the threshold are considered as species diversification events, whereas branches crossing the threshold define clusters following a coalescent process. A standard likelihood ratio test (LRT) is used to assess whether the alternative model provides a better fit than the null model. If the GMYC model is favoured over the null model, the T parameter of the maximum likelihood solution allows the number of species to be estimated. This test was achieved using the R code provided by T. G. Barraclough. This latest version outputs the estimates of the number of species, of the threshold time and their 95% confidence limits (i.e. solutions with 2-log likelihood units of the maximum).
Because a pre-requisite of the method is an ultrametric tree, we used the relaxed Bayesian dating method
imple-Figure 1 Sample locations of the Rattini specimens caught in the field and included in this study. See Table 1 for more sample
Pagès et al. BMC Evolutionary Biology 2010, 10:184
http://www.biomedcentral.com/1471-2148/10/184 Page 10 of 27
mented in Multidivtime [54] to convert our optimal phy-logram tree (estimated from the Bayesian analysis of the combined dataset) in a rooted additive tree with terminal nodes equally distant to the root. In this aim, we followed the documentation files written by Rutschmann [55] and the procedure detailed in [29]. The settings for the Markov chain Monte Carlo analyses were slightly modi-fied (200,000 cycles in which the Markov chain was
sam-pled 20,000 times every 10th cycle following a burnin
period of 100,000 cycles). No fossil is described to cali-brate our Rattini phylogeny. As our aim was simply to obtain an ultrametric tree, prior ages to lineages were arbitrarily assigned to 1 (rttm = 1; rttmsd = 0). The mean of the prior distribution for the rate of molecular evolu-tion at the ingroup root node (rtrate) was computed as the mean of the median of the amount of evolution for the different tips of the three independent gene trees (rtrate = 0.735; rtratesd = 0.367).
5. Species identification 5.1. Within the Rattus genus
Rattus cytb (663 bp) and COI (655 bp) sequences obtained by Robins et al. [25] were extracted from Gen-Bank and added to our mitochondrial (mt) dataset (see Table 3). As our study focuses on rodents from the Indo-chinese region, sequences of species belonging to the Rattus fuscipes species group (i.e. native Australian spe-cies) and to the Rattus leucopus species group (i.e. species
indigenous to New Guinea and adjacent archipelagos) were not incorporated in this dataset. Two other unpub-lished cytb sequences of R. argentiventer and R. sikkimen-sis (synonym of R. andamanensikkimen-sis) provided by O. Verneau and F. Catzeflis were also included in the subse-quent analysis. Sequences of a single representative of Berylmys, Niviventer, Leopoldamys, Maxomys and Micro-mys were used to root our mitochondrial phylogeny. Therefore, the mt dataset included 129 sequences corre-sponding to 1,318 bp of mt DNA. Partitioned ML analysis was performed using RAxML 7.0.4 [49] and the same options as before.
5.2. Ancient DNA analysis of a holotype specimen
For species assignment, we tested the relevance of DNA sequences obtained from a holotype specimen. As museum samples contain tiny amounts of poorly pre-served DNA, we selected a 85 bp fragment of the cytb gene, corresponding to positions from 666 to 750 of the gene sequence of Rattus norvegicus (NCBI accession number [GenBank NC_001665]). This fragment was cho-sen for the following reasons: i) it corresponds to an highly variable region of the gene that allows the discrim-ination of most vertebrate species including the closest related ones [56] ii) its short length is suited for the PCR amplification of degraded DNA [56] and iii) it has proved valuable for species assignment based on degraded DNA extracted from archaeological samples [57].
Table 2: Primers and PCR cycling conditions used in this study.
Designation Gene Name Nucleotide sequence 5' T 3' Annealing
Temperature Fragment Length (bp) Original Publication
Cytb cytochrome b
L14723 ACCAATGACATGAAAAATCATCGTT 50°C 1213 [69]
H15915 TCTCCATTTCTGGTTTACAAGAC
COI Cytochrome c oxydase I
BatL5310 CCTACTCRGCCATTTTACCTATG 48°C 750 [25]
R6036R ACTTCTGGGTGTCCAAAGAATCA
IRBP1 Interphotoreceptor retinoid binding protein (fragment 1)
I1-Rattus ATTGAGCAGGCTATGAAGAG 58°C 785 this study
J2-Rattus TAGGGCTTGCTCYGCAGG
IRBP2 Interphotoreceptor retinoid binding protein (fragment 2)
I2 ATCCCCTATGTCATCTCCTACYTG 52°C 892 [70]
J1 CGCAGGTCCATGATGAGGTGCTCCGTGTCCTG
cytb barcode Cytochrome b (museum specimens)
MPLeopol-fw MPRattusSL-Rev GAYAAAATYCCATTCCACCC TARTTRTCYGGGTCTCC 48°C 122 this study
Pagès et al. BMC Evolutionary Biology 2010, 10:184
http://www.biomedcentral.com/1471-2148/10/184 Page 11 of 27
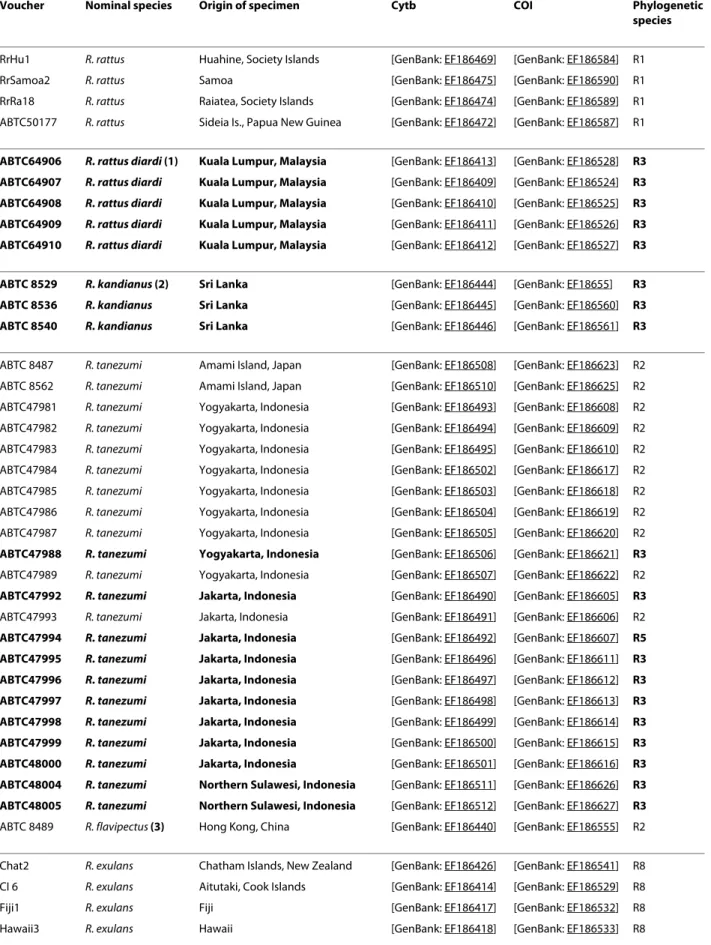
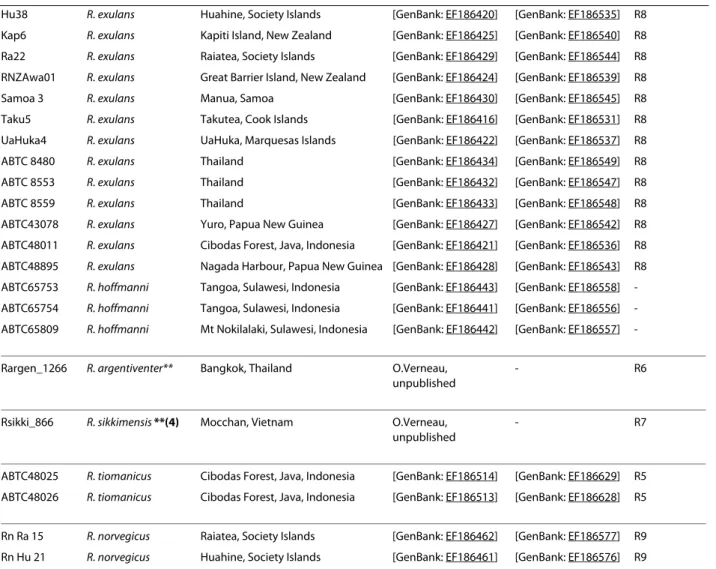
Table 3: Sequences from previous studies included in the mt dataset.
Voucher Nominal species Origin of specimen Cytb COI Phylogenetic
species
RrHu1 R. rattus Huahine, Society Islands [GenBank: EF186469] [GenBank: EF186584] R1
RrSamoa2 R. rattus Samoa [GenBank: EF186475] [GenBank: EF186590] R1
RrRa18 R. rattus Raiatea, Society Islands [GenBank: EF186474] [GenBank: EF186589] R1 ABTC50177 R. rattus Sideia Is., Papua New Guinea [GenBank: EF186472] [GenBank: EF186587] R1
ABTC64906 R. rattus diardi (1) Kuala Lumpur, Malaysia [GenBank: EF186413] [GenBank: EF186528] R3
ABTC64907 R. rattus diardi Kuala Lumpur, Malaysia [GenBank: EF186409] [GenBank: EF186524] R3
ABTC64908 R. rattus diardi Kuala Lumpur, Malaysia [GenBank: EF186410] [GenBank: EF186525] R3
ABTC64909 R. rattus diardi Kuala Lumpur, Malaysia [GenBank: EF186411] [GenBank: EF186526] R3
ABTC64910 R. rattus diardi Kuala Lumpur, Malaysia [GenBank: EF186412] [GenBank: EF186527] R3
ABTC 8529 R. kandianus (2) Sri Lanka [GenBank: EF186444] [GenBank: EF18655] R3
ABTC 8536 R. kandianus Sri Lanka [GenBank: EF186445] [GenBank: EF186560] R3
ABTC 8540 R. kandianus Sri Lanka [GenBank: EF186446] [GenBank: EF186561] R3
ABTC 8487 R. tanezumi Amami Island, Japan [GenBank: EF186508] [GenBank: EF186623] R2 ABTC 8562 R. tanezumi Amami Island, Japan [GenBank: EF186510] [GenBank: EF186625] R2 ABTC47981 R. tanezumi Yogyakarta, Indonesia [GenBank: EF186493] [GenBank: EF186608] R2 ABTC47982 R. tanezumi Yogyakarta, Indonesia [GenBank: EF186494] [GenBank: EF186609] R2 ABTC47983 R. tanezumi Yogyakarta, Indonesia [GenBank: EF186495] [GenBank: EF186610] R2 ABTC47984 R. tanezumi Yogyakarta, Indonesia [GenBank: EF186502] [GenBank: EF186617] R2 ABTC47985 R. tanezumi Yogyakarta, Indonesia [GenBank: EF186503] [GenBank: EF186618] R2 ABTC47986 R. tanezumi Yogyakarta, Indonesia [GenBank: EF186504] [GenBank: EF186619] R2 ABTC47987 R. tanezumi Yogyakarta, Indonesia [GenBank: EF186505] [GenBank: EF186620] R2
ABTC47988 R. tanezumi Yogyakarta, Indonesia [GenBank: EF186506] [GenBank: EF186621] R3
ABTC47989 R. tanezumi Yogyakarta, Indonesia [GenBank: EF186507] [GenBank: EF186622] R2
ABTC47992 R. tanezumi Jakarta, Indonesia [GenBank: EF186490] [GenBank: EF186605] R3
ABTC47993 R. tanezumi Jakarta, Indonesia [GenBank: EF186491] [GenBank: EF186606] R2
ABTC47994 R. tanezumi Jakarta, Indonesia [GenBank: EF186492] [GenBank: EF186607] R5
ABTC47995 R. tanezumi Jakarta, Indonesia [GenBank: EF186496] [GenBank: EF186611] R3
ABTC47996 R. tanezumi Jakarta, Indonesia [GenBank: EF186497] [GenBank: EF186612] R3
ABTC47997 R. tanezumi Jakarta, Indonesia [GenBank: EF186498] [GenBank: EF186613] R3
ABTC47998 R. tanezumi Jakarta, Indonesia [GenBank: EF186499] [GenBank: EF186614] R3
ABTC47999 R. tanezumi Jakarta, Indonesia [GenBank: EF186500] [GenBank: EF186615] R3
ABTC48000 R. tanezumi Jakarta, Indonesia [GenBank: EF186501] [GenBank: EF186616] R3
ABTC48004 R. tanezumi Northern Sulawesi, Indonesia [GenBank: EF186511] [GenBank: EF186626] R3
ABTC48005 R. tanezumi Northern Sulawesi, Indonesia [GenBank: EF186512] [GenBank: EF186627] R3 ABTC 8489 R. flavipectus (3) Hong Kong, China [GenBank: EF186440] [GenBank: EF186555] R2 Chat2 R. exulans Chatham Islands, New Zealand [GenBank: EF186426] [GenBank: EF186541] R8 CI 6 R. exulans Aitutaki, Cook Islands [GenBank: EF186414] [GenBank: EF186529] R8
Fiji1 R. exulans Fiji [GenBank: EF186417] [GenBank: EF186532] R8
Pagès et al. BMC Evolutionary Biology 2010, 10:184
http://www.biomedcentral.com/1471-2148/10/184 Page 12 of 27
Hu38 R. exulans Huahine, Society Islands [GenBank: EF186420] [GenBank: EF186535] R8 Kap6 R. exulans Kapiti Island, New Zealand [GenBank: EF186425] [GenBank: EF186540] R8 Ra22 R. exulans Raiatea, Society Islands [GenBank: EF186429] [GenBank: EF186544] R8 RNZAwa01 R. exulans Great Barrier Island, New Zealand [GenBank: EF186424] [GenBank: EF186539] R8 Samoa 3 R. exulans Manua, Samoa [GenBank: EF186430] [GenBank: EF186545] R8 Taku5 R. exulans Takutea, Cook Islands [GenBank: EF186416] [GenBank: EF186531] R8 UaHuka4 R. exulans UaHuka, Marquesas Islands [GenBank: EF186422] [GenBank: EF186537] R8 ABTC 8480 R. exulans Thailand [GenBank: EF186434] [GenBank: EF186549] R8 ABTC 8553 R. exulans Thailand [GenBank: EF186432] [GenBank: EF186547] R8 ABTC 8559 R. exulans Thailand [GenBank: EF186433] [GenBank: EF186548] R8 ABTC43078 R. exulans Yuro, Papua New Guinea [GenBank: EF186427] [GenBank: EF186542] R8 ABTC48011 R. exulans Cibodas Forest, Java, Indonesia [GenBank: EF186421] [GenBank: EF186536] R8 ABTC48895 R. exulans Nagada Harbour, Papua New Guinea [GenBank: EF186428] [GenBank: EF186543] R8 ABTC65753 R. hoffmanni Tangoa, Sulawesi, Indonesia [GenBank: EF186443] [GenBank: EF186558] -ABTC65754 R. hoffmanni Tangoa, Sulawesi, Indonesia [GenBank: EF186441] [GenBank: EF186556] -ABTC65809 R. hoffmanni Mt Nokilalaki, Sulawesi, Indonesia [GenBank: EF186442] [GenBank: EF186557] -Rargen_1266 R. argentiventer** Bangkok, Thailand O.Verneau,
unpublished
- R6
Rsikki_866 R. sikkimensis **(4) Mocchan, Vietnam O.Verneau, unpublished
- R7
ABTC48025 R. tiomanicus Cibodas Forest, Java, Indonesia [GenBank: EF186514] [GenBank: EF186629] R5 ABTC48026 R. tiomanicus Cibodas Forest, Java, Indonesia [GenBank: EF186513] [GenBank: EF186628] R5 Rn Ra 15 R. norvegicus Raiatea, Society Islands [GenBank: EF186462] [GenBank: EF186577] R9 Rn Hu 21 R. norvegicus Huahine, Society Islands [GenBank: EF186461] [GenBank: EF186576] R9 "Nominal species" stands for the identification given to the specimen by the curator or the collector ([25] and F. Catzeflis, pers. comm.). "Phylogenetic species" relies on the DNA-based species delimitation method (see also Figure 3).
(1) Rattus rattus diardi: Robins et al [25] reports that the specimens ABTC64906-64910 are identified by the South Australian Museum as the subspecies Rattus rattus diardi (not diardii) as listed by Ellerman [71] on the basis on R. r. diardi after Jentink [72]. As already mentioned by Robins et al., [25], R. diardii (after Jentink 1880) is however considered as a synonym for R. tanezumi by Musser and Carleton [16] but there is no 1880 reference in their bibliography.
(2) R. kandianus is listed as a synonym of R. rattus [16], (3) R. flavipectus of R. tanezumi [16], (4) R. sikkimensis of R. andamanensis [16]. ** indicates that specimens are no more available in the mammal tissue collection housed at the Institut des Sciences de l'Evolution de Montpellier [73].
Mismatches between nominal species and phylogenetic species are highlighted in bold. Table 3: Sequences from previous studies included in the mt dataset. (Continued)
To check if it provides adequate discrimination for rat species, the whole cytb sequences of the 122 specimens were reduced to the 85 bp fragment following the groups evidenced by the DNA-based species delimitation method. Based on our sampling, rat species could be eas-ily discriminated with this small sequence (except the two entities hereafter named Be2a and Be2b but see discus-sion) (see the 85 bp alignment in additional file 1). So, we decided to target this DNA barcode from the holotype of Leopoldamys neilli.
As we used a museum specimen, the difficulties associ-ated with ancient DNA studies are relevant to this
analy-sis. Hence, ancient DNA work was performed at the PALGENE national platform (CNRS, ENS Lyon, France) dedicated to ancient DNA analysis, following the stan-dard procedures and using specific equipment and per-sonal protections [58,59].
DNA was extracted from the holotype of Leopoldamys neilli following the protocol detailed by Rohland and Hofreiter [60]. Primer sets declined from Télétchéa et al., [56] were used for PCR attempts (Table 2). At least two independent PCR amplifications were performed in 25 μL reaction volumes containing 2.5 units of Perkin Elmer Gold Taq polymerase (Applied Biosystems), 1 mg/mL
Pagès et al. BMC Evolutionary Biology 2010, 10:184
http://www.biomedcentral.com/1471-2148/10/184 Page 13 of 27
BSA (Roche, 20 mg/mL), 2 mM MgCl2, 250 μM of each
dNTP, 0.5 μM of primers. For each independent PCR attempt, a range of dilutions was performed to find the best compromise between inhibitor's concentration and targeted DNA molecule concentration. DNA was ampli-fied with a 5 min activation step at 95°C followed by 55 cycles of denaturation (94°C, 30 s), annealing (48°C, 30 s) and elongation (72°C, 45 s). Amplification products were systematically cloned using Topo TA Cloning for sequencing kit (Invitrogen). 16 clones of independent amplifications were sequenced to determine the consen-sus sequence (Macrogen, Seoul, South Korea). The CAOS software, a two step character-based DNA barcoding method [61] was then used to determine if the Leopoldamys neilli holotype consensus sequence could be assigned to one of the clusters recognized as a putative species by the method of Pons et al., [28]. First, a diagnos-tic rules generator, P-Gnome, was used to search DNA changes through the 85 bp cytb matrix (122 sequences) and to establish diagnostic rule sets for each of the previ-ously described entities (outputs of the DNA-based spe-cies delimitation method). Then, the P-Elf program was run to classify as a query the holotype sequence accord-ing to the rules generated by P-Gnome.
Results
1. Sequence analyses and phylogenetic reconstructions
Cytb, IRBP and COI sequences were generated for 122, 120 and 116 rat specimens respectively. All sequences were deposited in GenBank under the accession numbers HM217360 to HM217717 (Table 1). No significant differ-ence in nucleotide composition among taxa was detected which indicated that no artificial grouping could occur due to a misleading compositional signal in the dataset. PhyML analyses were first carried out on each locus inde-pendently (data not shown). Each gene considered sepa-rately does not result in a robust Rattini phylogeny: mitochondrial markers help to resolve terminal nodes, while IRBP lends support to deepest ones. But, since the 3 genes yielded consistent, compatible topologies, sequences were concatenated and phylogenetic analyses were then carried out using the combined dataset.
Identical topologies were obtained with and without a
RY-coding of the 3rd codon position (data not shown).
However, better resolution and stronger topological sup-ports (Bp and pp) were reached without an RY recoding strategy. It seems that our dataset was not informative enough for a RY recoding strategy resulting in this case in an over-depletion of the phylogenetic signal.
BI, partitioned and unpartitioned ML analyses (without RY recoding strategy) yielded the identical topology given in Figure 2. Most relationships among the Rattini tribe were well resolved (supports 61-100 for Bp, 0.82-1.00 for pp). Monophyletic groups corresponding to the Rattini
divisions proposed by Musser and Carleton [16] are sus-tained with the highest values of Bp or pp. The Maxomys division clearly appears as the first division to diverge fol-lowed by the Dacnomys division, here represented by Leopoldamys and Niviventer genera, and the Rattus divi-sion. Berylmys appears with maximum support values as the earliest lineage to diverge among the Rattus division. A sister grouping is indicated between the genera Bandi-cota and Rattus, but this association is weakly supported. In fact, the monophyly of the Rattus genus received mod-erate pp (0.82) to weak Bp supports (61 for unpartitioned, 63 for partitioned ML analyses). To test the reliability of these findings, we considered an alternative hypothesis concerning the position of Bandicota within the Rattus division (i.e. Bandicota was placed inside the Rattus sp. cluster). SH-test failed to find significant differences between these hypotheses and the alternative branching orders of Bandicota inside the Rattus division could not be excluded (P > 0.05). Inside the Rattus sp. clade, the 3 Rattus species groups proposed by Musser and Carleton [16] could be distinguished. The R. exulans monotypic group (Re, Figure 2) clustered with the R. rattus species group (Rr, Figure 2) with high branch supports (Bp = 94/ 96 for the unpartitioned/partitioned ML analyses; pp = 1) and the R. norvegicus species group (Rn, Figure 2) is placed as sister taxa to the R. exulans species group/R. rattus species group cluster.
At this point in the analysis, 23 lineages (labelled R1 to M2 in the Figure 2) are identified within our taxon sam-pling. As their specific status are still questioned, intra-generic relationships are problematic to describe and will not be discussed in this section.
2. Species delimitation
The existence of distinct phylogenetic lineages was cor-roborated by the analysis of the branching rate pattern. A lineage-through-time plot based on the Multidivtime ultrametric tree evidenced a sudden increase in branch-ing rate towards the present, likely correspondbranch-ing to the switch from interspecies to intraspecies branching events (see additional file 2). To fit the position of the switch, the method of Pons et al. [28] was applied to the time cali-brated tree (Figure 3). The GMYC model was preferred over the null model of uniform branching rates (logL = 700.133, compared to null model logL = 687.218; 2ΔL= 25.83, χ2 test, d.f. = 3, p < 0.0001). The model fitted the switch in the branching pattern occurring at -0.07084 (i.e. T of the ML solution/it is worth reminding that the time separating the ingroup root from the present was arbi-trarily assigned to 1), leading to an estimate of 24 putative species, 4 of which containing a single individual (labelled R5, Be2b, N2 and N3 respectively in Figure 3). Two Max-omys (M1 and M2), 4 Niviventer (N1 to N4), 3 Leopol-damys (L1 to L3), 2 Bandicota (B1 and B2), 3 Berylmys
Pagès et al. BMC Evolutionary Biology 2010, 10:184
http://www.biomedcentral.com/1471-2148/10/184 Page 14 of 27
(Be1, Be2a, Be2b) and 10 Rattus species (R1 to R10) could be numbered as indicated in Figure 3. It is worth noting that the Berylmys lineage (labelled Be2 in Figure 2) actu-ally seems to correspond to two putative species follow-ing Pons et al's approach (therefore labelled Be2a and Be2b in Figure 3). Confidence interval for the threshold ranged from -0.09439 to -0.04189 and the estimated number of species ranged from 22 to 32 (i.e. estimates falling within 2 log-likelihood units of the ML solution).
3. Species identification 3.1. Within the Rattus genus
The partitioned ML analysis of the mt dataset including 64 new Rattus sequences (this study) plus 61 from previ-ous studies [25] gave the highly resolved and robust tree represented in Figure 4. This has allowed us to name some clusters identified as putative species by the DNA-based species delimitation method. Because the mono-phyly of each cluster embracing the supplementary pub-lished sequences is supported with the highest Bp value, the level of confidence of these identifications could be considered as maximal if the voucher identification beforehand is correct.
Robins' sequences identified as Rattus rattus cluster with 100% Bp support with sequences assigned to R. rat-tus specimens in [36]. Specific identification of group R1 as Rattus rattus is thus convincingly confirmed. Accord-ing to the mt tree, none of our samples from Thailand, Cambodia or Lao PDR could be assigned to this species. Following the same approach, R2 seems to correspond to Rattus tanezumi, R5 to Rattus tiomanicus, R8 to Rattus exulans and R9 to Rattus norvegicus. Sequences provided by O. Verneau and F. Catzeflis allow us identifying R6 as R. argentiventer and R7 as R. andamanensis. As expected, since its distribution is restricted to Sulawesi, sequences of Rattus hoffmanni group with none of our specimens. R. hoffmanni whose phylogenetic affinities among the Rattus rattus group need to be elucidated [16] appears as the sister taxa to R. argentiventer with strong support (88 Bp). The situation appears more complex for the species R3. This group corresponds to a mix of specimens identi-fied as R. rattus diardi in [25], Rattus kandianus (consid-ered as a synonym of R. rattus, [16]) in [25], R. tanezumi from Indonesia [25] and R. tanezumi, R. andamanensis or R. argentiventer according to the field names we assigned during our sampling. Consequently, no nominal species could be reliably assigned to R3.
According to morphological criteria and because its sistership with Rattus norvegicus [16] (see Table 4 in dis-cussion), R10 could be convincingly assigned to Rattus nitidus.
3.2 Ancient DNA analysis of a holotype specimen
Sequences obtained from holotype specimen We
suc-cessfully obtained 85 bp cytb sequences from the
Leopol-damys neilli holotype. At least two independent PCR runs were performed, positive PCR products were cloned and consensus sequences were determined using clone sequences of independent PCR amplifications. Analysis of the differences observed between the clone sequences and consensus sequence shows that 75% of the degrada-tion was due to deaminadegrada-tion of cytosines, as expected from ancient DNA substrates [62,63].
Holotype sequence authentication The consensus sequence was identified as a rat cytochrome b sequence using a BLAST program (no Leopoldamys neilli cyto-chrome b sequence was available in databanks such as EMBL or GenBank before this study). This sequence is a genuine holotype sequence for the following reasons: (i) Rattini samples were never introduced in the ancient DNA facilities before the analysis of this specimen was performed; (ii) all the 16 clones analysed were identified as rat; (iii) the errors induced by DNA damage are per-fectly consistent with the pattern generally observed for ancient DNA sequences (strong bias toward type 2 transi-tions caused by deamination of cytosine [62,63]); (iv) for each amplification, all three PCR blanks remained nega-tive [58]; (v) independent PCRs were performed and fur-nished the same conclusions. All in all, these points satisfy criteria of authentication for the ancient DNA work [59].
Assignment of the holotype sequence to a cluster The
genuine holotype sequence was deposited in GenBank under the accession number HM235947. It was assigned using the CAOS software to the monophyletic cluster corresponding to the Leopoldamys species, L2, in our tree (Figures 2 and 3). Consequently, this monophyletic clus-ter recognized as a putative species by the method of Pons et al. [28] could be without ambiguity named as Leo-poldamys neilli.
Discussion
1. Phylogenetic relationships within the Rattini tribe 1.1. Division-level relationships
Our phylogenetic analyses of Indochinese Rattini based on the combination of cytb, COI and the first exon of the IRBP genes is compatible with the revised taxonomy of Rattini divisions proposed by Musser and Carleton [16]. The Maxomys division, the Dacnomys division (here con-sisting of Leopoldamys and Niviventer as sister taxa) and the Rattus division (here including the genera Rattus, Bandicota and Berylmys) are sustained with the highest support values (Figure 2). These results are congruent with the Murinae phylogeny obtained by Lecompte et al. [17] based on the analysis of the combined cytb, IRBP and GHR genes. In this latter analysis, the 3 divisions are well supported and the Maxomys division is also the first to diverge followed by the Dacnomys one and the Rattus group sensu stricto of Verneau [64].
Pagès et al. BMC Evolutionary Biology 2010, 10:184
http://www.biomedcentral.com/1471-2148/10/184 Page 15 of 27
1.2. Relationships among the Rattus division: is the genus Rattus paraphyletic?
In our analyses, the position of Bandicota still remains uncertain. The monophyly of the genus Rattus is in real-ity weakly supported (0.82 for pp and 61/63 for Bp) and SH-test failed to reject the hypothesis of a paraphyletic Rattus genus (i.e. Bandicota is placed within Rattus). Verneau and collaborators [64,37] attempted to deter-mine the evolutionary relationships in Rattus sensu lato using LINE-1 (L1) amplification events. In their study [37], two LINE subfamilies were identified in the Bandi-cota and the other Rattus species except in Rattus fusci-pes. Since L1 subfamily absence from a particular taxa reflects an ancestral state rather than a derived state [64], these findings excluded Rattus fuscipes from a Bandi-cota/Rattus clade and placed Bandicota inside the genus Rattus leading to its paraphyly. Our study is in agreement with the multi-locus phylogeny of Lecompte et al., [17] which shows Bandicota and the genus Diplothrix diverg-ing together prior to the Rattus clade. In the Lecompte's study, the monophyly of the genus Rattus is highly sup-ported (98 Bp, 1 pp) but, as in our study, no specimen of the Rattus fuscipes species group was included. To draw conclusions about paraphyly in Rattus genus, it would be judicious to complete the taxa sampling among the genus Rattus and to include representatives of each Rattus spe-cies group defined by Musser and Carleton [16] particu-larly representatives of the Rattus fuscipes species group.
1.3. Relationships within the genus Rattus
The genus Rattus, with a total of 66 species currently rec-ognised [16] "is not only the single largest mammalian genus of all, but also arguably among the most complex and least understood" [65].
Within this genus, 7 species groups have been defined by Musser and Carleton [16], of which 3 inhabit the Indo-chinese region and are relevant to this study (Rr, Re and Rn in Figures 2 and 3). The Rattus rattus species group as described by Musser and Carleton [16] comprises 21 spe-cies of which 5 may be found in Thailand, Cambodia and Lao PDR. In our phylogenetic analysis, this cluster appears unambiguously to be monophyletic (1.00 for pp; 93/97 for Bp) and was placed undoubtedly as the sister group of the monotypic exulans species group (pp = 1.00; Bp = 94/96). This association was also found in recent molecular studies [25,17] but encompassing fewer repre-sentatives of the Rattus rattus species group. According to Musser and Carleton [16], the R. norvegicus species group includes 3 species (Rattus norvegicus, R. nitidus and R. pyctoris) of which only 2 may occur in the Indochi-nese region (Rattus norvegicus and R. nitidus). This group appears in our study as the sister taxa to the "R. exulans species group/R. rattus species group" cluster as found in [25] and [17].
Robins and colleagues [25] focusing on rats inhabiting islands in Southeast Asia, included in their sampling specimens from Australia (i.e. belonging to the Rattus fuscipes species group as defined by [16]) and from New Guinea and adjacent archipelagos (i.e. belonging to the Rattus leucopus group). Based on the analysis of nearly 2 kb of mt DNA, they recovered 5 of the 7 groups proposed by Musser and Carleton [16]. Our study, even if focusing on a different region of South East Asia, is perfectly con-gruent with Robins' study, and both studies are compati-ble with the revised taxonomy of the Rattus genus recently proposed by Musser and Carleton [16]. The sixth group defined by the authors [16] corresponds to the xanthurus species group encompassing species native to Sulawesi and adjacent islands. According to preliminary phylogenetic analyses of cytb sequences cited in [16], this assemblage could be placed as the sister-group to the R. leucopus and R. fuscipes groups. The last group defined by Musser and Carleton [16] does not correspond to a natural cluster but was formed for practical reasons since it includes species whose phylogenetic affinities have to be clarified; some may need to be excised from Rattus.
2. Toward a deep taxonomic revision of the Rattini tribe
At a specific level, we realized that phylogenetic relation-ships were difficult to discuss. Species misidentifications are indeed plentiful and recurrent both in our sampling (see Table 1) and in the literature. Mt sequences from Robins et al. [25] or provided by O. Verneau and F. Catze-flis were included in our dataset but questions about the reliability of the identification of vouchers were rapidly raised. To cite a few examples, the Rattus tanezumi sam-ple occurring in the tiomanicus cluster in [25] (see Figure 4) was proposed by the authors to represent a misidentifi-cation. Similarly, the R. rattus cf. moluccarius specimen in [64] and [37] was, according to Musser and Carleton [16], an example of R. nitidus whereas their specimen assigned to Niviventer niviventer was probably improperly identi-fied since N. niviventer has never been described in the locality where the specimen was caught [64]. We observed that the situation was worse regarding the Nivi-venter genus. When including sequences available in the databanks (i.e. cytochrome b sequences from [66]), numerous species appeared to be paraphyletic (data not shown). These results are presumably the consequence of species misidentifications and this explains why we decided to exclude these sequences from our analyses. All in all, these reports ([25,64] and this study) stressed the necessity of a sound taxonomic revision of the Rattini tribe. Consequently one must first determine valid spe-cies boundaries and then assign an appropriate name in accordance with the rules of the International Code of the Nomenclature.
Pagès et al. BMC Evolutionary Biology 2010, 10:184
http://www.biomedcentral.com/1471-2148/10/184 Page 16 of 27
Figure 2 Phylogenetic tree depicting relationships of the Indochinese Rattini based on the analyses of the combined cytb, COI and IRBP genes and reconstructed following Bayesian method. BI and ML analyses of the dataset gave an identical topology. Numbers above the branches
reflect support obtained from the analysis of the dataset following 3 different reconstruction methods: BI/unpartitioned ML/partitioned ML. Support values are not shown for very short branches. The symbol "**" indicates that phylogenetic relationships are not supported by the partitioned ML anal-ysis. Rr stands for Rattus rattus species group, Re for Rattus exulans species group, Rn for Rattus norvegicus species group, following Musser and Carle-ton's denominations [16]. At the right hand of the tree, lineages are labelled according to the genus to which they belong.
Pagès et al. BMC Evolutionary Biology 2010, 10:184
http://www.biomedcentral.com/1471-2148/10/184 Page 17 of 27
2.1. How many rat species in the Indochinese area we investigated?
According to Musser and Carleton [16], 9 genera corre-sponding to the following 27 species of Rattini may occur in our sampling area (Figure 1): Hapalomys delacouri (see Background for justification of its inclusion into the Rat-tini tribe), Sundamys muelleri, Chiromyscus chiropus, 3 Maxomys species (rajah, surifer, whiteheadi), 6 Niviventer species (fulvescens, hinpoon, langbianis, tenaster, cremo-riventer, confucianus), 3 Leopoldamys species (neilli, edwardsi, sabanus), 2 Bandicota species (indica and savilei), 2 Berylmys species (bowersi and berdmorei) and 8 Rattus species (andamanensis, argentiventer, exulans, tanezumi, losea, tiomanicus, norvegicus, nitidus). Accord-ing to our phylogeny (Figure 2), 23 lineages exist within our sampling and 24 putative species were suggested by the method of Pons et al. [28]. Confidence interval for the estimated number of species ranged from 22 to 32 (i.e. estimates falling within 2 log-likelihood units of the ML solution). An inadequate population sampling is one of the potential limitations of the branch length method as identified by Pons et al. [28]. However, the GMYC model was preferred over the null model of uniform branching rates indicated that the intraspecific sampling effort is satisfactory in our dataset (failure to reject the null model over the GMYC model could be an incomplete sampling per species; [28]). Moreover, among the 24 estimated spe-cies, 4 species (labelled R5, Be2b, N2 and N3 respectively in Figure 3) contain a single individual. In accordance with Pons et al, it seems that the GMYC method correctly deals with the inclusion of some rare species represented by only one single individual [28].
The estimated number of species fit well with the num-ber of species described in the literature for this area, although there are some exceptions, in particular within the Berylmys and the Rattus genera. Our study suggests 3 putative species of Berylmys in our sampling whereas only 2 are mentioned in the literature within the geo-graphic area sampled (Berylmys bowersi and B. berd-morei) (see Table 4). This outcome was supported by all the solutions included in the 95% confidence interval of the estimate of the number of species (Figure 3). This finding may be an artefact of the species delimitation method which could have difficulty in dealing with high level of population differentiation and strong phylogeo-graphic patterns. As acknowledged by Pons et al., [28], a limitation of this method is that populations with partial gene flow risk being recognized as separate entities. A marked phylogeographic structuring within Berylmys bowersi could explain the distinction of Be2a and Be2b as two putative species by the branch-length method. Be2b specimen came from the Kanchanaburi locality (Table 1, Figure 1), North to the Isthmus of Kra corresponding to the limit of the peninsular Thailand whereas the
speci-mens of the Be2b group came from the Northern Thai-land (Loei and Nan provinces, Figure 1) and Northern Lao PDR (Luang Prabang province, Figure 1). Populations of Berylmys bowersi in peninsular Thailand were reported to be geographically isolated and to differ in some ways from other populations [67]. Our findings are congruent with this report. Further investigations are needed to determine if Be2a and Be2b are two phylogenetic lineages of a same species exhibiting a strong phylogeographical pattern or if they have two be considered as two closely related but separate species.
In a similar way, five species belonging to the Rattus rattus species group have been described in this area (i.e. R. andamanensis, argentiventer, tanezumi, losea, and tio-manicus). Marshall [33] reported also the presence of R. rattus in all provinces of Thailand and considered the roof rat as the most abundant mammal in the country. Interestingly, since 1998, no specimen among the 3,000 caught during our successive field surveys in rural or urban areas of Thailand, Lao PDR and Cambodia could be identified as a representative of R. rattus, according to morphological, cytological and molecular evidences. Our findings offer no support for the presence of R. rattus in the area and are in conflict with previous claims of R. rat-tus in the Indochinese region [33]. However, this incon-sistancy is probably due to a difference in the usage of "Rattus rattus" in place of "Rattus tanezumi" rather than a problem of identification or occurrence.
Finally, our analysis corroborates the presence of an additional Rattus species (labelled R3 in Figure 3) already identified as the diardii clade in the mitochondrial phy-logeny of Robins et al. [25]. R3 could be a cryptic species. This statement yet needs further investigation using independent data (morphology, nuclear genes). Then, if this hypothesis proved to be correct, the R3 species would have to be carefully named (R. diardii is indeed considered at present as a synonym of R. tanezumi [16]). In agreement with our result, Aplin in his preliminary study of the cytb [65] observed that the taxonomy of the Rattus rattus species group might be rather thornier than suggested by previous studies mostly based on karyotypic or electrophoretic evidences. Indeed, his ongoing study reports two distinct phylogenetic clades in the Asian region. The first one would correspond to an endemic Southeast Asian taxon (recorded in Vietnam, Cambodia and Southern Laos) and might correspond to our R3 according to geographical evidence. Our study and Rob-ins' work reveal that the distribution of this Southeast group spreads far into the South as it occurs in Thailand and in Sri Lanka and also in Malaysia, in Indonesia and Northern Sulawesi (Figures 4 and 5). The second clade proposed by Aplin [65] would be a northern and South Asian taxon (found in Japan, Hong Kong, northern Viet-nam, northern Laos, and Bangladesh) and might
corre-Pagès et al. BMC Evolutionary Biology 2010, 10:184
http://www.biomedcentral.com/1471-2148/10/184 Page 18 of 27
spond to R2 (here also found in Thailand and Indonesia, Figure 4, Table 3/see also Table 4 for species name). Indeed when including Robins' sequences, R2 includes specimens from Japan and Hong Kong (Figures 4 and 5). As mentioned by Aplin [65], the latter group (R2) is more closely related to Rattus rattus rather than the former group (R3). In our trees (Figures 2 and 4), R2 is clearly placed as the sister taxa of R. rattus (R1). Our study rein-forces Aplin's assumption [65] that the two Asian clades (i.e. R2 and R3) are sympatric in some part of their distri-bution by increasing greatly the area where the two taxa co-occur in continental Southeast Asia. Both are found in Northern and Central Thailand (Phrae, Nakhon Pathom and Ratchaburi provinces; this study). Since some speci-mens of both taxa were trapped in exactly the same loca-tion and time, at least in Phrae, they probably also share similar habitats and are likely syntopic.
2.2. How to give a name?
By integrating phylogenetic, morphological and geo-graphical evidence, we proposed to attribute the names summarized in Table 4 to the 24 species highlighted
herein. Our propositions are not definitive but are revis-able ones. Indeed, once species boundaries are delimi-tated, assigning the appropriate name to each species is not an easy task particularly for the Rattini species whose taxonomy is complicated by a large number of synonym names. Even for a rodent specialist, morphological char-acters are sometimes misleading (see aforementioned misidentification examples) and intraspecific morpholog-ical polymorphism makes the problem more difficult. To alleviate this last difficulty, morphological studies have to consider a large number of specimens, a process that may be difficult and time-consuming to perform.
These inconveniences highlighted the great interest in obtaining molecular data from a holotype. Indeed, the holotype is by definition the element to which the name of a taxon is permanently attached. Consequently, includ-ing holotype specimens in molecular phylogenies would be very suitable to name each cluster recognized as a valid species providing that a rigorous and sound taxon-omy is already set up. Indeed, holotype specimens may correspond to problematic taxa (e.g. problems of
synon-Figure 3 Rattini ultrametric tree obtained with Multidivtime and clusters of specimens recognized as putative species by the method of Pons et al. [28]. Genetic clusters recognized as a putative species are highlighted in red and separated by longer black branches. The vertical bars
group all sequences within each significant cluster, labelled R1 to M2 according to the genus to which they belong. Rr for Rattus rattus species group,
Pagès et al. BMC Evolutionary Biology 2010, 10:184
http://www.biomedcentral.com/1471-2148/10/184 Page 19 of 27
Figure 4 ML tree depicting relationships within the Rattus division on the basis of mt dataset and estimated using partitioned ML analysis.
Bp values are shown above branches. Bp values equal to 100% are not indicated. Robins' sequences are highlighted in blue when nominal and phy-logenetic species are congruent, in red on the contrary (see also Table 3). Rattus hoffmanni sequences are indicated in grey; sequences provided by Verneau and Catzeflis in green. Rr for Rattus rattus species group, Re for Rattus exulans species group, Rn for Rattus norvegicus species group. At the right hand of the tree, cluster denomination is the same as in the Figure 3.