HAL Id: hal-01649520
https://hal.archives-ouvertes.fr/hal-01649520
Submitted on 7 Nov 2019
HAL is a multi-disciplinary open access
archive for the deposit and dissemination of
sci-entific research documents, whether they are
pub-lished or not. The documents may come from
teaching and research institutions in France or
abroad, or from public or private research centers.
L’archive ouverte pluridisciplinaire HAL, est
destinée au dépôt et à la diffusion de documents
scientifiques de niveau recherche, publiés ou non,
émanant des établissements d’enseignement et de
recherche français ou étrangers, des laboratoires
publics ou privés.
Influence of stirrer type on mixture homogeneity in
continuous powder mixing: A model case and a
pharmaceutical case
Khadija Marikh, Henri Berthiaux, Cendrine Gatumel, V. Mizonov, E.
Barantseva
To cite this version:
Khadija Marikh, Henri Berthiaux, Cendrine Gatumel, V. Mizonov, E. Barantseva.
Influence of
stirrer type on mixture homogeneity in continuous powder mixing: A model case and a
pharma-ceutical case. Chemical Engineering Research and Design, Elsevier, 2008, 86 (9A), pp.1027-1037.
�10.1016/j.cherd.2008.04.001�. �hal-01649520�
Influence of stirrer type on mixture homogeneity in
continuous powder mixing: A model case and a
pharmaceutical case
K. Marikh
a, H. Berthiaux
a,∗, C. Gatumel
a, V. Mizonov
b, E. Barantseva
baRAPSODEE, UMR CNRS 2392, Ecole des Mines d’Albi-Carmaux, Campus Jarlard, route de Teillet, 81000 Albi, France bIvanovo State Power Engineering University, Department of Applied Mathematics, Rabfakoskaya 34, 153003 Ivanovo, Russia
a b s t r a c t
Continuous powder mixers offer a viable alternative to batch processes, but have received very little attention in scientific literature and in the industrial world. Mixer design is still very empirical and is not based on assessed methodologies. In this paper, we report experiments that aimed to compare two very different types of stirrers for a pilot-scale continuous powder mixer, and for two types of mixtures: a model mixture and a real pharmaceutical mixture. The first stirrer A is of the frame type with inclined paddles and internal transporting screw, the other stirrer B is of the shaft type with paddles mounted on it. Results are first presented from the viewpoint of bulk powder flow by hold-up determination and correlation with operating conditions. General relationships are derived which show that the mobile B leads to higher hold-ups, which may be an important drawback. The study of mixture homogeneity globally confirms these findings, especially in a dense phase flow regime. In the fluidised regime, where the stirrer B can be used, attention is drawn to the negative effect of excessive rotational speeds on the quality of the mixtures.
Keywords: Continuous mixing; Stirrer design; Mixture homogeneity; Particulate solids; Pharmaceutical mixtures
1.
Introduction
As for any unit operation, powder mixing can be carried out either in continuous or batch mode. In industrial practice, batch processes have been used indiscriminately without pay-ing attention to the standard rule of thumb which states that the continuous mode should be used for capacities over 1500 t/year (seeCoulson et al., 1983). For “Over the counter” drugs (OTC) in the pharmaceutical industry, these levels of production can be reached in a single month. However, thanks to significant advances in the regulation of feeders (Knutsen and Landmo, 1996) over the last decade, but also due to the spread of a chemical engineering culture in these industrial sectors, continuous powder mixers are now considered as a real alternative to the more traditional batch mixers.
The pharmaceutical industry, like the food, plastic or cement industries, produces tablets, capsules or packets that are usually mixtures of 5–15 ingredients, and which may
con-∗Corresponding author.
E-mail address:berthiau@enstimac.fr(H. Berthiaux). Received 3 July 2007; Accepted 1 April 2008
tain several active ingredients. Standards have been developed to estimate the quality of the mixtures with respect to each of the actives and thus authorise the release of the prod-ucts on the market. As recycling is generally not allowed in such processes, products that fail at this stage are destroyed, which of course increases the prices of the products and indi-rectly induces a social cost. This makes mixture homogeneity assessment a key factor, also enhanced by the recent “process analytical technologies” (PAT) initiative from the FDA. Because of their great adaptability to process qualification and con-trol, continuous processes may be considered as forming a part of this small revolution. With regard to process qualifi-cation, continuous mixers offer a key advantage with respect to batch mixers during the scale-up procedure. In fact, a full-scale pharmaceutical process is qualified if its performance has been verified at one-tenth of the industrial scale. This is a serious problem as there is no guarantee that what has been proved with a 100 l mixer will still hold good for a 1 m3batch
Nomenclature
a parameter defined by Eq.(3)(kg s) CV coefficient of variation of a mixture
k parameter defined by Eq.(4)(kg1− ˛s˛)
M hold-up mass in the mixer (kg)
N number of possible samples in a mixture
Nengine rotational speed of the engine (s− 1)
Nmobile rotational speed of the mobile (s− 1)
n number of samples in an estimation
Q mass flow rate (kg s− 1)
s2 variance of a mixture (estimated from
sam-pling)
s2i variance of a mixture at the inlet of a continu-ous mixer
s2o variance of a mixture at the outlet of a contin-uous mixer
VRR variance reduction ratio
xi composition of sample i in key component
xm mean composition in key component
(estima-tion)
Greek letters
˛ parameter defined by Eq.(4)
! mean composition in key component (real) "2 variance of a mixture (estimated from
sam-pling)
vessel. In contrast, continuous mixer qualification, will sim-ply require a full-scale validation of, for example, 1 h if the industrial production time of a certain product is 10 h.
When considering a continuous mixing process, the fac-tors to take into account can be listed as: the physical and surface properties of the particulate solids, the geo-metrical and dynamic properties of the mixer and the accuracy of the dosage system (Hausner, 1972). Basically, in a continuous mixer, one aims to put the different products into contact and to reduce dosage fluctuations. In partic-ular, the choice of the geometry and size of the stirring device has to take into account the properties and use of the powders to be mixed. For “fragile” powders, one has to use a stirrer that does not provoke particle attri-tion, while for cohesive powders, the mobile may need to enhance shear forces to counterbalance inter-particle forces. From another standpoint, mobile configuration is responsi-ble for the enhancement of radial mixing and/or axial mixing (Laurent and Bridgewater, 2002) and, perhaps even, mixture segregation.
In any case, selecting design features is still very intu-itive as there is no universal method for mixer calculation, design and scale-up. There are at least two reasons for this. The first (Pernenkil and Cooney, 2006) is the quasi-absence of data because of the small numbers of studies (less than 15 peer-reviewed papers in the last 30 years). The second is the
difficulty in characterising and measuring particulate solids and their mixtures. In this work, we will focus on the quan-titative influence of stirrer design on the continuous mixing process for a pilot-scale apparatus. We will experimentally compare the effect of the mobile type on the quality of the mixtures and also on the agitation conditions that take place inside a mixer in the form of correlations between the dif-ferent variables of the problem. This will be done for a binary “model” mixture, as well as for a real pharmaceutical mixture.
2.
Particulate systems studied and mixture
standards
As stated above, most “everyday” mixtures are made of 5–15 ingredients, several of which are generally regarded as “key” ingredients. The number of such formulated products is exponentially increasing to meet the demand for product diversity from consumers. A company having 20 possible mix-ing recipes to process in a smix-ingle mixer will need to spend tremendous efforts on process optimisation “product by prod-uct”, or alternatively pay no attention to the problem and assume the risk of non-conformity of the mixtures by fixing the operating conditions independently of the products being mixed. These problems indicate a need to undertake studies to estimate the sensitivity of process variables to mixture charac-teristics. As extreme possibilities, real-case mixtures, as well as simple “model” mixtures will be considered in the present work.
2.1. Binary “model” mixture
The first mixture we will study is made of two food com-ponents: semolina and couscous. The latter is made by agglomeration of semolina and further cooking. Both products have approximately the same true density, the main differ-ence being particle size (seeTable 1).
Semolina and couscous can both be regarded as free-flowing powders. However, semolina contains a certain fraction of fine particles, as can be seen from the large size span measured for this product. This may induce a certain tendency to cohesive behaviour. In this paper, we will consider 50–50% by weight mixtures of these products. Experiments with each product “alone” have been reported previously (Marikh et al., 2005).
Most of the time, the homogeneity of a mixture is based on the standard deviation (or variance) of the composition of a set of samples, defined at a specified scale of scrutiny. If the mixture contains N possible samples of this “size”, if ! is the mean content of a key component, and if xiis its content in the sample i, this criterion can be expressed by the variance:
"2=N1
N
!
i=1
(xi− !)2 (1)
Table 1 – Main physical characteristics for the binary mixture used measured by: (1) sieving; helium pycnometer; volumenometer powder tester
(1) d50(!m) (1) (d90− d10)/2d50 (2) True density (g cm− 3) (3) Aerated density (g cm− 3) (3) Tapped density (g cm− 3) (3) Hausner index Couscous 1400 0.50 1.44 0.72 0.76 1.05 Semolina 340 0.82 1.47 0.76 0.83 1.08
If only n samples out of N are taken, the new variance s2
must be built from the estimated mean xmas a biased estimate
of "2. s2=1 n n
!
i=1 (xi− xm)2 (2)Estimating the homogeneity of a mixture from a sampling procedure therefore requires considering a large number of samples with a size equal to that of the scale of scrutiny (or scale of end-use properties attainment). In the case of a binary mixture, the key component is obviously one of the two prod-ucts, generally the limiting (lowest dosed) one.
2.2. Pharmaceutical mixture
The other mixture studied corresponds to a real industrial OTC drug containing three actives for a total of nine ingredients. Two of the actives, which will be referred to as A1and A2, are
agglomerated with three other ingredients to form the basic mixture (BM). A1and A2represent, respectively, 10% and 4%
by weight of the final drug. The four other ingredients, three additives I1, I2, I3and the active A3, are divided into two
pre-mixes P1and P2, which are defined inTable 2, along with some
of their physical characteristics.
This gives a mixture made of three streams to be mixed: BM, P1, P2. The flow rates attached to these streams have been
calculated to cope with the cadences of industrial production, and of course, with the composition of the mixture. The overall mixture is of low dosage in active A3(just under 0.5%), which
can be considered as the “main key component”. However, the mass of A3in a sample of unit dose is still detectable by
con-ventional methods. As regards the “physical” differences of the ingredients, the values do not really indicate a high risk of particle segregation by size or density. We may only note that flowability is worse for A3and I3, which are to be considered
as fully cohesive powders. This may cause difficulties during dosage and mixing.
In the pharmaceutical industry, standards on mixture homogeneity do exist and are actually used to release the products on the market (Berthiaux et al., 2006). They are based on three criteria that must be fulfilled for each of the active ingredients after sampling of 10 samples:
• The estimated mean xmmust lie in a − 7.5%/+7.5% interval
around the real mean content !.
• Each individual value xi must lie in a − 15%/+15% interval around ! (European pharmacopeia) or xm(FDA).
• The coefficient of variation CV = s/xmmust be less than 6%.
This procedure allows mixture homogeneity to be esti-mated while qualifying the sampling protocol at the same time. Also, it aims to identify possible deviation of individual content in the tablets.
3.
Experimental set-up and methods
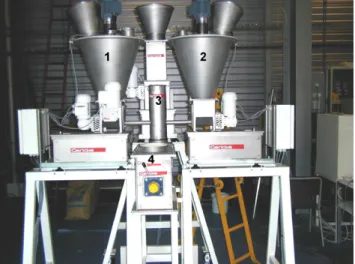
3.1. Pilot-scale continuous mixer
The Gericke GCM 500® continuous mixer was used in the
present study for the two mixtures under consideration. A detailed description can be found inMarikh (2003)and from
Fig. 1.
Fig. 1 – Pilot-scale continuous mixer: loss-in-weight feeders (1 and 2), feeding chute tube (3), and mixer (4).
The dosage system is made of three loss-in-weight feeders, which are in fact standard screw feeders, each being placed on a set of scales. This allows the powder to be weighed in a hopper at a certain time. After a small time increment, the loss in powder weight in a feeder is compared to the nomi-nal mass flow rate by the system of automatic control, and eventual deviations are corrected by modification of the rota-tional speed of the feeding screw. This allows a very precise and regular dosage to be attained, so that the height of pow-der in the feepow-ders has practically no influence on the inlet flow rates. In addition, because experiments were stopped just after the attainment of steady-state, there was no need to fill up the hoppers. The particulate products flow out of the screws directly into a feeding tube, which generates a chute towards the inlet of the mixer. Typical flow rates for our capa-bilities of storage are in the range 10–100 kg h− 1.
The mixer itself is a hemi-cylindrical tank of 50 cm in length, 16.5 cm in height and 20 cm in diameter. It can be clas-sified in the family of convective mixers as the motion of the particles is due to the action of a mobile that rotates inside the bulk. The outlet of the mixer consists of a gate valve, which can be fixed in three positions. In the present study, this gate was placed at the position for which the opening surface is the lowest, which results in highest hold-ups in the vessel. The stirrer can be of two very different types (seeFig. 2):
• Paddles installed on a frame with internal screw (mobile A). This mobile contains 14 paddles inclined at a 45◦angle and
supported by a frame whose dimensions are 45 cm in length and 18 cm in width. The shape of the paddles is rectangu-lar and slightly rounded at their edges to avoid any contact with the mixer wall. The screw placed at the centre of the frame allows coherent axial motion of the mixture to the outlet. At high rotational speeds, this mobile does not allow powders to be kept inside the mixer in quantities sufficient to provoke mixing. This is due to this particular design that confers too high a transport capacity to the stirrer. There-fore, low rotational speeds needed to be fixed, and the flow regime obtained can be qualified as a “dense phase convec-tive regime”. A typical industrial application is the mixing of “muesli”, for which a more vigorous mixing action can result in product disintegration, which is another type of product non-conformity.
Fig. 2 – The two stirrers design considered in this study (a, mobile A; b, mobile B).
• Paddles installed straight on a shaft (mobile B). In this case, 15 nearly rectangular paddles are placed on a shaft of the same length as the mobile A frame. Each paddle is inclined at a 2.5◦angle from the axis of rotation. Radial and axial
mix-ings are therefore ensured by the paddles themselves, as well as bulk powder transportation towards the gate valve. The low inclination of the paddles and the absence of a transport screw can lead to higher hold-ups, and to higher mean residence times, than with mobile A, all other con-ditions being equal. On the other hand, higher rotational speeds can be used, which provoke a sort of “fluidised flow regime” in the operation of the mixer. This regime can be used for cohesive powders, or non-fragile products. At lower rotational speeds, a dense phase convective regime is also frequently observed.
The range of rotational speeds was set between 2 and 60 Hz with respect to the driving engine, which corresponds to 5.2–156 rpm for each mobile. The engine speed was used to characterise mobile rotation because it was the one displayed at the control panel of the mixer. The following relationship was found to correlate the engine rotational speed with the rotational speed of the mobile:
Nmobile (rpm) = 2.6Nengine (Hz) (1)
Mobile A can be used up to 30–35 Hz, because at higher speeds no fluidisation occurs, so that practically no pow-der is retained in the mixer. Conversely, mobile B can be used in the whole range of speeds and can function at both regimes. This idea can also be expressed in terms of a Froude number, with the radius of the mobile as a characteristic distance. The limit Fr = 1 approximately corre-sponds to Nengine= 35 Hz, and gives a quantitatively correct physical explanation of centrifugal and gravity force bal-ance. This ultimately means that the two stirrers may effectively be compared in the dense phase flow regime only.
Also, a continuous mixer may be compared to the extreme cases of particle flow, plug flow and perfect flow, even qualita-tively. Of course, a perfect mixing situation should be sought, but at the same time the continuous mixers that are used are very much concerned with plug flow because of their horizon-tal configuration. The dispersion aptitude, or the capability of a mixer to place a single particle in any location of the tank with the same probability, is therefore an important criterion. It was calculated statistically from PEPT measurement by Laurent et al. some years ago, and was extracted as a model parameter in a Fokker-Planck scheme by Fan et al., in both cases for a batch mixer. It should be emphasised that such a definition
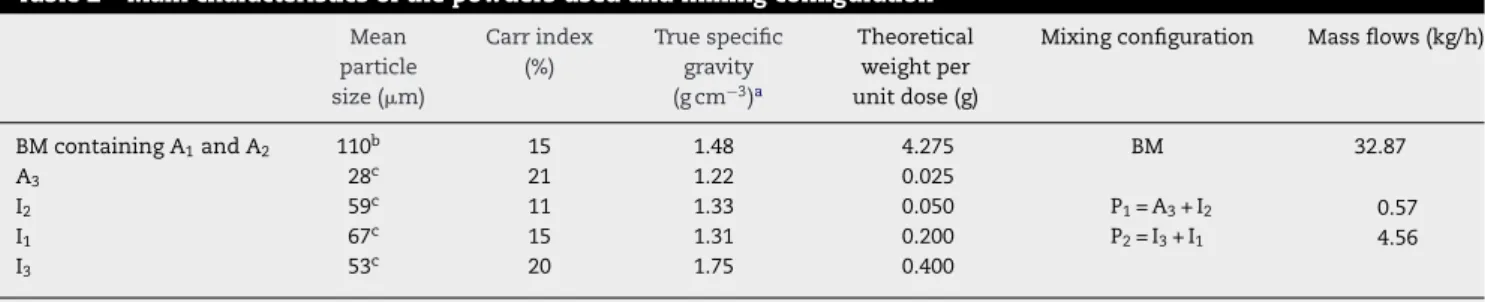
Table 2 – Main characteristics of the powders used and mixing configuration Mean particle size (!m) Carr index (%) True specific gravity (g cm− 3)a Theoretical weight per unit dose (g)
Mixing configuration Mass flows (kg/h)
BM containing A1and A2 110b 15 1.48 4.275 BM 32.87 A3 28c 21 1.22 0.025 P1= A3+ I2 P2= I3+ I1 0.57 4.56 I2 59c 11 1.33 0.050 I1 67c 15 1.31 0.200 I3 53c 20 1.75 0.400
a Measured by helium pycnometer. b Measured by sieving.
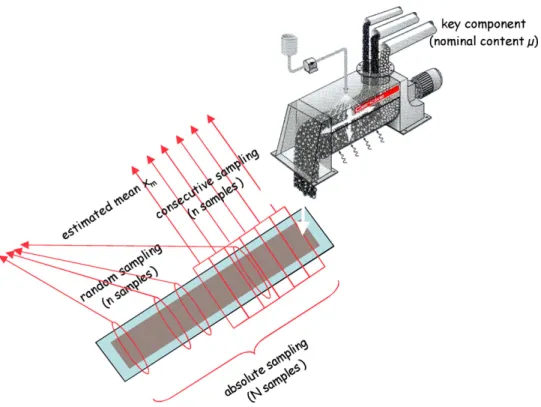
Fig. 3 – Sampling of a continuous mixing process illustrating the different strategies. holds for a macromixing problem (with single particles), but
not for a micromixing situation in which packets of particles and powder cohesion may be taken into consideration.
3.2. Sampling method
For continuous mixing processes, the assessment of mixture homogeneity must be performed at the outlet of the vessel with two possible strategies (seeFig. 3):
• By considering the random sampling of n samples over the whole production time.
• By considering n consecutive samples for a given time period.
The second method makes it possible to detect “local” defects that cannot be found by random sampling. There is, however, the risk that an inaccurate estimation will be made because defects can exist at a higher scale than that of the n consecutive samples. Of course, a major issue would be the development of on-line, real-time, non-invasive methods for the assessment of mixture homogeneity. But these are still at the research stage.
We adopted the second strategy and applied it to the two types of products. For this, a series of striated boxes was placed on a conveyor belt at the outlet of the mixer, which defines samples when the belt is operated. The conveyor also has adjustable speed, which in concordance to the flow rates used, can form samples of desired sizes. The number of samples and sample size are shown inTable 3for the mixtures studied. The sample compositions were determined by sieving for the binary mixture, and by HPLC for the pharmaceutical mixture, through an industrially validated protocol.
4.
Comparison on the basis of bulk particle
flow
When studying the effect of the operating conditions on the mixer’s hold-up,Sudah et al. (2002)emphasised the influence of the overall mass flow rate Q and of the rotational speed of the stirrer on the mean particle residence time. With the aim of obtaining a similar relation for each stirrer, we measured the hold-up masses at steady-state for different flow rates, at different rotational speeds, for each mobile and for each product.
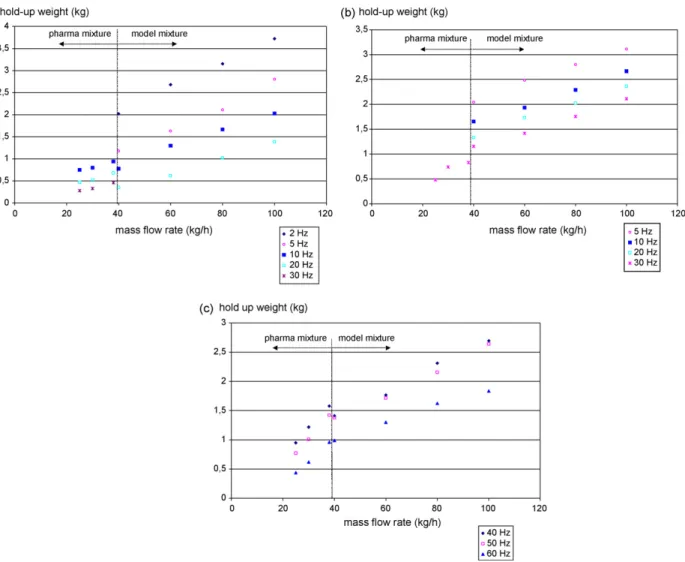
4.1. Following the hold-up weight
Fig. 4a shows the evolution of the hold-up mass in the mixer equipped with mobile A for the different process variables. The pharmaceutical mixture was processed with the lowest flow rates, while the model mixture was processed with the highest ones.Fig. 4b shows the data obtained with mobile B under the dense phase flow regime, whileFig. 4c corresponds to the fluidised regime.
In all the cases presented inFig. 4, an increase in the mass flow rate leads to an increase in the mass retained in the mixer. This is not a surprise since the volumetric fill was not maintained constant in the vessel. In mixers for which the powder outlet is made of an overflow system, this evolution could be somewhat different. Also, for a definite flow regime, an increase in the rotational speed of the stirrer provokes a decrease in the hold-up mass. But when transiting from the dense phase flow to the fluidised flow (compareFig. 4b and
Table 3 – Operating conditions for sampling
Sample size (g) Sample number
Binary mixture 4 27
Fig. 4 – Hold-up weights measured as a function of mass flow rates and mixture types for mobile A (a); mobile B in dense flow conditions (b); mobile B in fluidised flow conditions (c).
c for the values at 30 and 40 Hz), The hold-up mass rises quite sharply to slow down again with increasing rotational speed. When reaching a critical fluidisation value, which may probably be expressed in terms of mean particle velocity, the expansion of the bed suddenly liberates a large free volume to be occupied by the particles.
The influence of the processed mixture can be denoted on each of the three graphs by a “break” in the evolution of the hold-up weight for a given rotational speed. As stated above, only the data obtained in the dense phase flow regime can be used to compare the two different stirrer designs. This is illus-trated inFig. 5by plotting the hold-up masses for mobiles A and B, one against another for the same operating conditions, and paying attention to the position of the plots with respect to the main diagonal. For all the cases studied here, it is clear that the mass retained in the mixing chamber with stirrer B is higher than that with stirrer A. It can be said that A has a higher transport capacity than B, which can be explained by the inclination of the paddles, as well as by the presence of the internal screw. For the model mixture, the following empirical linear relationship was found to correlate the hold-ups with all other conditions being equal, and is valid in the hold-up range studied (and in the range 40–100 kg h− 1for flow rate and
5–30 Hz for rotational speeds):
MmobileB= 0.72MmobileA+ 1.19 (2)
If the above is expressed in terms of mean residence times, this means that mobile B allows residence times at least 20% higher than mobile A. From the viewpoint of mixture homo-geneity, this may be a drawback for mobile B. In continuous mixing, a good mixer is one that has a high capacity of disper-sion in a small volume, or for a small mean residence time. Mobile B will have to compensate its higher hold-up by a better dispersion capability.
Fig. 5 – Influence of stirrer design on hold-up weight in the mixer in the range 40–100 kg h−1for flow rate and 5–30 Hz
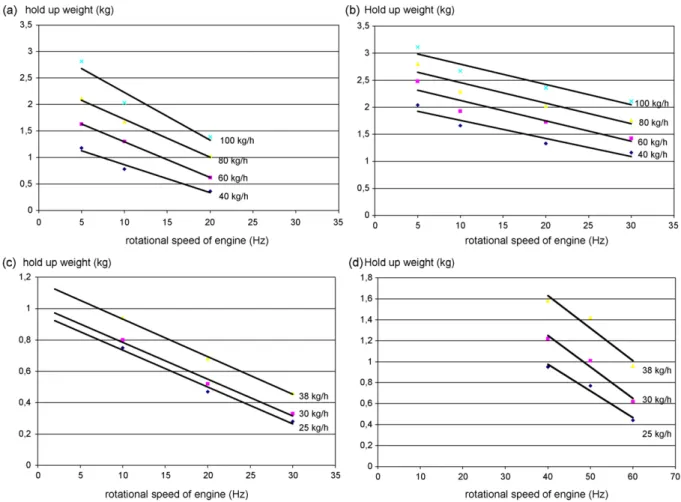
Fig. 6 – Relation M vs. Nengineat different flow rates for: the model mixture with stirrer A (a) or B in the dense phase regime
(b); the pharmaceutical mixture with stirrer A (c) or B in the fluidised regime (d).
4.2. Searching for an empirical relation
Despite the great advances of the last decade in powder flow simulation, for example by using DEM, the descrip-tion of the hold-up mass as a funcdescrip-tion of the different operating conditions, for a specific stirrer design and for such a high number of particles, still depends on empirical methods.
A relation between all these variables is all the more valuable if its general formulation can hold for different products, different designs and different flow regimes. In
Fig. 6, we have plotted the hold-up weights as a function of the rotational speed at different flow rates and for the different configurations. Basically, it is the same data as in
Fig. 4, but it highlights an important additional aspect: for a given flow regime or product or stirrer type, the relation
M vs. Nengineseems to be linear with the same slope, which concurs with the findings of Sudah et al. (2002). In other words:
M= aNengine+ f (Q) (3)
In the above, a does not depend on Q.Table 4summarises the mean values of a in each configuration. At first sight, a is generally dependent on the stirrer type, the flow regime and on the product to be mixed. It also seems that in the fluidised flow regime, which can be obtained only with mobile B, parameter
a becomes product-independent. Under the intense mixing
conditions that are to be reached for fluidisation of the pow-der, the products should follow process conditions rather more closely than under the “gentle” dense phase flow regime. However, this may be confirmed by further experiments. A comparison of the first two lines ofTable 4can also indicate the influence of the stirrer type.
The form of the function f for the system studied is rep-resented inFig. 7. Obviously, for no flow rate, there should be no powder in the system. Therefore, linear correlations, that give rise to non-zero values of the hold-up at Q = 0, can-not be used to fit all the data set. For this reason, we have decided to use the power law for this correlation, bearing in mind the considerable errors that will affect the values of the extracted parameters due to the small amount of data avail-able. For instance, a general correlation that can be employed
Table 4 – Values of the parameters adjusted to Eq. (4) for the different configurations studied
Mixture Stirrer type Flow regime a (mean value, kg s) k (kg1− ˛s− ˛) ˛
Model A Dense − 0.071 0.15 0.64
Model B Dense − 0.037 0.46 0.42
Model B Fluidised − 0.031 0.69 0.37
Pharma A Dense − 0.024 0.23 0.44
Fig. 7 – Evolution of f(Q) with the flow rate for the different products, stirrers and flow regime studied. Power law fitting.
to generalise all the data, and which is supposed to be valid within the range of the process parameters and flow regimes mentioned above, may be expressed as follows:
M= aNengine+ kQ˛ (4)
FromTable 4, it seems that ˛ is more or less independent of the conditions considered, so that a mean value may be adapted to all the systems. However, this needs further con-firmation by additional experiments with other mixtures.
Finally, comparison of the two stirrers from the viewpoint of bulk particle flow can acceptably be achieved from quanti-tative comparison of a and k, of course for a given product and a given flow regime. For the dense flow regime of the model mixture, it can be seen that both parameters (a and k) pro-duce higher hold-ups for mobile B than for mobile A, therefore inducing higher volumes to be mixed.
5.
Mixture homogeneity and mixer
efficiency
As mentioned previously, mobile A has an advantage with respect to mobile B because under the same conditions it gives rise to lower mean residence times. But a good mixer is also one that is able to disperse powders to a high extent, even in a higher volume. In this part of the paper, we will try to compare both stirrers from the point of view of the homogeneity of the mixtures as well as from that of mixer efficiency.
As follows from Eq.(2)and the sampling method detailed above, the variance of the mixture can be calculated for the two mixtures considered (n = 27 for the model mixture,
n = 12 for the pharmaceutical mixture). If this information is
matched to the standards for drug release on the market, it is possible to draw conclusions about mixture conformity. Also, inclusion of a continuous mixer in a production line is justified only if it is able to reduce the fluctuations of the feeding system down to an acceptable value. This mixer efficiency ratio was introduced by Danckwerts (1953)as the variance reduction ratio VRR: VRR =s 2 i s2o (5) In the above, siis the standard deviation of the mixture at the mixer’s inlet, while sois the standard deviation at the
out-let. A mixer providing high VRR should be used if low dosage quality feeders, such as vibrating chutes, are to be used. Also,
it emphasises that achieving technological improvement in feeders, for example by using an attachment to the tube (see
Kehlenbeck and Sommer, 2003), or by changing the mixer’s inlet chute design, is a part of the problem of obtaining high-quality mixtures in a continuous process.
5.1. Binary model mixture
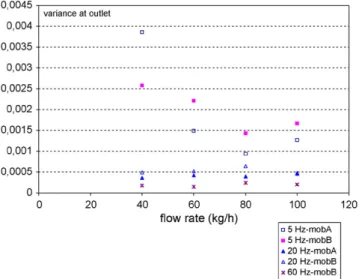
Inlet variances were obtained by a similar experimental pro-tocol for all the flow rates used. Due to higher convection in the transport screw of the feeders, this nominal homogene-ity is better for higher mass flow rates (seeMarikh, 2003). The outlet variances were determined as specified in Section3of this article.Fig. 8can be used to compare the two stirrers from the point of view of mixture homogeneity. In the dense phase flow regime (Nengine= 5 or 20 Hz), the variances obtained with
mobile B were always higher than those obtained with mobile A, if we except the value recorded for the lowest flow rate and lowest rotational speed. Even if mobile B provokes a better dispersion of one powder into another (see the RTD studies inMarikh et al., 2006), the drawback of a higher hold-up is ultimately decisive.
On the other hand, when reaching the fluidised regime (mobile B: 60 Hz), the variance seems to be much more inde-pendent of the flow rate than for lower values of N, and is approximately equal to 2 × 10− 4, a value that may correspond
to a CV close to 3% (which is acceptable regarding standards). For products that may be handled in the fluidised regime, e.g. regardless of attrition problems, mobile B might now be preferred. Nevertheless, care should be taken especially close to the transition between the two regimes because hold-up increases dramatically at this point (seeFig. 4b–c).
Overall, it can be said that the predominant factor is the rotational speed of the stirrer, which is able to divide the outlet variance by a factor of 10 when Nengineis increased by a factor of 4.
Variance reduction ratios can therefore be obtained by comparing outlet variances to inlet variances (see Fig. 9). Because of the previous findings, the dependence of the VRR to the mass flow rate can be said to be due to the dependence of the inlet variances to this parameter.
Fig. 8 – Mixture homogeneities obtained for the model mixture in the different configurations (type of mobile, rotational stirrer speed).
Fig. 9 – Mixer efficiencies obtained for the conditions studied (model mixture).
Where the dense phase flow regime must be maintained, mobile A is more efficient in reducing dosage fluctuations than mobile B. Also, it must be noticed that the mixer is all the more efficient when the rotational speed is increased. Whichever case is considered, at 5 Hz, the value of using this apparatus is debatable, as it only allows inlet fluctuations to be reduced by a factor of 2 approximately. Conversely, the values obtained in the fluidisation regime and for low flow rates, clearly justify the use of the mixer. At higher flow rates and in the same con-figuration, the mixer begins to be inefficient, probably because it gives rise to higher hold-ups.
5.2. Pharmaceutical mixture
Contrary to the model mixture case, in the pharmaceutical case the flow rate must be maintained constant to cope with production constraints. For instance, mixers were compared for different rotational speeds only. They were also compared with the industrial standards defined in the previous sections, and applied to the lowest dosed active ingredient A3.
Fig. 10a and b illustrates the effect of stirrer design in the dense phase flow regime (Nengine= 30 Hz). Individual content in
A3is reported for each sample, as well as the mean of the 12
consecutive samples. Limits of acceptability for xiand xm, as
stated by standards, are also calculated. Basically, the visual comparison of the two graphs gives enough information to evaluate the effect of stirrer type. As with the model mixture, and where the dense phase flow regime must be considered, mobile A gives a better mixture than mobile B for this rota-tional speed. In the present case, mobile B would have failed the conformity test and mobile A would have passed it suc-cessfully.
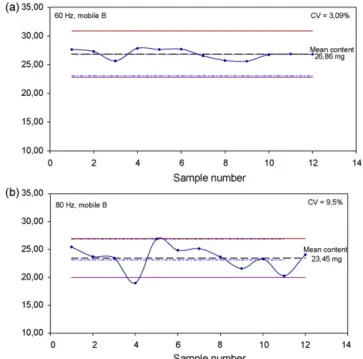
The action of mobile B in the fluidised regime is illustrated byFig. 11a and b. At 60 Hz the mixture will have just passed the conformity test with respect to the mean, while at 80 Hz it will have failed it because of an excessive CV value and a singularity on the individual contents. If one considers that lower hold-ups are attained with higher rotational speeds in a given regime, this means that the dispersion aptitude of the mixer gets worse with increasing Nengine.
Fig. 10 – Mixture profiles obtained for the pharmaceutical mixture at Nengine= 30 Hz for mobile A (a) and mobile B (b).
Acceptability is shown by dashed lines for the mean, and by hairlines for individual values.
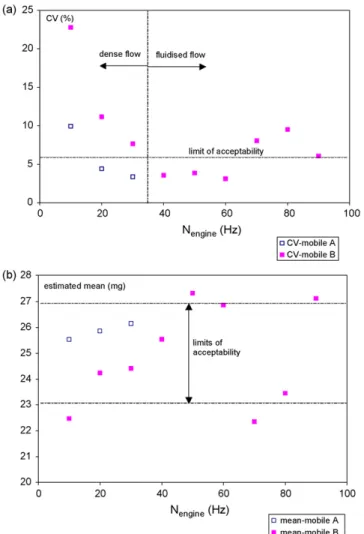
The results are synthesised inFig. 12a and b for the coef-ficient of variation and the estimated mean, respectively. In the dense phase flow regime, mobile A always gives CV values that are lower than for mobile B. As the initial variances are all the same whatever the conditions studied, it can be concluded that mobile A is intrinsically better than mobile B for this “real” mixture, and as long as dense flow is to be maintained. In the fluidised regime, mobile B gives CV values of the same order as mobile A at 20–30 Hz, as long as its rotational speed is in the range 40–60 Hz. In the range above (70–90 Hz), the quality of the mixtures is worse, although it has been obtained for
Fig. 11 – Mixture profiles obtained for the pharmaceutical mixture in the fluidised regime (mobile B) for two rotational speeds (60 Hz, a; 80 Hz, b). Flow rate is 38 kg h−1.
Fig. 12 – Acceptability of the pharmaceutical mixtures obtained for the two mobile types on the basis of the coefficient of variation (a) and the estimated mean (b). Flow rate is 38 kg h−1.
lower hold-ups. Again, we draw attention to the fact that such a mobile loses its dispersion capability at excessive rotational speeds. This may be because particles are hit too frequently at those speeds to be able to transit efficiently to other parts of the vessel.
From the viewpoint of the acceptability of the mixtures, it is important to focus on both graphs. From the CV criteria, five mixtures out of twelve meet the standard CV < 6%. Two of them are obtained with mobile A, and the other three with mobile B. Examining now the mean values, one out of the three “a priori good” mixtures obtained with mobile B fails the criteria and another one only passes it with a difference of 0.01 mg! The two good mixtures obtained with mobile A are still acceptable, the one obtained at 30 Hz being the best mixture ever produced in the mixer.
6.
Concluding remarks
In this work, we have experimentally compared the intrinsic performances of two different stirrer designs for mixing two very different types of powders. We can conclude that stir-rer (A), consisting of 14 blades installed on a frame with an internal screw, is more efficient than the one (B) consisting of 15 blades installed on a shaft, as long as a dense phase flow regime needs to be maintained. It may be a suitable choice for fragile products, or mixtures for which attrition is a factor (like breakfast cereals for example). When applied to the
spe-cific case of a real OTC drug, it also appeared that mobile A is more versatile and gives better mixtures than mobile B, even when the latter operates in the fluidised flow regime. We have drawn attention to the fact that an excessive rotational speed of the stirrer can lead to worse mixtures.
If this aspect is contrasted with the study of hold-ups, we understand that a good mixer is one that is able to disperse a lot of material in a small volume, or during a small residence time. Design of mixers may take into account these two ideas and try to combine them. In the present case, it is probable that a more versatile design could be imagined from mobile A, but with a lower transport capacity that may enhance fluidisation without emptying the mixer, perhaps by replacing the inter-nal screw with an interinter-nal mixing element, or adjusting the inclination of the blades. Mobile B could also be improved by a better design of the paddles to avoid the problems encoun-tered at high rotational speeds. Other improvements, at the level of the process itself may be considered: feeding design, tube chute design, outlet design, mixer shape design that may not favour plug flow, etc.
It should be emphasised that powder mixer design is still in its infancy. It is still not reasonable to buy a continuous mixer for an industrial process and think that it will only require a couple of weeks before “pressing the start button”. Extensive and intensive pilot trials are necessary. However, in our opinion, this situation may change with the devel-opment of on-line and real-time methods for assessing a mixture’s homogeneity, such as image analysis (seeMuerza et al., 2002), NIR and Raman spectroscopy, or laser-induced fluorescence, especially because this constitutes the first step in process control. We may think that in the future, a mixer may be sold with its own process control box. This will require important efforts in flow modelling, as well as in sensor mod-elling.
Acknowledgement
The authors wish to thank the company BMS, UPSA site based in Agen (France) for their fruitful scientific collaboration.
References
Berthiaux, H., Marikh, K., Gatumel, C. Gautier, R., 2006, Continuous mixing of pharmaceutical powder mixtures, in: Proceedings of the 5th World Congress on Particle Technology, AIChE spring Meeting, CD-ROM edition, Orlando.
Coulson, J.M., Richardson, J.F. and Sinott, R.K., (1983). Chemical
Engineering—Design (Pergamon Press).
Danckwerts, P.V., 1953, Theory of mixtures and mixing. Research, 6: 355–361.
Hausner, H.H., 1972, Problems of powder mixing and blending. Particulate Matter, 11: 3–11.
Kehlenbeck, V., Sommer, K., 2003, Possibilities to Smooth the Mass Flow Pulsations of Volumetric Feeders, CHOPS’4, Budapest, pp. 14.13–14.19.
Knutsen, G.F. and Landmo, G.I., 1996, Mixing of powders. The Postec Newsletter, 15: 27–30.
Laurent, B.F.C. and Bridgwater, J., 2002, Influence of agitator on powder flow. Chemical Engineering Science, 57: 3781–3793. Marikh, K., 2003, M ´elange en continu des solides divis ´es:
dynamique et mod ´elisation, PhD Thesis, INPL Nancy, France.
Marikh, K., Berthiaux, H., Mizonov, V. and Barantseva, E., 2005, Experimental study of the stirring conditions taking place in a pilot plant continuous mixer of particulate solids. Powder Technology, 157: 138–143.
Marikh, K., Berthiaux, H., Mizonov, V., Barntseva, E. and Ponomarev, D., 2006, Flow analysis and Markov chain modelling to quantify the agitation effect in continuous powder mixer. Chemical Engineering Research and Design, 84(A11): 1059–1074.
Muerza, S., Berthiaux, H., Massol-Chaudeur, S. and Thomas, G., 2002, A dynamic study of static mixing using on-line image analysis. Powder Technology, 128: 195–204.
Pernenkil, L. and Cooney, C.L., 2006, A review on the continuous blending of powders. Chemical Engineering Science, 61: 720–742.
Sudah, O., Chester, A.W., Kowalski, J.A., Beeckman, J.W. and Muzzio, F.J., 2002, Quantitative characterization of mixing processes in rotary calciners. Powder Technology, 126: 166–173.