HAL Id: hal-02297220
https://hal.archives-ouvertes.fr/hal-02297220v2
Submitted on 1 Oct 2019
HAL is a multi-disciplinary open access
archive for the deposit and dissemination of
sci-entific research documents, whether they are
pub-lished or not. The documents may come from
teaching and research institutions in France or
abroad, or from public or private research centers.
L’archive ouverte pluridisciplinaire HAL, est
destinée au dépôt et à la diffusion de documents
scientifiques de niveau recherche, publiés ou non,
émanant des établissements d’enseignement et de
recherche français ou étrangers, des laboratoires
publics ou privés.
Comparison of subjective methods, with and without
explicit reference, for quality assessment of 3D graphics
Yana Nehmé, Jean-Philippe Farrugia, Florent Dupont, Patrick Le Callet,
Guillaume Lavoué
To cite this version:
Yana Nehmé, Jean-Philippe Farrugia, Florent Dupont, Patrick Le Callet, Guillaume Lavoué.
Com-parison of subjective methods, with and without explicit reference, for quality assessment of 3D
graphics.
ACM Symposium on Applied Perception 2019, Sep 2019, Barcelona, Spain.
pp.1-9,
ABSTRACT
Numerous methodologies for subjective quality assessment exist in the field of image processing. In particular, the Absolute Category Rating with Hidden Reference (ACR-HR) and the Double Stimulus Impairment Scale (DSIS) are considered two of the most prominent methods for assessing the visual quality of 2D images and videos. Are these methods valid/accurate to evaluate the perceived quality of 3D graphics data? Is the presence of an explicit reference neces-sary, due to the lack of human prior knowledge on 3D graphics data compared to natural images/videos? To answer these questions, we compare these two subjective methods (ACR-HR and DSIS) on a dataset of high-quality colored 3D models, impaired with various distortions. These subjective experiments were conducted in a vir-tual reality (VR) environment. Our results show differences in the performance of the methods depending on the 3D contents and the types of distortions. We show that DSIS outperforms ACR-HR in term of accuracy and points out a stable performance. Results also yield interesting conclusions on the importance of a reference for judging the quality of 3D graphics. We finally provide recommen-dations regarding the influence of the number of observers on the accuracy.
CCS CONCEPTS
• Computing methodologies → Appearance and texture rep-resentations; Perception; Mesh models; Virtual reality.
KEYWORDS
Visual quality assessment, 3D graphics, subjective methodologies, single stimulus, double stimulus
ACM Reference Format:
Yana Nehmé, Jean-Philippe Farrugia, Florent Dupont, Patrick Le Callet, and Guillaume Lavoué. 2019. Comparison of subjective methods, with and without explicit reference, for quality assessment of 3D graphics. In ACM Symposium on Applied Perception 2019 (SAP ’19), September 19–20, 2019, Barcelona, Spain. ACM, New York, NY, USA, 9 pages. https://doi.org/10. 1145/3343036.3352493
SAP ’19, September 19–20, 2019, Barcelona, Spain 2019. ACM ISBN 978-1-4503-6890-2/19/09. . . $15.00 https://doi.org/10.1145/3343036.3352493
1
INTRODUCTION
Nowadays, three-dimensional (3D) graphics are widely used in many applications such as digital entertainment, architecture and scientific simulation. These data are increasingly rich and detailed; as a complex 3D scene may contain millions of geometric primitives, enriched with various appearance attributes such as texture maps designed to produce a realistic material appearance. These huge data tend to be visualized on various devices (e.g., smartphone, head mounted display) and possibly via the network. Therefore, to avoid latency or rendering issues, there is a critical need for the compression and simplification of these high quality 3D models. These processing operations may impact the visual quality of the 3D models and thus the quality of user experience (QoE). Thus to evaluate the visual quality as perceived by human observers, it is fundamental to resort to subjective quality assessment tests. In these tests, a group of human subjects is invited to judge the quality of a set of images subject to some predefined distortions. Such subjective experiments are also the most convenient way to create a ground-truth for judging the performance of objective quality metrics. However, selecting the best subjective methodology is not a trivial task since we should ensure that such method give valid and reliable results.
In the past years, several methodological guidelines have been defined for 2D image and video quality assessment by the Interna-tional Telecommunication Union (ITU) [BT.500-13 2012; P.910 2009]. In the field of computer graphics, previous subjective experiments were carried out to evaluate the visual quality of still and animated 3D models [Corsini et al. 2007; Guo et al. 2016; Lavoué and Mantiuk 2015]. However, no comparison of subjective methodologies have been made for such 3D data. So, there is no consensus about the best methodology to adopt for quality assessment of 3D models. In this work, we propose to compare two of the most prominent methods: Absolute Category Rating with Hidden Reference (ACR-HR) and Double Stimulus Impairment Scale (DSIS). We also assess whether or not the presence of an explicit reference is necessary for evaluat-ing the quality of 3D graphics. We chose to make the experiment in Virtual Reality (VR) using the HTC Vive Pro headset because VR is becoming a popular way of consuming and visualizing 3D content. Our psycho-visual experiment is detailed in section 3. In section 4, we present the results and analysis. Finally, concluding remarks are outlined in section 5.
SAP ’19, September 19–20, 2019, Barcelona, Spain Nehmé, et al.
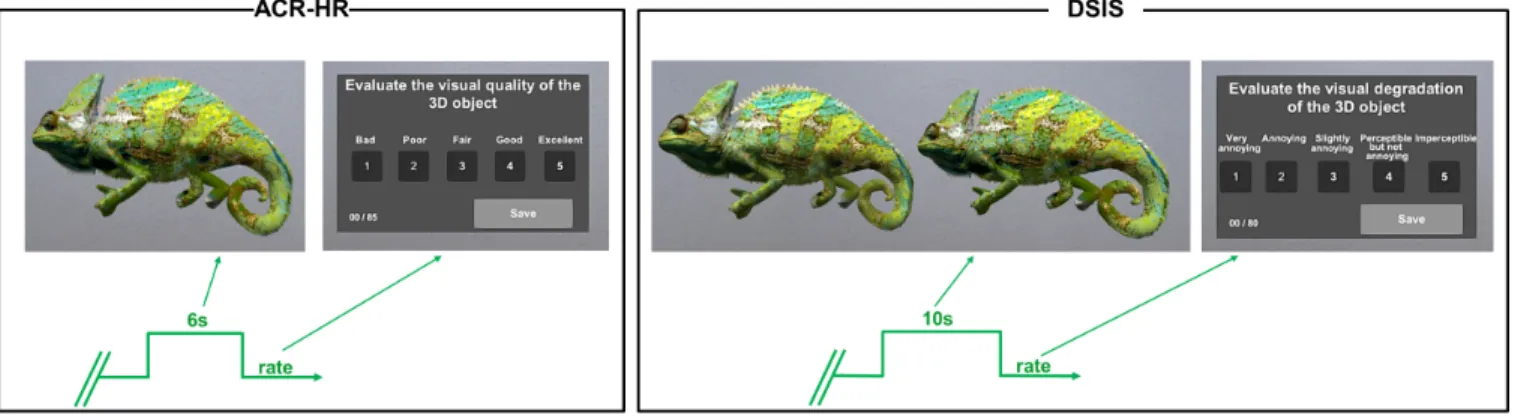
Figure 1: Illustration and timeline of the two subjective quality assessment methods explored in this study.
2
RELATED WORK
In this section we first review popular methodologies for subjective quality assessment of (natural) images and videos, and then focus on existing subjective tests conducted with 3D graphics. We finally discuss previous work that compares subjective methodologies. The reader is referred to [Lavoué and Mantiuk 2015] for a com-prehensive survey of subjective quality assessment in computer graphics.
2.1
Methodologies for subjective quality
assessment of images and videos
Several methodologies for 2D video/image quality assessment exist in the literature and have been standardized by the International Telecommunication Union [BT.500-13 2012]. Four subjective quality assessment methodologies are notably used nowadays: Absolute Category Rating (ACR), Double Stimulus Impairment Scale (DSIS), Subjective Assessment Methodology for Video Quality (SAMVIQ) and pairwise comparison (PC). The ACR method consists of pre-senting each impaired sequence individually to the observer and then asking him/her to rate its quality on a quality scale. In the DSIS method, the reference video is presented first, followed by the same video impaired. The observer is asked to rate, on an impairment scale, the degradation of the second video compared to its refer-ence. These methods are categorical rating since they use a 5-level discrete scale [Mantiuk et al. 2012]. They are dominant in video sub-jective quality tests [BT.500-13 2012; P.910 2009]. Furthermore, ACR with hidden reference (detailed in section 3) is notably used by the Video Quality Experts Group (VQEG) [VQEG 2007]. The pairwise comparison method (PC) is an alternative method in which two distorted videos are displayed, side by side, and the observer has to choose the one having the highest quality. The fourth method is SAMVIQ. It differs form the others in several aspects. SAMVIQ uses a multi-stimuli with random access approach [Huynh-Thua and Heath 2007]. The test sequences are presented one at a time but the observer is able to review each video and modify the quality score multiple times. In addition, it uses a continuous quality scale (0-100). Note that for graphics applications requiring localized information on the distortion visibility, the methodology based on the local marking of visible distortions is commonly used [Piórkowski et al. 2017; Wolski et al. 2018]. In such subjective experiments, observers manually mark the visible local artifacts in the impaired images.
2.2
Subjective quality assessment of 3D
graphical models
When it comes to subjective tests involving 3D models, no specific standard or recommendation exist. Researchers have adapted ex-isting image/video protocols, while considering different ways to display the 3D models to the observers (e.g., 2D still images, ani-mated videos, interactive scenes). Lavoué et al. [Lavoue et al. 2006] and Corsini et al. [Corsini et al. 2007] considered single stimulus protocols, derived from ACR, to assess the quality of impaired 3D meshes. The observers were able to freely interact with the 3D models and then had to rate the visibility of the distortions be-tween 0 (invisible) and 10. Despite these two works, in the majority of existing experiments a double stimulus protocol (derived from DSIS) is used, with diverse modalities of display. Watson [Watson et al. 2001] used still screenshots to evaluate mesh simplification distortions while Lavoué [Lavoué 2009] considered free-viewpoint interactions for evaluating 3D meshes subject to smoothing and noise addition. Pan et al. [Pan et al. 2005] and Luis et al. [Cruz et al. 2019] considered animations (e.g. low speed rotations) for assessing the quality of resp. textured meshes and colored point clouds. It seems that most researchers intuitively felt that rating the absolute quality of a 3D graphical model (i.e., without the reference nearby) might be a difficult task for a naive observer (i.e. non-expert). Note that several recent works used pairwise comparison methods [Guo et al. 2016; Vanhoey et al. 2017].
2.3
Comparison of subjective methodologies
Several works evaluate and compare the performance of the method-ologies described above (mostly for natural image or video content). Péchard et al. [Stéphane Péchard, Romuald Pépion, Patrick Le Callet 2008] evaluate the impact of the video resolution on the behavior of both ACR and SAMVIQ methods. They found that, for a given number of observers, SAMVIQ is more accurate especially when the resolution increases. They also state that the precision of the methods depends on the number of observers: 22 observers are required in ACR to obtain the same precision than SAMVIQ with 15 observers. Contrary to what the ITU recommends regarding the minimum number of subjects required for ACR (15), VQEG [VQEG 2007] and Brunnström et al. [Brunnström and Barkowsky 2018] recommend to use at least 24 observers. Nevertheless, the SAMVIQ method is considerably more time-consuming than an ACR (or DSIS) method.
4 tested methods (single stimulus, double stimulus, forced choice pairwise comparison, and similarity judgments methods). However, despite the simplicity of the task of this method, it may become te-dious if all sequences need to be tested (PC requiresn(n−1)2 trials to assessn sequences while ACR requires n +1 trials and DSIS requires n trials). Recently, Singla et al. [Singla et al. 2018] investigated the performance of the DSIS and a Modified Absolute Category Rating (M-ACR) method for omnidirectional (360°) videos using an Oculus Rift. They denoted that M-ACR is statistically slightly more reliable than DSIS since DSIS gave larger confidence intervals.
To conclude, while many methodological guidelines have been defined for natural video/image quality assessment (using a screen), no similar standards exist for quality evaluation of 3D graphics. No consensus has emerged toward the best methodology for such data, especially in a virtual or mixed reality environment. One partic-ular open question is whether or not a reference is necessary. In this context, we compare the performance of the Double-Stimulus Impairment Scale (DSIS) and the Absolute Category Rating with Hidden Reference (ACR-HR) methodologies for assessing the qual-ity of 3D graphics. We consider a VR context using the HTC Vive Pro headset, a high-end virtual reality headset1. The present work attempts to make a first step toward standardizing a methodology for assessing the quality of 3D graphics.
3
SUBJECTIVE EXPERIMENT
We compare the effectiveness and the accuracy of two subjective quality assessment methods for 3D graphic objects in an immersive virtual environment. For this purpose, we conducted a psycho-visual experiment using the HTC Vive Pro, in the fixed position mode. This section provides the details of our subjective study.
3.1
Experimental methodologies
Several methodologies exist in the literature of subjective quality assessment. In this paper, we investigate two categorical rating methods: a single and a double stimulus methods. The selected methodologies are presented below and illustrated in Figure 1. •Absolute Category Rating with Hidden Reference
(ACR-HR): also known as single stimulus categorical rating, in which the impaired stimuli are presented one at a time in addition to the original unimpaired stimuli (references), without informing the subjects of their presence. The observers are asked to evalu-ate the quality of the stimulus shown using a Likert-type scale
1https://www.vive.com
that, the subject is asked to rate the impairment of the second stimulus in relation to the reference [P.910 2009] using the follow-ing five-level impairment scale: Imperceptible(5), Perceptible but not annoying(4), Slightly annoying(3), Annoying(2),Very annoy-ing (1). Similarly to ACR, 10s presentation time is recommended per stimulus (≈20s/pair). However, this methodology slows-down the experiment too much since it requires at least twice as much time as ACR method. The overall length of the experiment affects the efficiency of the experimental method especially in virtual reality where most of the subjects are not used to the VR head-set and tend to exhibit symptoms of cybersickness both during and after the VE experience [LaViola 2000]. To avoid these is-sues, we chose to display the reference and the test stimulus simultaneously side by side in the same scene. In this way, the number of presentations is halved. In addition, using simultane-ous presentation makes the evaluation of the differences between the stimuli easier for the subjects [P.910 2009]. Note that this "simultaneous" version of DSIS is what is preferred in most sub-jective tests involving 3D content [Cruz et al. 2019; Lavoué 2009; Lavoué and Mantiuk 2015; Pan et al. 2005; Watson et al. 2001]. For this methodology, we increased the presentation time to 10s, since, comparing to ACR-HR, 6s is not sufficient to observe the 2 stimuli displayed in the scene, compare them and assess their impairments.
3.2
Experiment design
The objective of our study is to compare the accuracy of the ACR-HR and DSIS methods. For this purpose, observers were divided into two groups and were asked to rate the quality of a set of 80 distorted models (from 5 references), using both methodologies. ACR-HR and DSIS tests were made in different order according to the groups. Details about our study are described below.
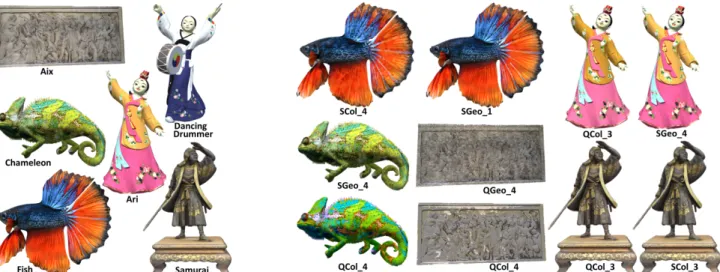
3.2.1 Stimuli Generation. We selected five triangle meshes of high resolution, each having a vertex color map: "Aix", "Ari", "Chameleon", "Fish", "Samurai" (see Figure 2). These 3D models are considered to be "good" or "excellent" quality. The number of vertices of the five models ranges from 250000 to 600000. They belong to very different semantic categories (human statues, animal, Art) and have different shapes and colors (Monocolor, warm cool and dull colors) (Figure 2). These reference models have been corrupted by 4 types of distortions, each applied with four different strengths:
• Uniform Geometric quantization (QGeo): applied on the geome-try.
SAP ’19, September 19–20, 2019, Barcelona, Spain Nehmé, et al.
Figure 2: Illustration of the 3D graphic reference models (Left) and some examples of distorted models (Right). Acronyms for distorted models refer to Type_Strength.
• Uniform LAB color quantization (QCol): applied on the vertex colors.
• "Color-ignorant" simplification (SGeo): mesh simplification algo-rithm that takes into account the geometry only [Garland and Heckbert 1997].
• "Color-aware" simplification (SCol): mesh simplification algo-rithm that takes into account both geometry and color [Lee et al. 2012].
The strength of these distortions was adjusted manually in order to span the whole range of visual quality from imperceptible levels to high levels of impairment. For this task, a large set of distortions was generated and viewed by the authors, and a sub-set of them spanning the desired visual quality (i.e. “Excellent,” “Good,” “Fair,” and “Poor”) was chosen to be included in the database (as in [Guo et al. 2016; Seshadrinathan et al. 2010]). Thus, we generated 80 dis-torted models (5 reference models×4 distortion types × 4 strengths). Figure 2 illustrates some visual examples.
3.2.2 Rendering parameters. In designing our subjective experi-ment, we had to choose whether we select static or dynamic scenes. In fact, deciding the way the 3D models are displayed to the ob-servers is a crucial problem. No standardized procedures exist for subjective evalution of the quality of 3D objects and current studies show a lack of generalization in the methodology that should be used [Corsini et al. 2007; Guo et al. 2016; Rogowitz and Rushmeier 2001]. Rogowitz et al. [Rogowitz and Rushmeier 2001] proved that the perceived degradation of still images may not be adequate to evaluate the perceived degradation of the equivalent 3D model. Indeed, still images may mask both artifacts and the effect of light and shading. Following this approach, Corsini et al.[Corsini et al. 2007] allowed the subject to interact with the model by rotating and zooming it. While it is important for the observer to have access to different viewpoints of the 3D object, the problem of allowing free interaction is the cognitive overload which may alter the results. Hence, we decided to control the interaction between the subject and the stimulus displayed on the scene. So, based on the principle
of pseudo-videos and as in Guo et al. [Guo et al. 2016], we used ani-mations. For each object in our database, we selected the viewpoint that covers most of the shape. We then applied a slow rotation of 15 degrees around the vertical axis in clockwise and then in counterclockwise directions (i.e. total rotation of 30 degrees). These dynamic stimuli are shown in the scene at a viewing distance fixed to 3 meters from the observer. Their size is approximately 36.87 degrees of visual angle. They are visualized in a neutral room (light gray walls) under a directional light (all the vertices are illuminated as if the light is always from the same direction. It simulates the sun). We aimed to design a neutral room so that the experimental environment does not influence the users (quality-) perception of the stimulus. The default color calibration of the HTC Vive Pro was used.
3.2.3 Experimental procedure. The goal of this experiment is to evaluate the impact of the test methodologies (ACR-HR, DSIS) on the user quality assessment. For this purpose, we divided our ex-periment into 2 sessions, one for each methodology i.e. one session consisted of presenting the stimuli using ACR-HR and the other session presented them using DSIS. In addition, in order to study whether a methodology has an influence over the other and if the order of the methodologies matters, we divided the subjects into 2 groups (G1 and G2). G1 refers to the participants who completed the ACR-HR test before DSIS and G2 refers to those who passed the DSIS session first then the ACR-HR session. None of these sessions took place on the same day in order to reduce the learning effect between stimuli. Thus, these two sessions occurred at least two days apart. In each session, the stimuli were displayed in a random order (3D models, distortions types and levels all mixed) to each observer. Each stimulus (for ACR-HR) or pair of stimuli (for DSIS) was presented once; the observer was not able to replay/review the objects.
Rating interface. We opted to ensure in our test a user experience and quality of experience (QoE) in fully immersive virtual environ-ment (VE). So, we integrated a rating billboard in the VE of our
We selected a training 3D model not included in our original test set: "Dancing Drummer" (see Figure 2) and generated 11 distorted models that span the whole range of distortions. At the beginning of each session, the training models are shown in the same manner (single or pairwise) and with the same time (6s or 10s) adopted in the upcoming session. After each stimulus, the rating panel, with the corresponding scale, is displayed for 5s. The score attrib-uted/assigned to this distortion is highlighted. We added a practice trials stage at the end of the training: we displayed 2 extra stimuli and asked the subject to rate the quality or the impairment, accord-ing to the session. The results of these stimuli were not recorded. This stage was used to allow the observer to familiarize with the ex-perimentation, to focus appropriately and to ensure that observers fully understand the task of the experiment.
Duration. No session took longer than 30 minutes to avoid fa-tigue and boredom: the total time was 18 minutes for the ACR-HR session (informed consent/instructions + 11 training stimuli × (6s display + 5s Rating) + 85 Test stimuli × (6s display + ≈4s rating)) and 23 minutes for DSIS session (informed consent/instructions + 11 training stimuli × (10s display + 5s Rating) + 80 Test stimuli × (10s display + ≈4s rating)).
The whole experience was developed in Unity3D using c# script-ing. Snapshots of the experimental environment are provided in the supplementary material.
3.2.4 Participants. As mentioned in the previous section, the stim-uli were rated by 30 subjects divided into 2 groups of 15. The par-ticipants were students and professionals at the University of Lyon and LIRIS laboratory. 27 males and 3 females, aged between 19 and 45, they were naive about the purpose of the experiments. All observers had a normal or corrected to normal vision. In order to avoid the effect of the temporal sequencing factor, the order of stimuli was randomly generated so that each participant views the stimuli in a different order.
4
RESULTS AND ANALYSIS
The following sections analyze and discuss the results of our exper-iment. The purpose is to compare the two methodologies ACR-HR and DSIS and to determine which method is the best to assess the quality of 3D graphic models.
4.1
Screening observers
Before starting any analysis, participants were screened using the ITU-R-BT-500.11 recommendation [BT.500-13 2012]. Applying this procedure on our data, we did not find any outlier participant from
they like or dislike the object). Therefore, assessing differences in quality allows to take into account this variability in the use of the rating scale:
dij= siref(j)−sij (1) sijrefers to the score assigned by observeri to the stimulus j. ref(j) is the reference of stimulusj. The difference scores for the reference stimuli (diref(j)= 0) are removed from the collected data in the ACR-HR session for/of both groups G1 and G2. Finally, we computed the Difference Mean Opinion Score (DMOS) of each stimulus for both groups: DMOSj =N1 N Õ i=1 dij (2)
N denotes the remaining subjects after screening observers i.e, N =15 for G1 and N =14 for G2.
For DSIS, we don’t need to compute the DMOS since DSIS is based on the comparison between the reference and test models. Hence, we can directly use the rating results and compute the MOS.
MOSj =N1 N Õ i=1 sij (3)
4.3
Resulting MOS/DMOS
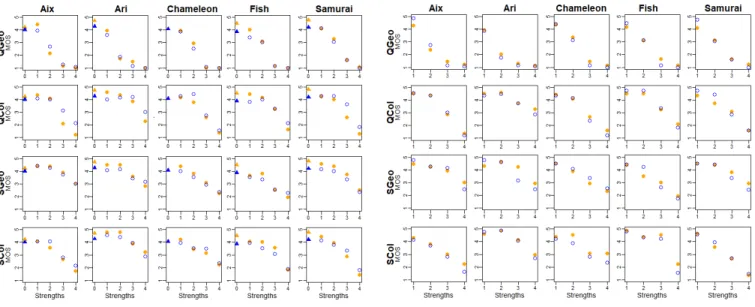
Figure 3 shows the results of ACR-HR and DSIS tests for all stimuli, averaged over all screened observers. For a better readability in the interpretation of results, we show the MOS (instead of the DMOS) for ACR-HR. Note that DMOS are used in the statistical tests presented in section 4.4. A comparison of the G1’s and G2’s DMOS and confidence intervals of the computed DMOS/MOS are provided in the supplementary material.
As expected the MOS decrease as the distortion strengths in-crease. For the DSIS method (Figure 3.b), we can notice a strong consistency between the two groups and a good use of the entire rating scale. Indeed the observers of both groups showed almost the same behavior for each stimulus and the rating scores reach the scale limits.
For the ACR-HR method (Figure 3.a), we can notice some dif-ferences between the rating scores of the two groups. In fact, ob-servers of G1 tend to downrate the reference stimuli, i.e. the rating scores given by G2 observers to almost all the references, except the Chameleon, exceed those of G1 observers. As a consequence, the amplitude of the rating scale is reduced. The specificity of the Chameleon model will be discussed in the next subsection. More-over, we note that G2 observers were able to detect some distortions
SAP ’19, September 19–20, 2019, Barcelona, Spain Nehmé, et al.
(a) ACR-HR sessions (b) DSIS sessions
Figure 3: Comparison of the G1’s and G2’s mean scores of the ACR-HR and DSIS experiments for all stimulus (the blue and orange dots refer to the MOS of G1 and G2 respectively).
that G1 observers missed, notably the color distortions: e.g. QCol distortion with high strength (strengths ≥ 3) for Aix, Ari and Samu-rai (row 2 col 1,2,5) obtained better scores in G1 than in G2.
These first results reveal several differences in the performance and behavior of the methodologies. In the next section, we assess whether these differences are statistically significant and we at-tempt to provide explanations for their causes.
4.4
Quantitative analysis
In this section, we analyze and compare quantitatively the results of both methodologies. In particular, we evaluate if the orders of the ACR/DSIS sessions have an impact on their results and why, and we demonstrate which methodology provides the most accurate results.
4.4.1 Normality and dependency analysis / preliminary tests. The statistical analysis is affected by the dependencies between the samples. In our experiment, two groups of observers (G1 and G2) rated the same stimuli. The only difference for the two groups was the order of the ACR-HR/DSIS sessions. We aimed to test whether there are differences in scores between the two groups so we could evaluate whether a methodology has an influence over the other. Hence, for the analysis, the raw rating scores are independent and thus we could have used unpaired two-sample t-tests. However before using a parametric test, it is important to make sure that the data follow a normal distribution. We applied several normality tests, on the rating scores; such as Shapiro-Wilk’s test, Lilliefors’s test, Anderson-Darling’s test. All these tests ascertained that the distribution of our data is not-normal (p-value ≪ 0.05). Hence, for our data analysis, we have opted for the unpaired two-samples Wilcoxon test (also known as Wilcoxon rank-sum test or Mann-Whitney test). It is a non-parametric alternative to the unpaired
two-samples t-test.
4.4.2 Consistency across the groups. To assess whether, for a given methodology, there are significant differences in rating scores be-tween the two groups of observers, we conducted for each stimulus the unpaired two-samples Wilcoxon test on the scoressijд (for DSIS) or the differential scoresdijд(for ACR-HR) of the 2 groups. The null hypothesis (H0) is that, for a given stimulus, the rating scores of the G1’s observers are equal to those of the G2’s observers at the 95% confidence level. The alternative hypothesis (H1) is that the scores of G1 are greater (or lesser) than the scores of G2. The p-values are presented in Figure 4. The red boxes (p-value<0.05) in-dicate that the corresponding stimuli have been rated significantly different by the two groups of subjects.
Figure 4: p-values computed between the rating scores of the two groups for all stimuli of both methodologies (the red color indicates a significant difference between the scores of G1 and G2).
For the ACR-HR method, we noticed that the scores of the two groups are not consistent (i.e. differ significantly) for 12 stimuli, out of 80; especially for the LAB quantization of all the models excluding the Chameleon. This is coherent with the results observed in section 4.3. Our hypothesis is that this is due to the absence of explicit references. Indeed for G1’s observers, as they did the ACR-HR test first, the assessment was absolute. Thus, it was difficult for them to detect the distortions of some models especially the color impairments, notably for Samurai and Ari (10 red boxes out of 12). The reason is that, for statues like Ari and Samurai, they have no
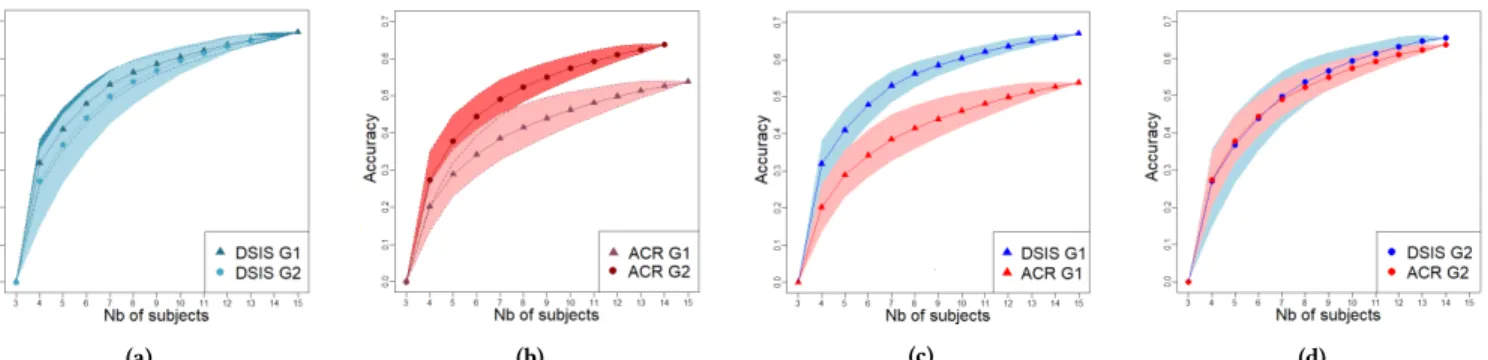
did the ACR-HR session 1stfollowed by the DSIS session, while G2’s subjects did the DSIS session 1st and then the ACR-HR session). The accuracy (y-axis) is defined as the percentage of pairs of stimuli whose qualities were assessed as statistically different. Curves represent mean values of these percentages and areas around curves represent 2.5th - 97.5th percentiles. prior knowledge of the exact color of the model. This is not the case
for G2’s observers since they had already seen the references during the DSIS session. Hence, they were able to detect the distortions (even the color distortions) that G1 observers might miss. For the Chameleon, there is no significant difference between the 2 groups. We believe that this is related to the fact that people have strong prior knowledge about this model: the chameleon/Iguana is an animal known worldwide and everyone has an idea of its shape, color and geometry characteristics.
We observe, for certain models, a better consistency/agreement among the subjects of the two groups, for the DSIS method. This confirms the fact that the presence of the reference makes the DSIS methodology more consistent across the groups and independent of the sessions order. The absence of reference in the ACR-HR method makes it difficult for observers to asses certain distortions, especially when they do not have prior knowledge about the models. This result is inconsistent with comparative studies conducted with images and videos, includ-ing omnidirectional videos [Sinclud-ingla et al. 2018], in which M-ACR was slightly more reliable than DSIS. This is because people have more prior knowledge about the quality of (natural) images/videos than 3D graphics, and therefore, the presence of references is not necessary to assess the quality of these data.
4.4.3 Accuracy of the quality scores. As stated by Mantiuk et al. [Mantiuk et al. 2012]: « A more accurate method should reduce ran-domness in answers, making the pair of compared conditions more distinctive. A more accurate method should result in more pairs of images whose quality can be said to be different under a statistical test. ». To assess the accuracy of the methodologies, we thus computed the number of pairs of stimuli rated significantly different by G1 and G2 subjects. For this task, we conducted unpaired two-samples Wilcoxon tests between rating scores of each possible pairs of stim-uli. We conducted 80 x 79/2 = 3160 tests. Theα levels used here is 0.05.
In order to study the behavior of this accuracy according to the number of subjects, we made these tests for different numbers of subjects and assessed the evolution of the number of pairs of stimuli significantly different. For each number N of subjects, we considered all possible combinations (without repetition) (with 3 ≤ N ≤ 15 for G1 and 3 ≤ N ≤ 14 for G2) and averaged the number of pairs significantly different over all these combinations
of observers. Results are shown in Figure 5. The numbers of pairs in y-axis are given in percentages of the total number (i.e., 3160).
From Figure 5.a, it can be noticed that, for the DSIS method, the accuracy do not evolve much from G1 to G2. Hence, double stimulus methodology seems, once again, stable and independent of the sessions order. However, this is not the case of the ACR-HR method since the accuracy undergoes a large increase for G2 compared to G1 (Figure 5.b). This demonstrates anew that the method without explicit reference is not consistent across the groups. G2’s subjects –who completed the ACR-HR test in the 2ndsession- were more familiar with the stimuli than G1’s subjects since they had already seen the models and their references in the 1stsession (the DSIS test). Therefore, they are capable of distinguishing/detecting the degradations/loss in the visual quality of the stimuli more easily than the G1’s observers. Beyond this better consistency observed for DSIS, Figures 5.c and 5.d clearly show that the DSIS method is more accurate than the ACR-HR method. This is valid even for G2, in which ACR-HR was conducted after DSIS.
In Figure 6, we determined the number of subjects required in both methodologies to obtain the same accuracy.
Figure 6: Number of observers required to obtain the same accuracy with ACR-HR and DSIS methods.
As can be seen in the figure, ACR-HR requires almost twice as many subjects as DSIS for G1. For instance, for a given number
SAP ’19, September 19–20, 2019, Barcelona, Spain Nehmé, et al.
(a) G1 (b) G2 (c) ACR-HR
G1 vs G2
Figure 7: Width of confidence intervals (CI) for both ACR-HR (red curves) and DSIS (blue curves) methodologies as a function of the number of observers involved in both groups (G1’s subjects did the ACR-HR session 1st followed by the DSIS session, while G2’s subjects did the DSIS session 1st and then the ACR-HR session). For (c), the turquoise and violet curves refer to CI of G1 and G2 respectively.
of observers unfamiliar with the test stimuli, ACR-HR requires minimum 14 observers to get a discrimination with an overall level of 53% while DSIS requires only 7 observers.
4.4.4 Confidence intervals. Another way to evaluate the accuracy of the methodologies is to compute the 95% confidence intervals of the obtained MOS/DMOS. We thus computed these 95% confi-dence intervals (CI) for both groups and methodologies, in order to determine the "true" mean score (i.e. the interval in which the MOS/DMOS will reside if we have an ∞ number of observers) [BT.500-13 2012]. We evaluated the evolution of the width of these intervals for both methodologies according to the number of sub-jects.
The curves of Figure 7 were obtained by averaging the width of CI over all the possible combinations of subjects. Note that for a given reference model and type of distortion, we average the widths of the CI over the four strengths of the distortion. We can observe that width of CI increases as the sample size decreases. For G1 (see Figure 7.a), we notice that, for most stimuli, the CI of the ACR-HR experiment are much larger than the CI given by the DSIS experiment, implying a strong dispersion of the ACR-HR scores across the G1’s subjects. This disagreement is due to the fact that the references of the models are unknown for G1’s subjects. This disagreement is not so apparent for G2 where the widths of CI given by the ACR-HR method are closer to the CI of the DSIS method (see Figure 7.b). These results confirm that DSIS is more accurate than ACR-HR, regardless the group. We illustrate, in the supplementary material, that there is almost no difference between the CI of G1 and G2 involved in DSIS, while the CI of G1’s ACR-HR test are always superior to those of G2, except color quantization distortions of the Chameleon. Figure 7.c illustrates the confidence intervals of the Chameleon. As explained in section 4.4.2, the strong
prior knowledge of observers on the color of this animal increases their accuracy, even without the presence of the explicit reference.
4.5
Recommended number of observers for the
DSIS methodology
As previously demonstrated, DSIS is more stable and more accu-rate than ACR-HR method. In this section we attempt to make recommendations about the required number of observers for this methodology. For this purpose, we aggregate the DSIS test’s scores of the 2 groups (G1 and G2) and thus obtain 30 subjects. This aggre-gation is possible since we demonstrated in previous subsections that DSIS scores are consistent among the two groups. We then re-compute the accuracy (as in section 4.4.3) according to the number of observers. The accuracy being defined as the percentage of pairs of stimuli statistically distinguishable by their rating scores.
From Figure 8, we observe that at least 20 test subjects are re-quired to be able to discriminate 70% of all possible pairs of stimuli. With 15 observers, the recommended number by the ITU, we obtain an accuracy of 66%. However, with 25 subjects the discrimination increases to 73% and reaches 75% with 30 subjects. As a conclusion, and with regard to the shape of the curve, 24 subjects seem to be a good compromise.
5
CONCLUSION
In this study, we designed a psycho-visual experiment that com-pares two of the most prominent subjective methodologies, with and without explicit reference (ACR-HR and DSIS). We compare these methods for the quality assessment of 3D graphics in a VR environment. Results assert that DSIS is consistent among the two groups of subjects (stable performance). It is also more accurate than the ACR-HR method and thus requires less subjects. In fact,
Figure 8: Accuracy of the DSIS method according to the num-ber of subjects.
in ACR-HR, the assessment is absolute (absence of explicit refer-ences) and therefore observers, who had never seen the reference models before, are not able to detect all the distortions, especially the color impairments. Thus, they tend to be less discriminating than those who are familiar with the test stimuli. These conclusions are not consistent with recent comparative studies conducted with images and videos. This is due to the fact that people have less prior knowledge of 3D graphic quality than of (natural) images.
This study makes the first step toward standardizing a methodol-ogy for assessing the quality of 3D graphics. In our future work, we will compare DSIS with both paired-comparison (PC) and SAMVIQ methods. Furthermore, we will work towards evaluating the impact of the display devices (2D screen, VR/MR headset) on the perceived quality of 3D graphics.
ACKNOWLEDGMENTS
This work was supported by French National Research Agency as part of ANR-PISCo project (ANR-17-CE33-0005).
REFERENCES
Kjell Brunnström and Marcus Barkowsky. 2018. Statistical quality of experience analysis: On planning the sample size and statistical significance testing. Journal of Electronic Imaging 27, 1. https://doi.org/10.1117/1.JEI.27.5.053013
ITU-R BT.500-13. 2012. Methodology for the subjective assessment of the quality of television pictures BT Series Broadcasting service. International Telecommunication Union.
Massimiliano Corsini, Elisa Drelie Gelasca, Touradj Ebrahimi, and Mauro Barni. 2007. Watermarked 3-D mesh quality assessment. IEEE Transactions on Multimedia 9, 247–256.
Luis A. da Silva Cruz, Emil Dumic, Evangelos Alexiou, Joao Prazeres, Rafael Duarte, Manuela Pereira, Antonio Pinheiro, and Touradj Ebrahimi. 2019. Point cloud quality evaluation : Towards a definition for test conditions. International Conference on Quality of Multimedia Experience, 6. http://infoscience.epfl.ch/record/264995 Michael Garland and Paul S. Heckbert. 1997. Surface simplification using quadric error
metrics. In ACM Siggraph. 209–216.
Jinjiang Guo, Vincent Vidal, Irene Cheng, Anup Basu, Atilla Baskurt, and Guillaume Lavoue. 2016. Subjective and Objective Visual Quality Assessment of Textured 3D Meshes. ACM Transactions on Applied Perception 14, 1–20. https://doi.org/10.1145/ 2996296
Quan Huynh-Thua and Martlesham Heath. 2007. Examination of the SAMVIQ method-ology for the subjective assessment of multimedia quality. Third Inter. Workshop on Video Processing and Quality Metrics for Consumer Electronics.
Joseph J. LaViola. 2000. A discussion of cybersickness in virtual environments. ACM SIGCHI Bulletin 32, 47–56. https://doi.org/10.1145/333329.333344
applications. International Telecommunication Union.
Yixin Pan, I Cheng, and A Basu. 2005. Quality metric for approximating subjective evaluation of 3-D objects. IEEE Transactions on Multimedia 7, 2, 269–279. https: //doi.org/10.1109/TMM.2005.843364
Rafal Piórkowski, Radoslaw Mantiuk, and Adam Siekawa. 2017. Automatic Detection of Game Engine Artifacts Using Full Reference Image Quality Metrics. ACM Transactions on Applied Perception 14, 3, Article 14, 17 pages. https://doi.org/10. 1145/3047407
Georg Regal, Raimund Schatz, Johann Schrammel, and Stefan Suette. 2018. VRate: A Unity3D Asset for integrating Subjective Assessment Questionnaires in Virtual Environments. In 10th International Conference on Quality of Multimedia Experience, QoMEX 2018. 1–3. https://doi.org/10.1109/QoMEX.2018.8463296
Bernice E Rogowitz and Holly E Rushmeier. 2001. Are image quality metrics adequate to evaluate the quality of geometric objects?, In Photonics West 2001-Electronic Imaging. Proc SPIE. https://doi.org/10.1117/12.429504
Kalpana Seshadrinathan, Rajiv Soundararajan, Alan Conrad Bovik, and Lawrence K. Cormack. 2010. Study of subjective and objective quality assessment of video. IEEE Transactions on Image Processing 19, 1427–41. https://doi.org/10.1109/TIP.2010. 2042111
Ashutosh Singla, Werner Robitza, and Alexander Raake. 2018. Comparison of Sub-jective Quality Evaluation Methods for Omnidirectional Videos with DSIS and Modified ACR. Electronic Imaging 2018, 14. https://doi.org/10.2352/ISSN.2470-1173. 2018.14.HVEI-525
Stéphane Péchard, Romuald Pépion, Patrick Le Callet. 2008. Suitable methodology in subjective video quality assessment: a resolution dependent paradigm. International Workshop on Image Media Quality and its Applications, IMQA2008.
Andre M. van Dijk, Jean-Bernard Martens, and Andrew B. Watson. 1995. Quality asessment of coded images using numerical category scaling, Vol. 2451. Proceedings of SPIE, 90–101. https://doi.org/10.1117/12.201231
K. Vanhoey, B. Sauvage, P. Kraemer, and G. Lavoué. 2017. Visual quality assessment of 3D models: On the influence of light-material interaction. ACM Transactions on Applied Perception 15, 1.
VQEG. 2007. Multimedia Test Plan 1.19.
B Watson, A Friedman, and A McGaffey. 2001. Measuring and predicting visual fidelity. In Proc. of SIGGRAPH 2001. ACM, 213–220. https://doi.org/10.1145/383259.383283 Krzysztof Wolski, Daniele Giunchi, Nanyang Ye, Piotr Didyk, Karol Myszkowski, Radoslaw Mantiuk, Hans-Peter Seidel, Anthony Steed, and Rafal Mantiuk. 2018. Dataset and Metrics for Predicting Local Visible Differences. ACM Transactions on Graphics 37, 1–14. https://doi.org/10.1145/3196493