HAL Id: hal-01077552
https://hal.archives-ouvertes.fr/hal-01077552
Submitted on 27 Oct 2014
HAL is a multi-disciplinary open access
archive for the deposit and dissemination of
sci-entific research documents, whether they are
pub-lished or not. The documents may come from
teaching and research institutions in France or
abroad, or from public or private research centers.
L’archive ouverte pluridisciplinaire HAL, est
destinée au dépôt et à la diffusion de documents
scientifiques de niveau recherche, publiés ou non,
émanant des établissements d’enseignement et de
recherche français ou étrangers, des laboratoires
publics ou privés.
Mamadou Tourad Diallo, Frédéric Fieau, Emad Abd-Elrahmane, Hossam Afifi
To cite this version:
Mamadou Tourad Diallo, Frédéric Fieau, Emad Abd-Elrahmane, Hossam Afifi. Utility-based
Ap-proach for Video Service Delivery Optimization. ICSNC 2014: International Conference on Systems
and Network Communication, 2014, pp.5-10. �hal-01077552�
Utility-based Approach for Video Service Delivery Optimization
Mamadou Tourad Diallo, Frédéric Fieau Emad Abd-Elrahman Hossam Afifi
Orange Labs National Telecommunication InstituteInstitut Mines-Telecom
Audiovisual Network Delivery Computer & Systems Depatement Departement RST Issy les moulineaux, France Cairo, Egypt Saclay, France {mamadoutourad.diallo,frederic.fieau}@orange.com emad.abd_elrahman@telecom-sudparis.eu hossam.afifi@telecom-sudparis.euAbstract—This work aims to introduce an Utility-based
approach for Video Service Delivery Optimization (U-VSDO). Through this optimization, a global utility function is calculated based on different constraints. Those constraints are considered based on separate utility function for each actor in the video service delivery chain (Content Provider (CP), Operator (OP) and Client (CL)). However, each actor has a global score for his vision, the overall optimization aims to satisfy the three actors. Our proposed methodology for this optimization is validated through different types of evaluation. First, a simulation based utility function is done for obtaining the optimal values of our optimization problem. Then, a complete GUI (Graphical User Interface) interface is built based on the main parameters for each actor. Finally, a test-bed is conducted to differentiate between two types of flows using open source Software Defined Network (SDN) controller. This part considered the standard use case for ETSI (European Telecommunications Standards Interface) in CDN (Content Delivery Network) as a Service.
Keywords- CDN optimization; video service delivery; utility function, quality QoS/QoE.
I. INTRODUCTION
New video service delivery strategies face two challenges: pricing plan for the overall chain elements and the innovation for new added services. Many operators are struggling to maintain the Average Revenue per User (ARPU) and margins in revenues despite the high competition in market. They are searching for new optimizations that can achieve the balance between the main three actors in the chain (content providers, operators and consumers). But, the massive deployment of Over-The-Top (OTT) technology [1] is really representing a big threat for managed video services. Moreover, new opportunities brought by clients need to be studied in order to build a good utility between users needs and service requirements. Therefore, searching optimization algorithms and tools for managed video delivery networks is required.
The traditional Content Delivery Networks (CDNs) are not defined mainly for data centers virtualization but for data caching and services acceleration. Akamai is one of the most famous CDN multi providers over Internet as it handles almost 30% of global Internet traffic all over the world [2]. Hereinafter, we will explain the main challenges in video data centers in general and conduct a subjective comparison between the main actors in video service delivery.
A. Video Data Centers Issues
Online video uses a very large amount of storage in data centers and bandwidth (BW) over the Internet. In USA only, almost 50% of Internet BW is consumed by online videos [3]. Globally, one of the main issues in data centers is the movement of contents. We tried in a previous work to study the issue of content movement and video file optimization in terms of access cost from user perspective [4]. While, in another work, we focused on the QoE aspects and their effects on data retrieval or caching costs [5], the overall control performance especially in video services is still insufficient due to the main bottlenecks in data centers interconnections. Moreover, the more famous data centers over Internet proposed by Amazon [6] or Google [7] are suffering from the same problem of bottlenecks as reported in [3]. So, until the cloud solutions bring an improvement, there are still some drawbacks in content movements either within single data centers or between data centers. So, there are high incentives to search an optimized solution for big data movements and its optimization. New trends consider the Software defined network (SDN) solutions as a movement tool and enabler.
B. Comparison for the Three Actors
It is important to analyze the main actors in video service delivery chain. Then, we can describe the objectives of each actor in order to introduce his utility and the overall work motivations. Here, two comparisons are mandatory in order to build our utilities and have clear problem statements as follows:
1) Agility Comparison
The Agility is defined as the number of parameters and the ability of adaptation for the proposed system dynamically. So, the flexibility of service planning either for content adaptation or server placement is considered as an important factor in any video streaming chain. Thus, either for live streaming or VoD (Video on Demand), the easy adaptation and simple configuration of networks will enhance the overall system performance and users satisfactions at same time. Moreover, the correlation between the three actors in the video chain will lead to an optimal identification for both network capacities and users densities. Table I compares the Agility of the three actors effects in terms of some major attributes as follows:
TABLE I. AGILITY COMPARISON FOR THE THREE ACTORS Attribute Content
Provider Operator Client
Video Coding
The number of layers that can be available for each
content like DASH layers or HLS for mobile
users
The carrier has to support different tunnels of traffic and with different rates of playing videos The client application capacity for accommodating different coding layers and buffers required Line Speeds Cost consumptions for high speed deployment lines to contents hosting Fast adaptations and scalable networks for highly on demand services Line speed constrains either for fixed rates cost or on
demand bandwidth
Capacity Maximizing the throughputs
Minimizing the network load Maximizing the number of clients Quality QoS SLA/TCA between CP & OP for an efficient content delivery with min
and max thresholds of quality Quality of service measures for adaptive bit rates Participating in QoS/QoE reports for enhancing the overall service delivery Devices Hardware or Software consumed for contents virtualizations or services on demand Dynamic allocations for resources and network virtualization to cope with on demand servers caching or placements Device capabilities to fit with different access networks and with virtual applications 2) Cost Comparison
Table II gives an overall cost comparison from each actor view as follows:
TABLE II. COST COMPARISON FOR THE THREE ACTORS Attribute Content
Provider Operator Client CAPEX
cost
Min cost for content adaptations
Min transmission cost
for each content
Min cost for required bandwidth
line
OPEX
cost
Hosting servers for different layers of
same content
Running cost for QoS SLA/TCA between CP & OP Running cost for additional Bandwidth
Based on the previous two proposed comparisons and main issues in service delivery, we can formulate our problem statements as follows:
C. Problem Statement
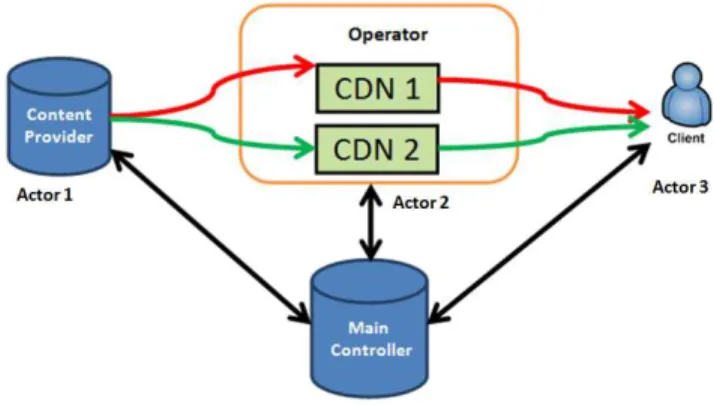
We propose a global optimization utility function for each one of the three actors in the video chain. As shown in Figure 1, the three actors in the chain are in collaboration for the best service delivery. Actor 1, the content provider asks
Actor 2 (the operator) to deliver some video content requested by the third Actor 3 (client). We assume that the system is real time so requests can be handled through some controller unit that manages sessions and handover decisions between CDNs based on our optimization function.
Figure 1. Main three actors in the video chain
The rest of this paper is organized as follows: Section II highlights the relevant work to this optimization and presents the different categories in video service delivery optimization. Then, Section III introduces our proposed methodology based on the new utilities constrains. The evaluation for our proposal is conducted in Section IV. Finally, this research is concluded with some future directions in Section V.
II. RELATED WORK
We can divide contributions for optimizing video delivery into three main methods: i) the network-centric
approach, in which decisions are made at the network side
(mainly by network operators), ii) the user-centric approach making the decision based on the user's benefit, and iii) the
context-centric approach, where the switching decision is
made by considering different context information. i) The network-centric:
In this approach, decisions are made by the operators and they are principally based on their benefits.
Sylvia et al. [8] propose a distributed strategy to get network topology information, and use Internet Control Message Protocol (ICMP) ping method to measure Round-Trip Time (RTT), in order to switch to a network which has the lowest RTT. Xueying et al. [9] work on the load balancing algorithm which automatically selects network candidate based on local resource conditions. The main advantage of this method is the network resources optimization. But these techniques do not consider content provider expectations and users Quality of Experience (QoE).
ii) The user-centric:
Network switching is made in order to satisfy user’s
benefits, without considering network load and content provider expectations. Ksentini et al. [10] consider Quality of
Experience measurements over different access types. After predicting a Mean Opinion Score (MOS) with Pseudo Subjective Quality Assessment (PSQA), a vertical handover (change in access network) is carried out towards the network offering the best MOS. It can be noticed that the user-centric approach has the main drawback from a load balancing perspective, since users generally consider only their own benefits while making decisions and letting the Operator and Content Provider benefits.
iii) The context-centric approach:
In this approach, the delivery decision optimization is made by considering different contexts (Content Provider, Operator, and Client). Bogdan et al. [11] propose an algorithm, called Smooth Adaptive Soft-Handover Algorithm (SASHA). Its goal is to improve the user perceived quality while roaming through heterogeneous wireless network environments. The score of each connection is evaluated based on a comprehensive Quality of Multimedia Streaming (QMS) including the following metrics: QoS (Quality of Service), QoE (Quality of Experience), Cost, Power efficiency and user preferences. The idea is to adapt delivery in the network that has the best (QMS) score. The disadvantage is the no consideration of content provider expectations in the adaptation process.
Suciu et al. [12] propose Hierarchical and Distributed Handover (HDHO) method, a distributed handover decision framework which takes into account the objective of Content Provider by considering the content requirements in terms of resources, Operator in terms of network load and user preferences by considering cost sensibility. Even if, this proposal takes into account the aim of each actor on the delivery chain, some relevant parameters are omitted. In content provider side the cost of transmitting the content in a network is missed, in network side the cost and hardware status are absent, in client side the perceived quality of experience is not taken into account.
In order to maximize a perceived quality of experience in
users’ side, respect conditions of content providers and the operators’ benefits, we need to define a new video delivery
optimization which takes into account the objective of each actor. Moreover, in such a dynamic environment composed by different devices with different characteristics, variables network conditions with different cost/load and content providers with different expectations, we propose the U-VSDO algorithm that handles all those parameters as explained in the next section.
III. PROPOSED METHODOLOGY
The purpose of this section is to explain the steps of the optimization approach which takes into account the objective of Content Provider (CP), Operator (OP) and the User. Our approach is based on the definition of three entities, each with their goals as follows:
The objective of Content Provider is to send the
Content in the network with a minimum cost and still manage the Content expectations in terms of
requirements (for example the minimum required throughput for the content).
The objective of the Operator is to transmit content on
its network (CDN1 or CDN2 in our example) while keeping the load as lower as possible.
The objective of the client is to improve the Quality of
Experience besides the QoS.
The Utility-based Video Service Delivery Optimization (U-VSDO) will take into account the goals of each actor in addition to the main constrains. As shown in Figure 1, the optimization decision will be managed by the Main Controller after solving the optimization problem. This controller can be for example an SDN controller as will be explained in Section IV for SDN Network Function Virtualization NFV [13]. So, we can solve the problem by the following steps:
A. Problem Formulation
We used the utility functions to calculate the scores of each actor; this is very useful to characterize the satisfaction derived from a parameter.
The function must have the following characteristics:
The function increases with parameter x and has
a maximum of 1,
When x is “low”, the function tends to zero. The possibility to have normalized results
between [0, 1].
Several functions meet these criteria. Moreover, we decided to use the utility function: (1- ), as the work in [12] [14], where x is a parameter of the function. In future work, we will further investigate the influence of others utility functions in our optimization problem.
Hereinafter, we introduce the details of each actor utility function based on the previous propositions either for utility type or normalization way. Then, a global score utility will be calculated under the main constrains defined for each actor as follows.
As the work in [12], we have two types of parameters:
The positives parameters: High values are
better, example (throughput, available hardware, etc.), then for an utility function we took the parameter directly.
The negatives parameters: Low parameters are
better, example (cost, network load, etc., then for these parameters we choose
for example.
For Content Provider:
= (1 - + 1 - ) . Ds (1) = (2 - - ) . Ds (1) where:
o , is the score related to Content Provider (CP) for flow j in network i.
o = UNIT cost per Mbyte, is the cost of transmitting the content in the network (CDN1 or CDN2) in our example).
o = ( (j), ) = 0, when < , = 0.
o is the maximum cost that the content provider is ready to pay.
o , is the available throughput.
o Ds = ( , =0, when <
o is the required video throughput.
Note that: ( means that; when < B then ( ,B) =0 and 1 otherwise.
For Operator:
= (3 ).NLs.Cops.Hs (2) where:
o , is the score related to Operator in network i.
o ; is the cost from the operator
side.
o is the network load.
o NLs= , NL (i)) =0, when < NL
o is the maximum acceptable network load.
o Cops= ( ,Cop(i))=0, when < Cop
o is the maximum price that the operator is ready to invest.
o H is the required hardware threshold. o Hs= (H(i), i)) = 0, when
o is the minimum required hardware for considered service.
For Client :
= (3) where:
o ) corresponds to the satisfaction obtained by users in network i for flow j. It is a parametric model which computes the Quality of Experience function of contexts information (environment) [15], the model takes into account parameters such as the device type, the video content type and the quality of the network link in order to predict the Quality of Experience. The analytical function is called and is presented in the equation below:
= (4)
o A, B and C: are the model parameters calculated by
using subjective test data from different experiments.
o , is the maximum value of which correspond to the normalized factor
So, the general optimization problem can be formulated as follows by total score:
=α * + β * + * (5)
where are the weights of entities in the global
optimization and =1
The weighting parameters define the importance of each actor in the optimization decision. In our work we decided that the Content Provider, the Operator and Users have the same weight, then: =
B. Optimization Problem Constraints
In this section, we summarize the main utility functions for the computed scores and their constraints that will be implemented in the next section and appeared in the GUI interface as follows: 2 = 3 Client : Objective: maximize ( ) Subject to : < < Dr < Dref NL< < H
IV. IMPLEMENTATION AND EVALUATION
To validate our work, we propose two ways. First, we are going to optimize the utility function parameters through a simulation tools using Matlab. Then, the decision output of this optimization will take the form of graphical interface for doing many scenarios. Second, we will do a testbed for decision making based software defined network (SDN) solution to differentiate between CDNs caching. This solution conforms to the ETSI solution use case 8 for virtual CDN-as-a-service [13].
A. Validation Based Simulation
The validation based simulation has been conducted based on some real test captured from last championship Roland Garros (RG) [16]. Roland Garros is a major tennis tournament held over two weeks between late May and early
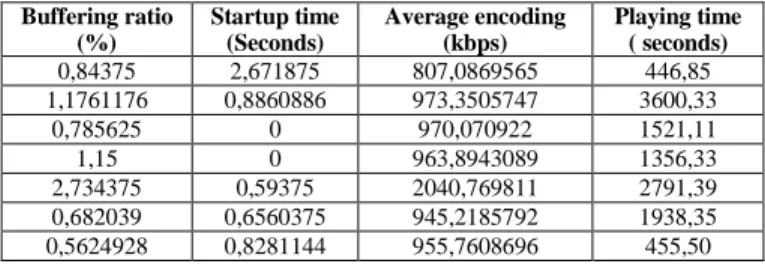
June 2013 at the Stade Roland Garros in Paris, France. Some analysis has been proposed in our previous work [17]. In this work, we studied and analyzed users engagement during this event based on some real time measures done based on the Orange platform. Then, we will extend the study and the analysis to conform to the three actors in video. Samples from the RG tests are shown in the following Table III. Parameters such as buffering time, startup time and playing time are considered.
TABLE III. SAMPLES FROM ROLAND GARROS MEASURES Buffering ratio (%) Startup time (Seconds) Average encoding (kbps) Playing time ( seconds) 0,84375 2,671875 807,0869565 446,85 1,1761176 0,8860886 973,3505747 3600,33 0,785625 0 970,070922 1521,11 1,15 0 963,8943089 1356,33 2,734375 0,59375 2040,769811 2791,39 0,682039 0,6560375 945,2185792 1938,35 0,5624928 0,8281144 955,7608696 455,50
We implemented a complete Graphical Tool (GT) to be used by the operators in their networks design and optimization. This graphical tool is built based on Matlab code.
Figure 2 illustrates the main construction steps as divided into two parts:
Creating general parameters: which means defining
the basic topology elements and factors in the three actors (CP, OP and CL) i.e. the main profiles for each video and CDN.
Calculating results: Calculating the general score
for all actors and show the selected CDN as best path for video profile.
Actually, we simulate the global utility function and calculate the scores for different networks for our approach U-VSDO. Moreover, and in order to facilitate the decision making output by each operator running our methodology, we developed a GUI interface to cope with the three utility functions for the three actors main parameters as shown in Figure 2.
Figure 2. GUI interface for U-VSDO approach
After finishing this simulation, we conducted a brief comparison between our approach U-VSDO and other similar techniques that used utility functions for decision making based multimedia handover like SASHA [11] and HDHO [12]. The results indicated in Table IV highlighted the main parameters considered as supplementary by our approach U-VSDO over other ways.
TABLE IV. COMPARISON BETWEEN U-VSDO TO OTHER APPROACHES SASHA HDHO U-VSDO
OP cost x x √ CP cost √ √ √ Content Type x x √ Device Type x x √ Client Type x x √ Network Load √ √ √ H/W Status x x √
Finally, Figure 3 represents the correlation between this work and our previous work [17] for different types of media tested under our approach. Figure 3 handled different types of videos (News, Sport, Music and Animation) in terms of which CDN can achieve high scores in order to satisfy user engagement and all actors’ satisfactions for our methodology.
Figure 3. User score for different types of media to different CDNs
B. Validation Based Testbed
In this part, we try to validate our approach using software defined network controller through the SDN implementations based testbed. The testbed architecture is shown in Figure 4. We simulate the traffic source as video on demand servers by VOD1 & VOD2 (using VLC Servers for same contents but on different format: one Standard Definition (SD) and the other High Definition (HD)) and the client will also use a VLC client.
Figure 4. Proposed testbed architecture
The experiment for simulating SDN controller is done using Mininet open source package [18]. Using this package, we can build a complete architecture of virtual topology (including VM clients, VM servers, Virtual Open switch and the session controller based an OpenFlow [19]).
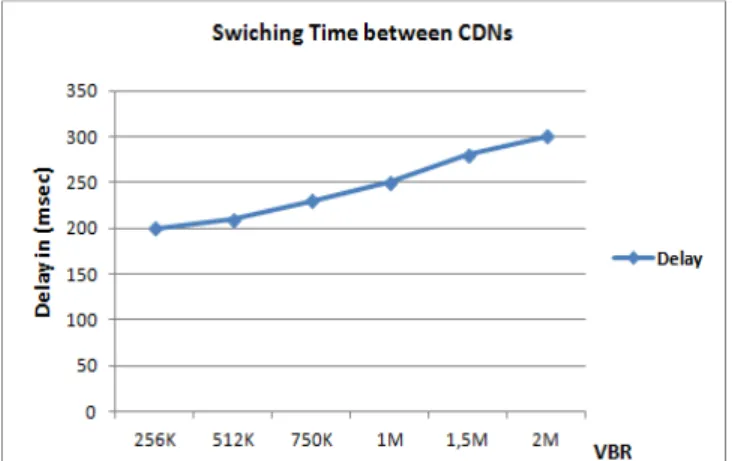
As SDN offers Networking-as-a-Service (NaaS) and Network Function-as-a-Service (NFaaS), the main objective is to measure the performance in case of obtaining the contents from VOD1 (SD) and due to the QoE index; the session will be transferred to VOD2 (HD) for same contents. Also, we can see that this is a type of session based hijacking using SDN controller. The response time for sessions hijacking is calculated for different types of video bit rates as shown in Figure 5. As shown in this figure, the switching time is acceptable for different types of videos and is conform with the ITU recommendations for quality of streaming.
Figure 5. The response time for sessions hijacking against VBR (video bit rate) as measured during the experiment.
V. CONCLUSION
An optimization mechanism is presented and evaluated. It solves the utility function optimization for the three common actors in video streaming chain (CP, OP and CL) for any data centers, including their roles and objectives in video chain. The proposed methodology U-VSDO is evaluated by two ways. First, through a simulation for global
utility function and our approach gave good results compared to other methods like HDHO or SASHA in terms of value added parameters in decision making. Secondly, a testbed is evaluated to validate the CDN-as-a-Service controlled by an SDN controller and the consumed time for sessions hijacking is measured for different video bitrates.
In the next work directions, we will consider the real-time video service optimization based on adaptive technique suitable for the real-time nature.
REFERENCES [1] Over The Top ( OTT) :
http://www.pace.com/Documents/Investors/Presentations/100 609_TechnologyBriefing.pdf, last visit: May 2014.
[2] Akamai: http://www.akamai.com/ , last visit : May 2014.
[3] Fierce online video Report:
http://www.fierceonlinevideo.com/special-reports/moving- big-data-video-transport-providers-keep-sporting-events-hollywood-pa#ixzz2nBe1xrds: December 11, 2013.
[4] Abd-Elrahman E. and Afifi H., “Optimization of File Allocation for Video Sharing Servers”, NTMS 3rd IEEE International Conference on New Technologies, Mobility and Security (NTMS),Cairo-Egypt , 20-23, pp.1-5, Dec. 2009.
[5] Abd-Elrahman E., Rekik T., and Afifi H., ‘‘Optimization of Quality of Experience through File Duplication in Video
Sharing Servers”, EuroITV2012, UP-TO-US workshop,
Germany: July 2012. pp.286-291
[6] Amazon Web Services: http://aws.amazon.com/, last visit: July 2014.
[7] Google: http://www.google.com, last visit: Augest 2014. [8] Sylvia R., Marc H., Richard Maning K., and Scott S.,
“Topologically-Aware Overlay Construction and Server Selection” INFOCOM 2002, pp. 1190-1199.
[9] Xueying J., Shiyao L., and Yang Y., “Research of Load Balance Algorithm Based on Resource Status for Streaming Media Transmission Network” CECNet, 2013,pp.503-507
[10] Ksentini A., Viho C., and Bonnin JM., “QoE-aware Vertical
Handover in Wireless Heterogeneous Networks”, IEEE, 2011,
pp.95-100.
[11] Bogdan C. and Gabriel M., “A Quality-Oriented Handover Algorithm for Multimedia Content Delivery to Mobile Users” Broadcasting IEEE Transactions on, pp. 437-450
[12] Suciu LL. and Guillouard K., “A Hierarchical and Distributed Handover Management Approach for Heterogeneous Networking Environments”, ICNS 2007, vol., no, pp.77,77, 19-25 June 2007.
[13] ETSI GS NFV 001 v1.1.1 ,“Network Functions Virtualization
NFV; Use Cases”, October 2013.
[14] Penhoat J., Guillouard K., Lemlouma T., and Mikaël S.,
“Analysis of the Implementation of Utility Functions to
Define an Optimal Partition of a Multicast Group”, ICN 2011, The Tenth International Conference on Networks. 2011.
[15] Diallo M.T., Marechal N., and Afifi H., “A Hybrid Contextual User Perception Model for Streamed Video Quality Assessment”, Multimedia (ISM), 2013 IEEE International Symposium on , vol., no., pp.518,519, 9-11 Dec. 2013.
[16] Roland Garros: http://www.rolandgarros.com/, last visit: February 2014.
[17] Diallo M.T., Fieau F., and Hennequin J.B., “Impacts of Video
Quality of Experience on User Engagement in a Live Event”
ICME EMSA 2014.
[18] Mininet: http://mininet.org/, last visit: January 2014.