HAL Id: hal-01728612
https://hal.archives-ouvertes.fr/hal-01728612
Submitted on 11 Mar 2018HAL is a multi-disciplinary open access archive for the deposit and dissemination of sci-entific research documents, whether they are pub-lished or not. The documents may come from teaching and research institutions in France or abroad, or from public or private research centers.
L’archive ouverte pluridisciplinaire HAL, est destinée au dépôt et à la diffusion de documents scientifiques de niveau recherche, publiés ou non, émanant des établissements d’enseignement et de recherche français ou étrangers, des laboratoires publics ou privés.
Modélisation dynamique du parcours du patient à l’aide
de l’approche Workflow : le cas du Service des Urgences
Pédiatrique du CHR de Lille-France
Faten Ajmi, Lotfi Gammoudi, Ouadi Elyes, Hayfa Zgaya, Slim Hammadi,
Jean-Marie Renard
To cite this version:
Faten Ajmi, Lotfi Gammoudi, Ouadi Elyes, Hayfa Zgaya, Slim Hammadi, et al.. Modélisation dy-namique du parcours du patient à l’aide de l’approche Workflow : le cas du Service des Urgences Pédiatrique du CHR de Lille-France. GISEH 2014 - Conférence Francophone Gestion et Ingénierie des Systèmes Hospitaliers, 2014, Liège, Belgique. �hal-01728612�
Patient Journey Dynamic Modeling Using Workflow Approach: A
case study of the Paediatric Emergency Department of CHR in Lille
Faten Ajmi (a), Lotfi Gammoudi(a), Ouadi Elyes(a),
Hayfa Zgaya(b), Slim Hammadi(a), Jean-Marie Renard(b)
(a) LAGIS UMR CNRS 8219 Ecole Centrale de Lille – France
{Faten.ajmi, lotfi.gammoudi, ouadi.elyes, slim.hammadi}@ec-lille.fr
(b) EA2694 University Lille 2 - France {hayfa.zgaya, jean-marie.renard}@univ-lille2.fr
Abstract: By using Workflow Methodology and BPM Software (Bonitasoft), the aim of this paper is twofold. Our
aim is, first, to modelling the patient journey in the paediatric department of a hospital to deal with the incoming flow of patient. Secondly, we will use the model to simulate the patient journey with the different options used by the medical staff of the department, and test the efficiency of the current system with a patient charge. Thereby, with the anonymous data base received from the hospital, we would assess the reliability of our simulation and the validity our modelling. Based on these simulations, we were able to find out the main causes of the patient waiting time and to show in which parts of the system the waiting time is the greatest.
Key words : Workflow Methodology, Healthcare system engineering, patient charge, indicators of tensions, paedriatric emergency department.
Modélisation dynamique du parcours du patient à l’aide de
l’approche Workflow : le cas du Service des Urgences Pédiatrique
du CHR de Lille-France
Résumé:En utilisant l’approche Workflow et un logiciel BPM Open Source(Bonitasoft), le but de cet article est double. Notre objectif est, d'abord, de modéliser le parcours du patient dans le service d’urgence pédiatrique d'un hôpital pour traiter le flux entrant de patient. Deuxièmement, utiliser le modèle obtenu pour simuler le parcours du patient selon différentes options et de tester l'efficacité du système actuel de prise en charge des patients. Ainsi, à partir des données anonymes fournis par le service d’urgence pédiatrique, nous avons pu tester la fiabilité de notre simulation et évaluer la validité du modèle. Sur la base de ces simulations, nous avons été en mesure d’identifier quelques facteurs explicatifs de la durée d'attente des patients. Les mêmes résultats nous ont permis aussi de montrer dans quelles parties du système le temps d'attente est le plus grand.
Mots clés: Workflow, Ingénierie du Système de Santé, prise en charge des patients, indicateurs de tension,
2
Introduction:
IN France, as in many countries of Europe, the emergency departments present the same difficulties whose reasons are multiple. These difficulties are not only linked to the health organization but also to the evolution of the western civilization [Reix, 2002]. The requirements concerning health care evolved in relation with a new approach to management of the time. Today, people require a fast and efficient handling. They reject the ageing, the illness and the death [Chodosas, 2002]. The arrival patient flow to the emergency department keeps increasing. This rise has generated a strategic interest in optimizing the technical and human resources while mastering the costs. In order to reach these objectives, the health establishments have resorted to the tools and techniques of management borrowed from the industry domain as the Workflow tool that will be used in this article.
The use of Workflow methodology showed applicability and the interest of the company modelling method to reorganize a health establishment. It allowed improving the performance of different service and activities conduct system.
The Discrete Event Simulation (DES) techniques have been used a lot for modeling the operations of an Emergency Department (ED). The model was developed to test alternative ED attending physician-staffing schedules and to analyse the corresponding impacts on patient throughput and resource utilization [Rossetti et al. 1999], to help the ED managers understand the behavior of the system with regard to the hidden causes of excessive waiting times [Ryby et al. 2003], to analyse patient flows and throughput time [Samaha et al. 2003] [Mahapatra et al. 2003; Takakuwa et Shiozaki, 2004; Baesler et al. 2003]. DES has also been used for estimating future capacities of new ED facilities or expansions [Wiinamaki et Dronzek, 2003; Rossetti et al. 1999].
The main objectives of the present paper are:
To model the PED using Workflow Methodology for better understanding the patient flow process through the PED,
To simulate using the same tool Workflow in order to identify and analysis the dysfunctions of the PED and also to propose and to estimate prevention indicators of tensions.
This article is structured into five sections. The first present the context of the study and the notion of “Emergency Path”. The objectives and a workflow methodology in the field of health will be presented in the section two. In the third section, we will show that the PED is a complex system in interaction. Also, we will explain Workflow modelling at the PED of the CHR of Lille. In the fourth section, the simulation model and some experiments and results. Finally in section five we will draw the conclusions to this work.
1. Context of the study
1.1 Paediatric emergency department of the CHR of Lille
Paediatric emergency department of the CHR of Lille is a department composed of a permanent team of 11 members. The department has a relatively small size and represents a support of other paediatric departments in Lille conurbation. Its size is big enough to treat the daily arrivals of patient in 80 % of cases. This can create up to a four-hour waiting time. Therefore we must think about the way to reduce this time in busy periods. Such
3
high times are caused by rushes of patient who are coming in the service in the same time period. These rushes jam the emergencies and make it difficult for the staff to be reactive. Consequently, the load of patient in the system must be more efficiently managed to reduce saturations in the system.
So we firstly modelled the operation process of the department to notice critical points of its organization during busy periods then we modelled the behaviour of a team in these busy periods to identify methods increasing the efficiency of the department. Each journey is obviously different, but our purpose was to create a wide variety of journey while limiting the number of elements in courses regularly carried out by the medical staff. To define the busy periods we split a year in periods. For each period, we selected the 95% of the day to define the main trend of the period. We didn’t take into account the 2.5% of the lowest and the 2.5% of the highest charges of patients to make our trend because they were exceptional. Then, we made the average of the number of patients who arrived for every hours of each period. Busy periods are those with the highest averages.
1.2. Emergency Path (PED):
Emergency Path is a longitudinal organization of the patient's handling. It is not a structure but an operative concept. The patient flow can vary from patient to patient based on acuity level and diagnosis [Rossetti et al. 1999].The patients handling takes place according to different fashions linked to the necessary care types:
Cares programmed, requiring an hospitalization or no (ambulatory) Cares non programmed, in situation of emergency or no.
The hospital establishments are chronically confronted to a problematic for which no satisfying answer exists at the present time. This problematic is resulting from the permanent interferences between the programmed and the non-programmed activity, and more especially the urgent non programmed activity.
We can define two operational concepts that will intervene in the description of the PED:
The incoming flows: programmed or non-programmed, with almost periodic or uncertain variation, The retiring flows: constituting the downstream of the PED.
The emergency path, the incoming and the retiring flows are three concepts that describe the PED like a complex system in interaction. We proceeded to the modelization of the survey project at the PED of the CHR of Lille. The phases of Workflow of the PED modelizationare:
Description of the features of each element of the global process and its sub-processes in the PED, Modelling the PED (flow and resources organization) and its interactions with the other internal
components of the CHR of Lille,
To define a typology of the patients admitted in the PED of the CHR of Lille.
2. Workflow Modelling of the CHR of Lille :
The main objective of our survey is to identify the dysfunctions of the PED and also to propose and to estimate prevention indicators of tensions. To reach this objective, it is necessary to have a global Workflow model of the PED and its environment. Before optimizing and simulation of the PED, it is necessary to analyse and to characterize the PED structure. It requires the use of Workflow methodology to represent the functional and process view of the PED and its related parts.
2.1. The PED of the CHR of Lille
4
The recurrent flows are able to present some seasonal variations, but known on average on middle horizons (i.e. month or year). Even, if these flows are feared, quantified in volume and in nature on medium and short term, the setting up of a structure, an organization and a piloting is a major stake of efficiency of the care production.
The flows following upon the sanitary crises (flow, heat waves, cold weather waves). In this case, the flows are completely unforeseen in volume and in nature.
The adaptation and the implementation of organization, scheduling, management and optimization approved methods are foreseeable for the programmed patients flows handling , but it is a lot more complex to master the emergency flows handlings. The problem is not simple because today the emergencies are considered by the actors of the health system themselves as main entropy generator of the cares system.
2.2. Workflow methodology
To model the health system, a lot of company modelling methods has been used. The company modelling is the representation of the enterprise in terms of strategy, structure, functionalities, behaviour, organization, evolution and relations with the environment. One of these methods is the Workflow methodology. It has been used for modelling, diagnosis and conception of a hospital system [Souf et al. 1999]. This work permitted to demonstrate applicability and the interest of the company modelling methods to reorganize a health establishment.
The objective of the development and description of the workflow model is to assess the overall processing capabilities of the flow in order to support various joint activities between medical staff that is temporally and spatially dispersed. Control of the workflow for the purpose of optimizing the placement of limited medical resources, both personnel and equipment, on the medical scene is an important issue. Since typical unforeseen circumstances will frequently occur in the PED environment, there is a need for an effective model, capable of dynamic control in workflow descriptions, for medical treatment. Thus, for descriptions of the workflow in this paper, we have used the BPMN standard graphical language, which is easy for users to express and is readily comprehensible [[Duguay et Chetouane, 2007].
3. The paediatric department and the patient journey
3.1. The paediatric department
The paediatric emergency department of the university hospital of Lille has a surface of 450m² in the CHR of Lille. Two same departments are in Lille area: one of them is in the hospital Saint-Vincent and the other is in the hospital Centre of Tourcoing. Thus, the department of the university hospital of Lille remains modest in entries per year.
The service has a reception area surrounded by 10 consultation rooms with one or two beds, there are also a suture and a cast room that can be used as consultation rooms in busy periods. A LTER is also available (Life-Threatening Emergency Room). It is used for the most serious cases and therefore it needs to be quickly ready to host patients who are at risk. A waiting room is in the corridor. The service is also helped by downstream structures in the CHR, hosts the other fields of the paediatric service which represent near 170 beds. Moreover, there are three surgery blocks which are focused on heart, brain surgery and trauma.
5
3.2. The patient’s journey
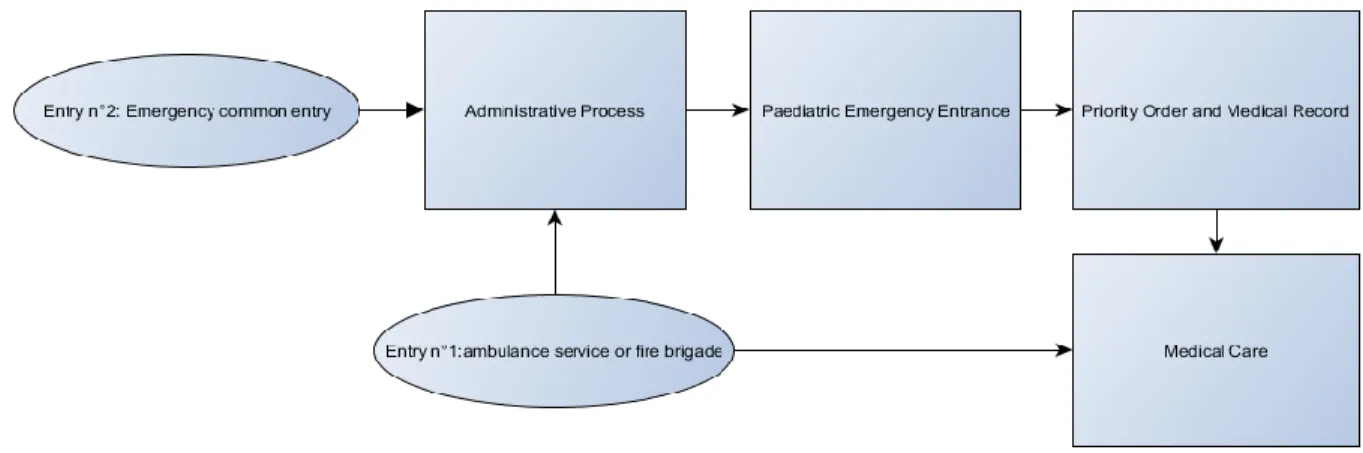
If the life of the patient is not at risk, he is received by an administrative agent who types required information for the management of the hospital. Then, he comes in the service, there, he meets registered nurse or a nurse aide, who creates the medical record of the patient and establish a priority order for the patient. This order mainly relies on a five point scale called « ccmu scale » in order to treat the worst cases as quickly as possible. Then, the patient goes to one of the specified care room of the hospital. However it is possible that the cares are delayed by a waiting time which depends on the service’s congestion and the gravity of the cases. The constants are then taken by a home nurse who adds the qualification « medical » or « surgical » to the file according to the aim of the consultation. The file is completed as soon as possible or immediately if the patient’s condition needs it. A doctor is called if a medical examination is required.
If the patient comes with the Emergency Ambulance Service or the Fire Brigade, the service treats the patient without being seen by the home nurse. Administrative process will be done in parallel or after the examinations. This process is summarized in the diagram below:
Figure 1:Patient Journey Mapping
According to the medical diagnostic the patient’s condition and the available infrastructures, the doctor can choose to let the patient go home or to keep him in observation or to hospitalize him. During the observation duration, the patient spends his stay almost always in the short-period hospitalization area of the service because of the lack of beds which are continuously monitored in the CHR of Lille. Moreover, there is not a centralized alarm in the system. If the patient has a longer stay (more than 12 hours, the maximal duration for a short-period hospitalization), the doctor often keeps the patient in the paediatric emergency service while waiting another host structure to get free.
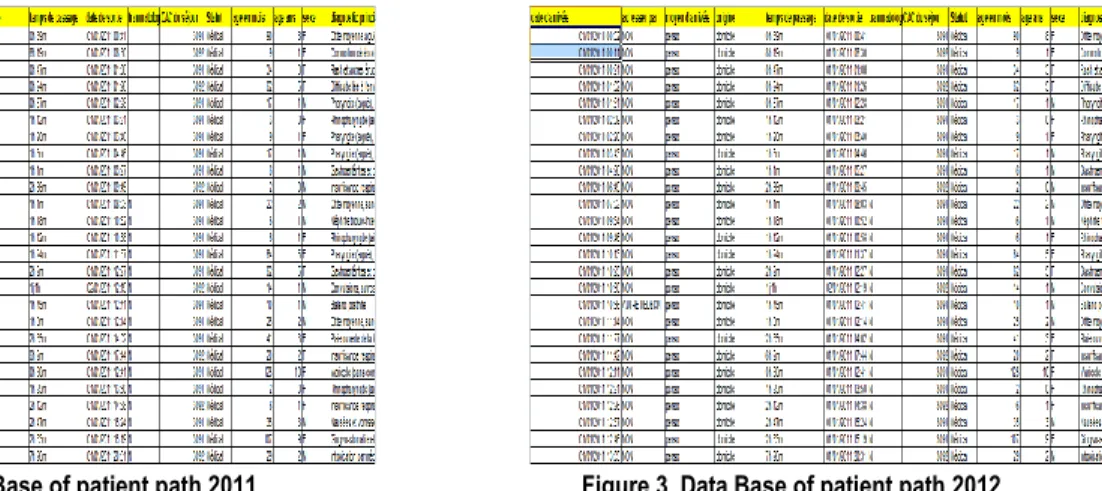
3.3. Data Base of patient’s journey
Data used in our study are presented in the figure below. They can be viewed by day, area of assignment, or by planning and resource type, the kind of output.
6
Figure 2 Data Base of patient path 2011 Figure 3 Data Base of patient path 2012
4. Simulations and results with open source Workflow & BPM software
4.1. The Normal Situation
a) The template of the normal situation
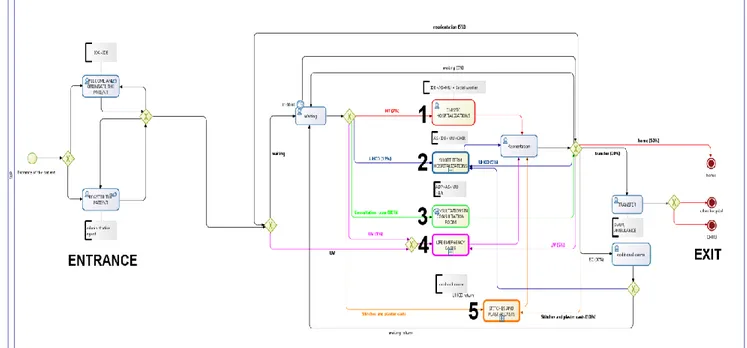
The template synthesizes the organization of the pediatrics department when it works normally. Therefore the template is quite simple because of the modest size of the department and the fact that patients take a « classic
itinerary» dedicated to the disease they are suffering from. Thus, all the patients that are coming for the same
usual disease like flu or gastro-enteritis will follow the same steps inside the hospital. After several visits at the hospital, we have highlighted five main care groups:
1. Classic hospitalizations where the patient is sent to another care department 2. Short term hospitalizations
3. Consultations in consultation rooms
4. Life emergency cases treated in the operating theatre 5. Stitches and plaster casts made in dedicated rooms
We used the Bonitasoft software program to establish a pattern of each action realized by the medical staff or the patient: those actions will be called “tasks”. There is two ways to define going from one task to another or the direction to take after a node (point where streams of patients coming from different tasks meet). We can define a direction with one the one hand conditions and on the other hand probabilities. By doing so, we affect the process and the itinerary, with different results for each method. This is why we mix both methods in our template. The conditions are required to make sure that a patient goes through a task. The probabilities are used when no condition can determine which task might be chosen.
7
Figure4:Workflow Model of PED in normal situation
We assigned each task to a quantity of resources (both human and material resources, such as beds) which are key factors for the simulation of the template.
b) Simulation on normal situation
We have to fill in several parameters in our Bonitasoft template to begin a simulation: the resources are essential for the realism and the reliability of the results. Each time a task is realized, it consumes these resources. If some resources are missing when the task is about to start, the model waits for them to be available again before the task is executed. We also need to define a flow of patients to run a simulation. By using the hospital’s database we were able to establish three classic situations: one for winter, one for summer and one for autumn. The differences between these profiles are the number of patients and the time at which they arrive at the pediatrics department.
The results are curves showing the minimum, the average and the maximum time of execution of each task present in the process and also the utilization rate of the resources. The waiting time is actually assessed in each task. Once the previous task is executed, the patient arrives in the next one and waits inside the time it needs to be executed. Thus, we know exactly to what extent each task contributed to the final waiting time. Our aim, by simulating permanent work, is to locate the crisis indicators and try to reduce the waiting time.
c) Results of the simulation on normal situation
We have simulated the pediatric emergency department’s work over a two-day period so that we can see the impact of the first day over the second one.
First test: we have used a light flow of patients that depicts the low level of activity of the pediatrics
department during summer. The results show an average waiting time of 30min to 2h30min, with a peak between 6pm and midnight.
8
Figure5:Average Waiting Time (SUMMER)
Second test: the flow of patients during the winter disturbs more the pediatrics department since the
average waiting time goes from 1h to 4h with a peak at midnight.
Figure6:Average Waiting Time (WINTER)
Third test: the flow of patients during a crisis situation highlights the limits of the emergency pediatrics
department since the average waiting time keeps increasing and reaches ten or so hours. The medical staff can’t deal at the same time with the patients already in the hospital and the ones arriving.
Figure7:Average Waiting Time (CRISIS)
4.2. The crowding situation
a) The template of the crowding situation
During peaks of activity, the emergency pediatrics department is overwhelmed since it is the main entrance for children, whatever their symptoms are. The waiting room is not wide enough, mothers pile up in tight halls of the department with their young children and their waiting time keeps increasing. The department swings into a new stage of operating, called the “crowding situation”, in order to make the stream of patients more fluid. From now on, the “room” or “bed” resources and even some human resources are not dedicated anymore for the execution of some tasks. For instance, a consultation that is usually carried out in a consultation room can now
9
be done in a stitch/plaster cast room if it is available. These new operating rules maximize the use of resources available in the emergency pediatrics department in order to reduce the waiting time while maintaining high quality of medical care.
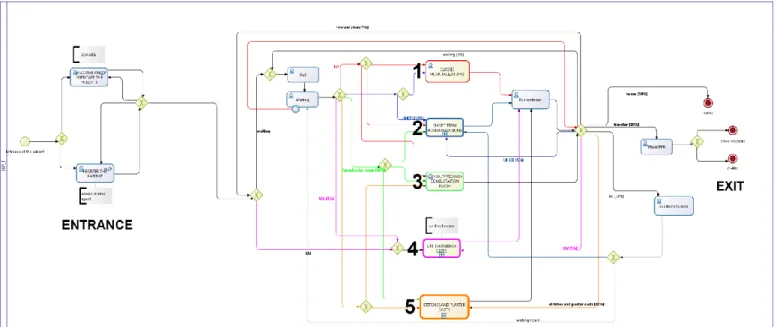
Figure 8: Workflow Model of PED in crowding situation
b) Simulation of the crowding situation
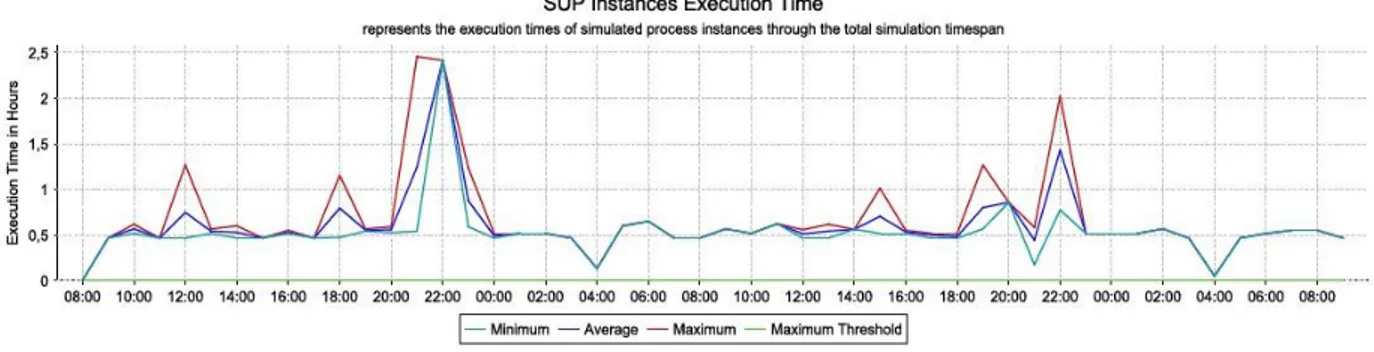
To be consistent with our scientific approach, we have used the same parameters for that simulation as for the previous one. The resources available and the classic streams of patients (summer, winter and crisis) are exactly the same. The crisis situation led to the following results for the execution time of the whole itinerary of a random patient, waiting time included:
Figure 9: Random itinerary of a patient and waiting time
The “maximum time” reveals crucial details. It represents the worst case that happened during the simulation and is reaches 4h30 spent in the emergency pediatrics department. Notice that these results are a little lower than those really estimated at the hospital. That is due to the limits of the simulation and particularly to the fact that data are discrete. That is why the results don’t exactly fit the reality.
Let’s focus on classic consultations that represent the majority of cases treated by the emergency pediatrics department: 78% for our template. These consultations are not the most urgent cases, quite the opposite. However, the waiting time comes mostly from this task, and the way chosen to run that section has a huge impact on the average waiting time of patients that go through the emergency pediatrics department.
10
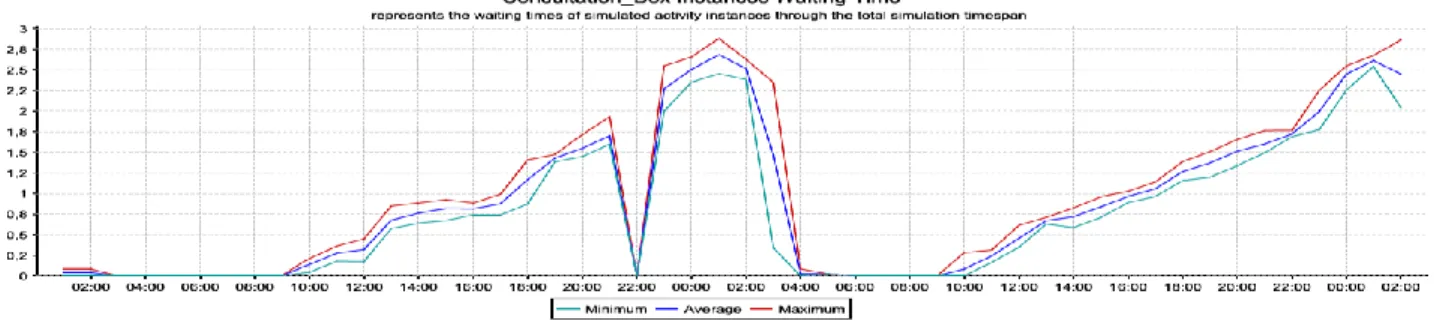
Concerning our simulation on crowding situation, classic consultations can be carried out in two different rooms: the consultations rooms and the stitch/plaster cast rooms. The following curve describes the occupation of these rooms:
Figure 10:Occupation of consulting room and waiting time
c) Results of the simulation on crowding situation
The result is consistent with our expectations since the waiting time keeps increasing from 9am and decrease suddenly around 2am. The rest of the night is calm (3am to 9am) and there is no waiting time. The pediatrics department starts the next day without any spare waiting time from the day before, which matches the reality. The main results of these simulations are summarized in the following table:
Normal situation Crowding situation
Summer Winter Crisis Summer Winter Crisis Average Waiting time in consultation 30min 1h 2h50 30min 50min 1h20
Nurse resources utilization 39% 61% 82% 35% 41% 62%
Average time spent in the hospital 50 min 3h20 6h 50min 3h10 2h Table1: Summary of simulations results
5. Conclusion
The major contribution of this research is that a method of integrating workflow systems and simulation transitory is developed, and its potential capability has been demonstrated through a prototype implementation. The approach enables us to analyze the performance of newly designed processes before actual execution. We built a template and defined the resources of the department and at the same time tried to come as close as possible to the actual situation. The parameters have been chosen to allow the transition between normal situation and crowding situation during peaks of activity. Despite our desire to reduce the waiting time as fast as possible, so as to allow the department to go back to normal situation, we have made sure that every rule applicable to an emergency department in France is respected. Eventually, the template assumes that every actor knows where he is supposed to go which is not always the case during peak time. To satisfy that criterion, the medical staff needs to be assisted by a software program that offers alternatives in real time. In the future, we aim to develop planning tools materials and medical personal in order to achieve optimal use of those resources. Also, we propose an alliance between Multi-Agent System MAS and Optimization.
11
References:
Baesler F. F., Jahnsen E. H. et Da Costa M. (2003). The use of simulation and design of experiments for estimating maximum capacity in an emergency room. In Proceedings of the Winter Simulation Conference, Chick, S., Sanchez, P., Ferrin, J. D. and Morrice, D. J. (eds), p.1903-1906.
Bricon-Souf, N. Renard J.M. et Beuscart, R. (1999). Dynamic Workflow Model for Complex Activity in intensive care unit. International journal of Medical Informatics, 53, 43-150.
Chodosas, M. (2002). Etude de l’organisation des différents systèmes d’urgence dans cinq pays européens : La France, l’Allemagne, l’Espagne, l’Italie et le Portugal. Thèse pour l’obtention du Diplôme d’Etat de docteur en Médecine. Faculté de Médecine Lariboisière-Saint-Louis, Université Paris VII, 217p.
Duguay, Ch. et Chetouane, F. (2007). Modeling and Improving Emergency Department Systems using Discrete Event Simulation. SIMULATION, Vol. 83, 4, 311-320.
Mahapatra S., Koelling, C. P., Patvivatsiri L., Fraticelli, B.E., et Grove L. (2003). Pairing emergency severity index5-level triage data with computer aided system design to improve emergency department access and throughput. In Proceedings of the Winter Simulation Conference, Chick, S., Sanchez, P., Ferrin, J. D. and Morrice, D. J. (eds), p.1917-1925.
Reix A. (2002). Etude de l’organisation des différents systèmes d’urgence dans six pays européens : La France, le Royaume Uni, la Belgique, la Suède, la Finlande et la Norvège. Thèse pour l’obtention du Diplôme d’Etat de docteur en Médecine. Faculté de Médecine Cochin Port Royal, University of Descartes, 190p.
Rossetti, M .D. Trzcinski, G.F. et Syverud, S.A. (1999). Emergency department simulation and determination of optimal attending physician staffing schedules. In Proceeding of the Winter Simulation Conference, P.A. Farrington, Nembhard H.B., Sturrock, D.T.and Evands, G.W. Eds, Vol. 2, pp. 1532-1540.
Ruby, B.E., Darrell, S.W., Wendy A.S. et Mary, H.C. (2003). Healthcare process analysis The use of simulation to evaluate hospital operations between the emergency department and a medical telemetry unit”, In WSC 03 proceedings of the Winter Simulation Conference, S.Chick, P. J. Sanchez, D. Ferrin, and D. J. Morrice (eds), pp.1887-1893.
Samaha S., Wendy, A. S. et Starks W. D. (2003). The use of simulation to reduce the length of stay in an emergency department. In Proceedings of the Winter Simulation Conference, Chick, S., Sanchez, P. , Ferrin, J. D. and Morrice, D. J. (eds), p.1907-1911.
Takakuwa, S. et Shiozaki, H. (2004). Functional analysis for operating emergency department of a general hospital. In Proceedings of the Winter Simulation Conference, Ingalls, R. G., Rossetti, M. D. , Smith, J. S. and Peters, B. A. (eds), p. 2003-2011.
Wiinamaki, A. et Dronzek, R. (2003). Using simulation in the architectural concept phase of an emergency department design. In Proceedings of the Winter Simulation Conference, Chick, S., Sanchez, P., Ferrin, J. D. and Morrice, D. J. (eds), p.1912-1916.