HAL Id: pastel-00705246
https://pastel.archives-ouvertes.fr/pastel-00705246
Submitted on 7 Jun 2012HAL is a multi-disciplinary open access archive for the deposit and dissemination of sci-entific research documents, whether they are pub-lished or not. The documents may come from teaching and research institutions in France or abroad, or from public or private research centers.
L’archive ouverte pluridisciplinaire HAL, est destinée au dépôt et à la diffusion de documents scientifiques de niveau recherche, publiés ou non, émanant des établissements d’enseignement et de recherche français ou étrangers, des laboratoires publics ou privés.
The self-organized criticality as an explanation of fatigue
failure for shape memory alloys
Clement Dunand-Chatellet
To cite this version:
Clement Dunand-Chatellet. The self-organized criticality as an explanation of fatigue failure for shape memory alloys. Materials Science [cond-mat.mtrl-sci]. Ecole Polytechnique X, 2012. English. �pastel-00705246�
École Polytechnique
Department of Mechanical Engineering
Thesis
submitted to École Polytechnique in fulfilment of the thesis requirement for the degree of Doctor Of Philosophy
by
Clément Dunand-Châtellet
The self-organized criticality as
an explanation of fatigue failure
for shape memory alloys
Thesis defended the 05/16/2012 face to the jury composed of:
Reviewers: Prof. André Chrysochoos Université de Montpellier Prof. Eduard Vives Universidad de Barcelona Examinators: Prof. Fernandino Aurrichio University of Pavia
Prof. Jean-Philippe Bouchaud École Polytechnique Prof. Jêrome Weiss Université de Grenoble
I would like to dedicate this thesis to my family, my friends and my loved wife Léa.
Acknowledgements
T
histhesis arose in part out of two years of research that has been done since I came to the Materials and Structures group. During this period I have been supported by a great number of kind people who contributed to the achievement of the present work. It is a pleasure to convey my gratitude to them all in my humble acknowledgement.In the first part I would like to record my gratitude to my supervisor Ziad Moumni who brought me to the extraordinary field of complexity. Above all the most needed, he provided me unflinching encouragement and support in various ways. His truly scientist intuition and enthusi-asm has made him as a constant oasis of ideas and passions in physics research, which inspire and enrich my growth as a PhD student. I am indebted to him more than he knows.
Many thanks also to Antoine Chaigne who enrolled me as a PhD stu-dent in their laboratory. I am grateful to their contribution in the success of the present research and hope the self-organized criticality activity to be a major part of the laboratory research fields.
It is a pleasure to pay tribute to Andreï Constantinescu, Stéphanie De-schanels, Lev Truskinovski as well as Jêrome Weiss who are at the origin of the idea of using SOC in fatigue analysis. Thank you very much to the Agence Nationale pour la Recherche for funding the present work.
I am very grateful to Prof. Eduardo Vives and Prof.André Chrysochoos for their constructive comments. I am thankful that in the midst of their activity, they accepted to be members of the reading committee. A special thank to them also for their excellent contributions in the trends of criti-cality research. Their papers gave me the knowledges necessary to write this thesis. Thank you again.
Many thanks go to Fernandino Aurrichio, Jean Philippe Bouchaud and Jêrome Weiss who accepted to be member of the thesis examiners. Warm acknowledgments are given to Jean Philippe Bouchaud who is undoubt-edly responsible for the success of this thesis, through the most exciting courses, I had the opportunity to listen, he gave about complex systems. He also contribute intensively to my growing interest in financial applica-tions of physical models through the fruitful discussions we got.
To the role model for hard workers in the lab, Lahcene Cherfa, I would like to thank him for being highly involved in the laboratory. I am proud
to record that I had several opportunities to work with an exceptionally experienced technician like him.
I would like to thank Corrine Rouby, Olivier Doaré, Anne-Lise Gloanec, Bertrand Reynier, Alain Van Herpen, Patrice Riberty and Régine Tanniere for their enthusiasm and their help during the two past years.
Collective and individual acknowledgements are also owed to my colleagues whose present somehow perpetually refreshed, helpful, and memorable. Many thanks go in particular to Abderrazak Traidia and Alexander Chidleyfor creating such a great friendship at the office, for their perpetual humour and helpful ideas. It is a pleasure to thank Mohammed and Xuefor their enthusiasm, friendship and the leaning they gave to me about their respective cultures.
I can not forget to thank Emmanuel Bacry who introduced to me Hawkes processes in the financial framework as well as Haissam Ismael who worked with me on this interesting topics. My acknowledgements are also addressed to people from the Statistical Arbitrage team of BNP Paribas, Stephane Tyc, Boris Leblanc and particularly Julien Nguyen who taught to me the necessary mathematics rigor required in coding activi-ties of financial applications. Sharing discussions with him about sciences was a real pleasure.
Last but not least, I am pleased and full of emotion to thank my parents Genevièveand Roger as well as my brother Julien and all my friends for their great support throughout my life. Finally, my warmer acknowledgments are going to my wife Léa who was always here to support me during this adventure.
Levallois Perret, June 7, 2012.
Contents
Contents vii
List of Figures ix
Layout 1
1 Introduction 3
1.1 The ANR project EvoCrit . . . 5
1.1.1 Scientific description of the project . . . 5
1.1.2 Role of partners. . . 5
1.2 Originality of the PhD subject . . . 6
1.2.1 Definition of the subject . . . 6
1.2.2 Previous studies on the same subject . . . 7
1.2.3 Highlight of the originality and universality of this approach 8 2 Bibliography 9 2.1 Shape Memory Alloys and Fatigue . . . 11
2.1.1 Shape Memory Alloys materials . . . 11
2.1.2 Fatigue of shape memory alloys . . . 13
2.2 Complexity and self organized criticality . . . 16
2.2.1 Introduction about complex systems . . . 16
2.2.2 Genesis of Self-Organized Criticality (SOC) . . . 17
2.2.3 Characterization of the SOC state . . . 18
2.2.4 "Rain is earthquakes in the sky" - Christensen . . . 20
2.2.5 Scenarios leading to SOC . . . 21
2.2.6 SOC and material sciences . . . 21
2.3 Conclusion . . . 25
3 Multi-scale characterization of the shakedown state 27 3.1 The shakedown state . . . 29
3.2 Experimental devices . . . 32
3.3 Acoustic, thermal and mechanical synchronized re-sponses . . . 33
3.4 Cross analysis . . . 41
3.5 Scientific improvements . . . 45
4 Fatigue failure & SOC 47 4.1 SOC, seismology and materials . . . 49
4.1.1 Long term organization of earthquakes and fatigue . . . 49
4.1.2 Experimental procedure . . . 51
4.2 From space to time through energy . . . 52
4.2.1 Modification of the shakedown stage . . . 52
4.2.2 Three dissipative regimes . . . 54
4.2.3 Mapping of failure . . . 56
4.3 Scale-free behaviors . . . 58
4.3.1 Distributions of energy, time and space-intervals . . . 58
4.3.2 Emerging patterns . . . 64
4.3.3 Driving rate dependence . . . 66
4.3.4 From fatigue failure to earthquakes . . . 71
4.4 Post-mortem visualization . . . 74
4.4.1 Thermal disappointment . . . 74
4.4.2 Post mortem microscopic photos . . . 75
4.5 Scientific improvements . . . 79
5 Travel across sciences 83 5.1 The potential of extreme behaviors. . . 85
5.1.1 2001-2011: An extreme decade . . . 85
5.1.2 "A state of shocked disbelief" - A. Greenspan . . . 87
5.2 The point process bridge . . . 91
5.2.1 Electronic markets and earthquakes similitudes . . . 91
5.2.2 Hawkes processes as a link . . . 93
5.2.3 Financial application of the Hawkes processes . . . 98
5.2.4 Application of Hawkes processes to the repeated loading of SMA . . . 103
5.3 Scientific improvements . . . 109
6 Conclusions and outlooks 111 6.1 Main results of the thesis . . . 113
6.2 Following topics of research and outlooks . . . 115
6.3 Personal learnings and feelings . . . 117
A Appendix 119 A.1 Publications and conferences . . . 121
A.1.1 Publications. . . 121
A.1.2 Conferences. . . 121
A.2 Acoustic emission monitoring . . . 122
A.2.1 Description of acoustic emission measurement . . . 122
A.2.2 Acoustic emission parameters . . . 124
A.3 Dive into the world of power-laws . . . 126
A.3.1 The 68/95/99 and 01/50 rules . . . 126
A.3.2 Definitions and properties . . . 130
A.3.3 Fitting of power-law distributions . . . 130
Bibliography 133
List of Figures
2.1 Appearance of the martensite plates under a thermally in-duced martensitic transition - ref: personal pictures . . . 13
2.2 Schematic representation of a pseudo-elastic loading . . . . 14
2.3 Three main variables of hysteresis loop . . . 15
2.4 Bridge constituted by ants which is one of the most famous natural example of complexity . . . 17
2.5 Pictures taken in experiments led on ricepile byFrette et al.
(1996) to study experimentally the sandpile model. . . 18
3.1 Cyclic stress strain curves . . . 34
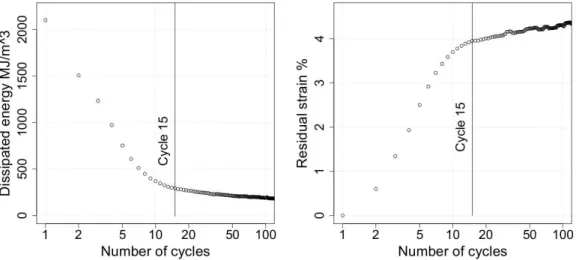
3.2 Dissipated energy (right) and cumulative residual strain (left) as a function of the number of cycles . . . 35
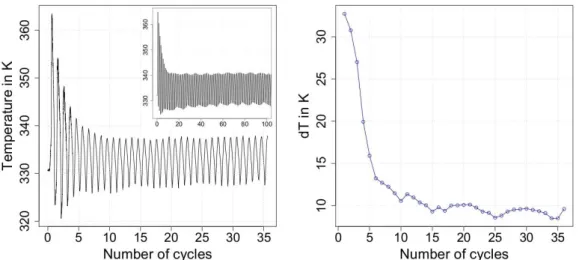
3.3 Evolution of the variation of temperature for a given loca-tion in the sample (left) and amplitude of the varialoca-tions of temperature per cycle (right) . . . 36
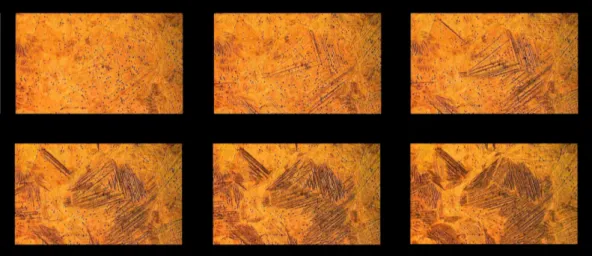
3.4 Visualization of the transformation bands . . . 36
3.5 Visualization of the disappearance of the transformation bands . . . 36
3.6 Space Time Temperature map . . . 37
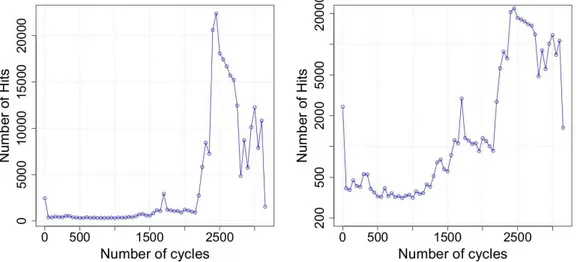
3.7 Acoustic cumulative energy as a function of time and num-ber of acoustic waves . . . 37
3.8 Counter-cumulative distributions of energy and time intervals 39
3.9 Values of XE
min and XdTminas a function of the number of cycles 39
3.10 Values of ǫ and λ as a function of the number of cycles . . . 40
3.11 Values of τ and ω as a function of the number of cycles . . 40
3.12 Nucleation of a branch . . . 42
3.13 Stress-strain curve of the first cycle zoom at the bend and AE 43
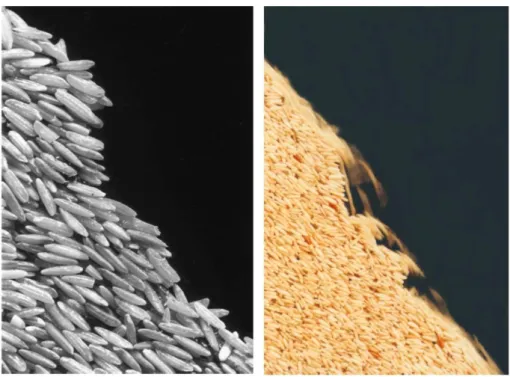
3.14 Micrography of a NiTi sample at a strain of 0.7% . . . 44
4.1 Acoustic parameters used for the nine experiments . . . 52
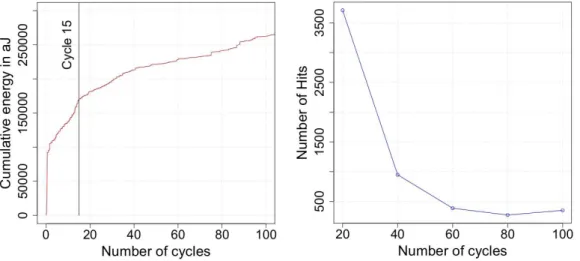
4.2 Cumulative energy as a function of the number of cycles . . 52
4.3 Cumulative energy (left) and instantaneous release of en-ergy (right) between cycles 1 and 500 . . . 53
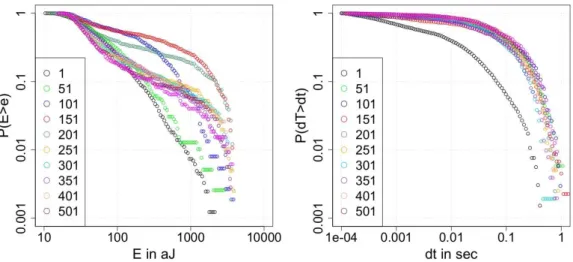
4.4 Distributions of energies (left) and time intervals (right) for 50cycles periods from cycle 1 to 501 . . . 54
4.5 Zoomed shots of the instantaneous release of energy for P1, P2, and P3 . . . 55
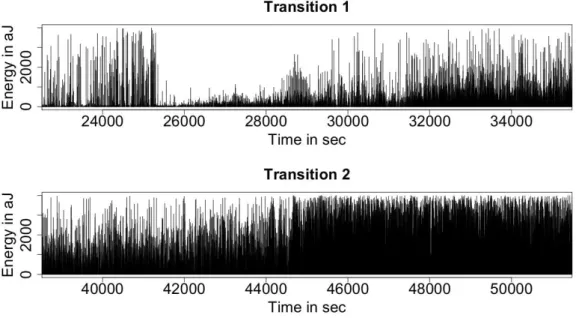
4.6 Instantaneous release of energy during the transitions be-tween P1/P2 and P2/P3 . . . 55
4.7 Number of generated waves for 50 cycles periods plotted in regular and semi-logarithmic axis . . . 56
4.8 Space-Time map of events . . . 57
4.9 Space-Time map of events with low threshold . . . 57
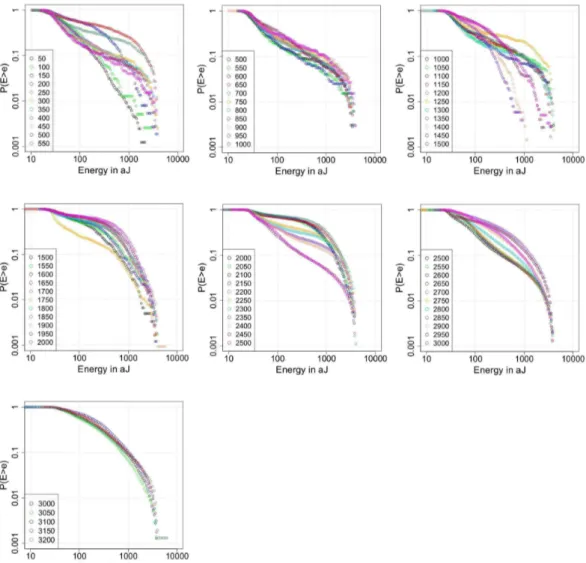
4.10 Distributions of energies for 50 cycles periods for the whole experiment . . . 59
4.11 Distributions of time intervals for 50 cycles periods for the whole experiment . . . 60
4.12 Distributions of space intervals for 50 cycles periods for the whole experiment . . . 61
4.13 Values of the exponents of the 2 parameters distribution function for energy . . . 63
4.14 Values of the exponents of the 2 parameters distribution function for time intervals . . . 63
4.15 Values of the exponents of the 2 parameters distribution function for space intervals . . . 64
4.16 Visualization of response of the 2501th in the third dissipa-tive regime . . . 65
4.17 Visualization of the two earthquake-like patterns . . . 65
4.18 Evolution of the response during P3 . . . 66
4.19 Parameters of the 9 fatigue experiments and associated number of cycles until failure . . . 67
4.20 Cumulative released energy for the nine experiments. Each row is equi-frequency, each column is equi-stress. . . 68
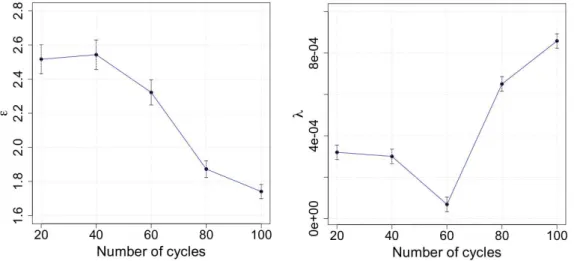
4.21 Values of ǫ and λ for the 4th experiment . . . . 69
4.22 Values of τ and ω for the 3rdexperiment . . . . 69
4.23 Space-Time maps for the 7th and the 2nd experiment . . . . . 70
4.24 Acoustic patterns of the development of cracks for the 4th and 9th experiment . . . . 70
4.25 Distributions of energy in P1, P2 and P3 - Gutenberg-Richter’s law . . . 72
4.26 Schematic example of forshocks (green), mainshock (blue), primary aftershock (red) and secondary aftershock (cyan) . 72 4.27 Seismicity rate in P1, P2 and P3 - Omori’s law . . . 73
4.28 Correlation integral in P1, P2 and P3 - Fractal clustering of earthquakes hypocenters . . . 74
4.29 Typical evolution of the temperature measured in two points until failure . . . 75
4.30 Infra-red photos taken at (-20)ms, at 0 ms and (+20)ms from the breaking of the sample. . . 75
4.31 Visualization of the macroscopic failure . . . 76
4.32 Visualization of the area A which is typical of a ductile rup-ture, visualization of small cavities . . . 77
4.33 Visualization of the area B, micro-cracks and fatigue stria . 77 4.34 Visualization of the fatigue stria (Area B) . . . 78
4.35 Visualization of the secondary micro-craks (Area B) . . . 78
4.36 Visualization of the area C, initiation area of the macro-crack 79 4.37 Theoretical response of the acoustic dissipated energy of a repeatedly loaded SMA . . . 81
5.1 Sendaï earthquake tsunami 03/11/11 (magnitude 9.0) -WTC attack 09/11/01 (2977 deaths) - Lehman Broth-ers Bankruptcy 09/15/08 - Sumatra earthquake tsunami
12/26/04 (magnitude 9.3) . . . 85
5.2 Intermittent behaviors and Gaussian behavior . . . 90
5.3 Distribution of the absolute value of the daily variations for SocGen (01/01/2003 to 09/11/11) and simulated distribu-tion with the same standard deviadistribu-tion for a Brownian modistribu-tion 90 5.4 Pedagogical example of an order book. . . 92
5.5 Visualization of the price of the société Générale share for T=28800 sec (one trading day), for T=3600 sec, for T=600 sec and for T=2 sec . . . 93
5.6 Simple representation of the intensity modification with the occurrence of earthquakes . . . 95
5.7 Volatility of the BNP Paribas share and correlation between BNP Paribas and SocGen on a given day of july 2011 . . . . 96
5.8 Price modeled as 2 Hawkes processes with cross-excitation (Up-Down) and without self-excitation . . . 100
5.9 Fitted Hawkes parameters through the log-likelihood pro-cedure . . . 101
5.10 Empirical and synthetic volatilities (BNPP) and correlations between the couple BNP Paribas/ SocGen during a three months periods . . . 102
5.11 Distribution of time intervals for BNP Paribas and simu-lated Hawkes trajectory . . . 103
5.12 Examples of distributions of time intervals for different as-sets - Vodaphone, Nestle (left) and BNP Paribas, Société Générale (right) . . . 104
5.13 Instantaneous release of energy for the first 10 cycles of a fatigue experiment and fitted conditional intensity . . . 106
5.14 Log-survivor plot of the inter-event times of the residual process and stationarity function of the residual process . . 108
6.1 The International Society of Self-Organize Criticality . . . . 116
A.1 Scheme of acoustic measurement devices . . . 122
A.2 Photo of the acoustic measurement device . . . 123
A.3 Representation of a hit . . . 125
A.4 Gausian distribution of heightsTaleb(2007) . . . 126
A.5 An example of a Paretian and a Gaussian unfair worldTaleb (2007) . . . 127
A.6 Classical shape of the density function of a power law . . . 128
A.7 World GDP in 1989 extracted from Wikipedia . . . 128
A.8 Proportions inside a power-law given an exponent Taleb (2007) . . . 129
Layout
T
helayout of the thesis can be sumed-up in six chapters in broad outline. The first chapter aims at presenting the collective EvoCrit projet and the associated subject to this thesis.The second chapter will introduce the Ni-Ti shape memory alloys and their known properties in fatigue. Then, the concepts of complexity, as well as self-organized criticality, will be detailed since this constitutes the core of this thesis and a deep comprehension of these theories is required to understand the issues of this manuscript.
The third chapter deals with an experiment quantifying the changes that occur in the response of the material from its virgin state until its sta-ble state through mechanical, thermal as well as acoustic measurements. Such an experimental device will reveal the emergence of complex and in-terlocked behaviors in the transient state. The aim is to demonstrate that a stable state is reached, whatever the quantity one is interested in, after a given number of cycles.
The fourth chapter is devoted to depict one fatigue experiment among others. Results are analyzed through the spectrum of SOC to extract from the shifts in distributions, induced by the changes in dissipative regimes, some precursory signals of initiation of fatigue. A comparison between the dynamics of earthquakes and the one encountered in fatigue is performed through a spatio-temporal analysis of the generated acoustic emissions. An attempt is made to demonstrate that the same critical dynamics can hold from the large scale of earthquakes down to the microscopic scale of the sample rheological structure.
The fifth chapter is a cultural chapter that invites the readers to travel across sciences through the concept of complexity. High-frequency finan-cial data will be analyzed through mutually excited point processes mod-els that were initially developed for earthquakes. Some troubling similari-ties in the dynamics of these, a priori, far away systems will be highlighted and subsequently applied to the temporal modeling of arrival times of waves in the transient state of shape memory alloys in fatigue. One ob-jective is to adopt the global point of view suggested by self-organized criticality in sciences.
The sixth and conclusive chapter will summarize the scientific im-provements brought by this thesis and introduce some outlooks for fu-ture studies. The goal is to have a reflexion about the reliability of the results that will lead us to discuss the added-value carried out by this first application of self-organized criticality in fatigue.
Several papers and conferences dealt with the works exposed in this thesis; all are reported in the appendix A. Readers will also found some mathematical reminders about specific points if needed.
1
Introduction
Contents
1.1 The ANR project EvoCrit . . . 5
1.1.1 Scientific description of the project . . . 5
1.1.2 Role of partners . . . 5
1.2 Originality of the PhD subject . . . 6
1.2.1 Definition of the subject . . . 6
1.2.2 Previous studies on the same subject. . . 7
1.2.3 Highlight of the originality and universality of this approach 8
T
hischapter explains the common objectives of the EvoCrit project, like Evolution of Criticality, for the different partners that are involved in this adventure. The ideas at the basis of this study are presented and the different discoveries and problems leading to this PhD subject are exposed from its inception.1.1. The ANR project EvoCrit 5
1.1 The ANR project EvoCrit
1.1.1 Scientific description of the project
Fatigue is among the less well understood mechanism of mechanical fail-ure encountered in such a variety of structfail-ures ranging from nuclear reac-tors to micro-electronic connections in cell-phones. Failure in cyclic load-ing appears unexpectedly when the structure is operatload-ing in a safe and apparently steady state regime. The situation is particularly troublesome with early precursors of fatigue and monitoring microscopic evolution of damage is an urgent need.
In this project, we put forward a new set of ideas which open the way to experimentally distinguish various stages in the micro-development of fatigue. The approach is based on the study of the multi-scale statistical structure of the intermittent acoustic signal generated by cyclically loaded solids. In previous works, Weiss and Grasso(1997),Richeton et al.(2006)
succeeded in identifying the peculiar power-law nature of similar acoustic signals in several classes of materials in monotonic loading. In the current project, the aim is to extend this approach to cyclic loading beyond the very first attempts ofVives et al.(2009) that are limited to few cycles.
In particular, we plan to develop an experimental method allowing one to discriminate between the power-law exponents and cutoffs generated by different deformation mechanisms. By tracing the proposed markers we shall be able to link the evolution in the structure of the acoustic signal to the changes in the collective behavior of defects. The originality of the project lies in the interpretation of the statistics of the microscopic events using the concept of self-organized criticality (S.O.C.).
SOC and the ubiquity of power-laws are the issues of great significance in contemporary science, giving a framework for understanding the emer-gence of complexity in a variety of natural systems, from earthquakes to turbulence. In this project we plan to extend this paradigm to fatigue and use the systematic changes in the structure of the critical (near critical) acoustic signals as a measure of closeness to ultimate failure.
The main theoretical idea is to identify fatigue failure with the crossover between two scale free regimes: dislocation based and micro-cracking based. Hence, decisive experiments on metals will be held and mathematical model will be developed in consequence to capture both the power-law signal and its transformation.
1.1.2 Role of partners
The ANR project is organized through a consortium of 4 partners:
1. Laboratoire de Mécanique des Solides of École Polytechnique Paris-Tech. LMS has a strong tradition in advanced mathematical mod-eling of complex mechanical phenomena. This partner provides a combined input for this project as, on the one hand, it has an experi-ence in fatigue modeling and on the other hand it has an experiexperi-ence in modeling criticality.
6 Chapter 1. Introduction
2. Unité de Mécanique - Matériaux et Structures of École Nationale Supérieure de Techniques Avancées ParisTech. UME-MS has a broad experience in modeling multi-physics phenomena with strong thermo-mechanical coupling as in shape memory alloys.
3. Laboratoire de Glaciologie et Géophysique de l’Environnement of Université Joseph Fourier Grenoble - Centre National de la Recherche Scientifique. LGGE has a long experience on the analy-sis of plasticity, dislocations avalanches and criticality from acoustic emission measurements.
4. Matériaux Ingénierie et Sciences of Institut National des Sciences Aplliquées de Lyon. MATEIS has a broad expertise in acoustic emission: concerning acquisition, AE signals processing and source mechanisms recognition.
Consequently, the added value of the consortium is relatively crys-tal clear and the scientific complementarity of partners will be used to reach the common aim which is to find a statistical descriptor of fatigue in metallic material at the microscopic scale.
1.2 Originality of the PhD subject
1.2.1 Definition of the subject
Experimental studies have shown that in the life of a cyclically loaded structure one can identify several characteristic stages. This is the case for shape memory alloys (SMA). In the first, transient stage, the evolu-tion of the microstructure is controlled by a hardening mechanism and after a finite number of cycles the system stabilizes in a shakedown state. The shakedown state marks the beginning of the second stage when the structure exhibits an almost fixed hysteresis loop due to the collective mo-tion of microscopic mechanisms, namely phase change and dislocamo-tions motions. In the shakedown stage, the macroscopic evolution appears to be frozen, however, micro-activity continues to take place. Indeed, the macroscopic dissipated energy (which is the area of the hysteresis loop in shape memory alloys) remains unchanged in this second stage for cycli-cally loaded SMA until the failure. Meanwhile, the development of micro-damage leads to the eventual change of the mechanism of the inelastic deformation. More specifically, primary defects eventually generate voids and micro-cracks which form microstructure of their own. The evolu-tion of the patterns of micro-cracks leads ultimately to the nucleaevolu-tion of a macro-crack, whose rapid propagation brings the final failure of the ma-terial.
So far, early precursors of fatigue are practically unknown and we still do not have reliable prediction tools relating defects activity at the micro-scale with the failure at the engineering scale. Our goal is to fur-nish such quantitative descriptors and predictors. To achieve success in this direction, it is crucial to find a new way of performing macroscopic measurements which would reflect microscopic activity of different types
1.2. Originality of the PhD subject 7
of defects. Consequently, acoustic emission seems to be a good candi-date to recover the missing information about the current state of damage by using statistical analysis of the acoustic waves generated by the re-peatedly loaded material. Instead of tracing individual inelastic effects, we will focus on the statistical signature of the microscopic evolution of a large number of deformation mechanisms which will enable us to perform probabilistic computations.
Acoustic emission (AE) is one of the most powerful non-destructive tool for the analysis of dynamical instabilities involving such topological defects as dislocations, twins, martensitic boundaries frictions and micro-crack. By using AE sensors one can monitor the distribution of the internal instabilities in space, time and energy domains. Consequently, a complete analysis of the underlying activity can be provided to track in live how, when and where are occurring acoustic events. In this thesis, the evolu-tion of damages is viewed through to the focus of collective phenomena by studying the scaling of acoustic signal instead of focusing on individ-ual defects. So, the ultimate goal is to extract the statistical measure of closeness to ultimate failure.
1.2.2 Previous studies on the same subject
Recently, Perez-Reche et al. (2004; 2007) as well as Vives et al. (2009)
demonstrated both experimentally and theoretically that the acoustic sig-nal associated with the steady state inelastic deformation in SMA submit-ted to cyclic loading has a power-law or scale free nature. The novelty of this approach was in the interpretation of the acoustic signal in terms of frequency of the recorded microscopic events. To appreciate the un-expected outcome of the experiments, we recall that in classical theories of inelastic deformation it is assumed that the transition from discrete to continuum can be accomplished by simple homogenization procedure. A fundamentally different picture emerged from the above experiments: that of scale-free intermittent activity characterized by power-law distributions of avalanches sizes, time correlations and aftershock triggering as well as fractal patterns and complex space-time coupling. Most importantly, the expected "average" behavior of individual defects was not detected. The experiments showed that the intermittent character of the steady state inelastic deformation is due to the collective motion of millions of de-fects. The emergence of large fluctuations can be broadly assigned to the competition between the small-scale disorder (structural inhomogeneity, quenched defects, heterogeneities) and long-range interactions.
Meanwhile, these studies focused on the statistical properties of acous-tic events until the steady state and didn’t investigate the behavior of the material beyond. In this thesis, such an analysis will be performed un-til failure, to understand how fatigue born at microscopic scale through the evolution of the properties of the power-law distributions of acoustic signals.
8 Chapter 1. Introduction
1.2.3 Highlight of the originality and universality of this approach
We aim at the development of a thoroughly new method of a non-destructive testing, allowing the practitioners to monitor in real time the initiation of the fatigue crack formation of a cyclically loaded structure. The method includes a potential for the identification of the early precur-sors to ultimate fatigue failure which have never been attempted before. Behind this method is the idea of criticality which has not been used pre-viously in fatigue studies. From a long term vision, a broad spectrum of industries, from aeronautical to bio-medical, will be interested in the development of such methods.
The proposed approach is based on a new way of monitoring the col-lective dynamics of defects during the fatigue life of structure. The novelty of our approach lies in the focus on the features in the acoustic signal that have not been studied previously. More specifically, we propose to use the scaling properties of the acoustic signals generated by the internal insta-bilities associated to collective depinning of a large number of defects as a measure of closeness to ultimate failure. The main theoretical idea is to identify precursory signals of fatigue from the crossover between different critical regimes.
The approach is truly multi-scale since criticality excludes in principle the possibility of conventional separation of scales. The originality stands in bringing together two seemingly unconnected concepts, fatigue and criticality, and in utilization of some of the most advanced concepts from theoretical physics to mathematics to achieve this goal. The fundamental interest is the new links that the proposed approach establishes between different research fields that require knowledges in many scientific dis-ciplines such as applied mathematics, mechanical engineering, materials science or statistical physics. That is the reason why a miscellaneous bib-liography will be developed in the next chapter.
2
Bibliography
Contents
2.1 Shape Memory Alloys and Fatigue . . . 11
2.1.1 Shape Memory Alloys materials . . . 11
2.1.2 Fatigue of shape memory alloys . . . 13
2.2 Complexity and self organized criticality . . . 16
2.2.1 Introduction about complex systems . . . 16
2.2.2 Genesis of Self-Organized Criticality (SOC) . . . 17
2.2.3 Characterization of the SOC state. . . 18
2.2.4 "Rain is earthquakes in the sky" - Christensen . . . 20
2.2.5 Scenarios leading to SOC . . . 21
2.2.6 SOC and material sciences. . . 21
2.3 Conclusion. . . 25
T
hischapter is devoted to the introduction of the knowledges, concepts and tools required to read this thesis. It must be considered as an help for readers which are not familiar with these topics. A deeper analysis of the works covering the specific thematics of this thesis is done at the beginning of each chapter. Nevertheless, a peculiar attention is dedicated to introduce the concept of self-organized criticality which is unusual in the frame of fatigue.2.1. Shape Memory Alloys and Fatigue 11
2.1 Shape Memory Alloys and Fatigue
2.1.1 Shape Memory Alloys materials
Discovery and applications
The nickel-titanium alloys were first developed in 1963 by the US Naval Ordnance Laboratory and commercialized under the trade name Nitinol (an acronym for Nickel Titanium Naval Ordnance Laboratories). Their remarkable properties were discovered by accident. A sample that was bent out of shape many times was presented at a laboratory management meeting. One of the associate technical directors, Dr. David S. Muzzey, decided to see what would happen if the sample was subjected to heat and held his pipe lighter underneath it. To everyone’s amazement the sample stretched back to its original shape.
Nowadays, the most popular alloys used in industrial applications are Cu-Al-Ni and Cu-Al-Zn for copper based alloys and near equiatomic TiNi, particularly in medicine and space applications. Among the several appli-cations of SMA in different types of industries, one can cite:
• Piping. The first consumer commercial application for the material was as a shape memory coupling for piping, e.g. oil line pipes for industrial applications, water pipes and similar types of piping for consumer/commercial applications. The late 1980s saw the commer-cial introduction of Nitinol as an enabling technology in a number of minimally invasive endovascular medical applications. While more costly than stainless steel, the self expanding properties of Nitinol al-loys manufactured to BTR (Body Temperature Response), have pro-vided an attractive alternative to balloon expandable devices. On average, 50 percents of all peripheral vascular stents currently avail-able on the worldwide market are manufactured with Nitinol. • Optometry. Eyeglass frames made from titanium-containing SMAs
are marketed under the trademarks Flexon and TITANflex. These frames are usually made out of shape memory alloys that have their transition temperature set below the expected room temper-ature. This allows the frames to undergo large deformation under stress, yet regain their intended shape once the metal is unloaded again. The very large apparently elastic strains are due to the stress-induced martensitic effect, where the crystal structure can transform under loading, allowing the shape to change temporarily under load. This means that eyeglasses made of shape memory alloys are more robust against being accidentally damaged.
Properties of shape memory alloys
What are shape memory alloys? SMA are fascinating materials which exhibit properties that usually do not characterize ordinary metals and alloys. Among these special properties, one can notice as examples, the shape memory effect (one way and two way shape memory), the super-elasticity or the damping effect. These extraordinary properties lead to use
12 Chapter 2. Bibliography
shape memory alloys as smart materials also know as new functional ma-terials. Shape memory behavior refers to a peculiar thermo-mechanical behavior in which small changes of one or two of the three thermo-mechanical variables (temperature, strain and external stress) can induce extremely large modifications of the two other thermo-mechanical vari-ables. This change of shape is based on a solid-solid phase transition be-tween austenite and martensite which is induced by the change in thermo-mechanical variables mentioned before.
Martensitic transformation The martensitic transformation is a solid-solid phase change, from a solid-solid phase called austenite into another solid-solid phase with lower crystallographic symmetry called martensite. The lower symmetry of this phase enables the existence of several martensite vari-ants defined by the orientation of their habit plane. The existence of a martensitic variant depends on the thermo-mechanical state. Two types of martensitic structures may exist within a SMA:
• self-accommodating martensite, when all variants are equiprobable. The martensite is said to be "twinned" in this case and no macro-scopic strain is observed.
• detwinned martensite, when a stress state favors the growth of some particular variants of martensite; this leads to the apparition of a macroscopic strain.
In SMA, the martensitic transformation is a thermoelastic transforma-tion, because the interfaces between phases are mobile enough to allow the shrinkage of the martensite plates through a backward movementOtsuka and Wayman (1998); it is crystallographically reversible. The
crystallo-graphical theory of the martensitic transformation has been studied by
M. Wechsler and Read(1953),Bowles and Mackenzie(1954). The
marten-sitic transformation is characterized by an inelastic transformation of the crystal lattice. It is a displacive transformation involving collective and cooperative motions of atoms, on a distance smaller than the lattice pa-rameters, with no diffusion. The martensitic transformation is a first-order transition; during a martensitic transformation, martensite and austenite coexist, separated by an invariant plane. Volumetric and shear strains are created, with shear strain being far greater. During the transformation, a latent heat is absorbed or released, according to the direction of trans-formation. The amount of heat produced is proportional to the volume fraction of the transformed material.
Finally, the transformation can be either influenced by temperature or by stress. But beyond the words, let us introduced visually martensite and austenite through pictures captured from a movie realized during this thesis. The movie focused on several grains of a heated Cu-Al-Zn alloy that exhibits a phase transition. One can observe the progressive appearance of the martensite plates in figure2.1.
Pseudo-elasticity Pseudo-elasticity is a dissipative phenomenon of the mechanically loaded SMA materials which occurs when the material are in the austenitic phase. The dissipative behavior is shown in the stress-strain
2.1. Shape Memory Alloys and Fatigue 13
Figure 2.1 – Appearance of the martensite plates under a thermally induced martensitic transition - ref: personal pictures
space since the trajectory is not identical during loading and unloading which results in an hysteresis loop as shown in the figure2.2.
The response of the material is elastic for an applied stress lower than
σMs which corresponds to the beginning of the phase transition plateau,
the stress at the beginning of the phase transition denoted Ms for Marten-sitic Start. At the end of the plateau, which is determined by σM f, the stress at the end of the martensitic transition denoted Mf for Martensitic Finish, the material is theoretically fully transformed and composed of oriented martensite. The response of the material for a stress greater than
σM f is elastic, it is the elastic domain of the martensite. The macroscopic
deformation is important at this stage. During unloading, the reverse transition is observed, from martensite to austenite with values σAs and
σA f corresponding to the yield stresses of beginning and end of
trans-formation of austenite. Coming back in austenitic state, detrans-formation is recovered and the global deformation is null. This phenomenon is called pseudo-elasticity.
SMA display other unusual properties, like the super-thermic effect, magnetic shape effect, the one and two ways memory effect as well as the rubber-like effect that will not be detailed here. Meanwhile, the interested readers can refer to the very thorough book ofOtsuka and Wayman(1998).
2.1.2 Fatigue of shape memory alloys
Experimental behaviors of SMA in cyclic loading
The theoretical pseudo-elastic behavior is only checked for the first cycles and the response is strongly modified upon cycling. Several experimental studies have been led on SMA in cyclic loading to analyze the modifica-tions of the shape of the hysteresis loop with the number of cycles. The hysteresis loop is characterized by three main quantities, linked to the martensitic transition, that will be changed with cycles. These quantities are shown in figure2.3and detailed in the following items:
14 Chapter 2. Bibliography
Figure 2.2 – Schematic representation of a pseudo-elastic loading
that decreases with the number of cycles. σMs decreases with the increase of the number of cyclesMelton and Mercier.(1979). Indeed,
slip deformations induce internal stresses and permit the creation of oriented martensite in these areas and then it decreases the external stress needed to change the phase of the material.
2. The dissipated energy quantified by the hysteresis loop, which is the area of the loop, that decreases with the number of cycles. Moumni et al. (2005) explain that the area of the hysteresis loop is evolving
during the first cycles and then it reaches the stable state and it stabi-lizes. This behavior implies a decrease of the dissipated energy per cycle with the number of cycles until reaching an asymptotic value for the stabilized cyclic behavior.
3. The residual strain ǫr increases with the number of cycles. The pseudo elastic behavior is not perfect, and it is well shown by the non-closed hysteresis loop. Since the first loading cycle, it remains a residual strain after unloading. Explanations of this phenomenon diverge. A first explanation Lexcellent et al. (2000) is that
resid-ual strain is a consequence of the existence of residresid-ual and oriented martensite which is not concerned by the phase transformation. A second explanation is that this residual strain is linked to micro-plasticity that occur during pseudo-elastic loadingBo and Lagoudas.
(1999). This residual strain increases in a exponential form until
reaching an asymptotic value, then, the material is in a stable state called shakedown state of the pseudo-elastic loading even if in re-ality it always remains an infinitesimal residual strain at the end of each cycle.
2.1. Shape Memory Alloys and Fatigue 15
Figure 2.3 – Three main variables of hysteresis loop
The hysteresis loop
The hysteresis loop is of prior importance in fatigue comprehension of shape memory alloys because it is an indicator of the dissipated energy per cycle. Consequently, several authors studied the modification of the hysteresis loop. Meanwhile, it will not be presented in this manuscript since their approaches are totally different of the one taken in this the-sis since these models used the thermodynamics formalism and a macro-scopic point of view. These models are mainly theoretical and far away from the experimental considerations that will be at the basis of our un-derstanding of mechanisms. Nevertheless, interested readers are invited to read the papers ofAbeyaratne and Kim(1997),Tanaka et al.(1995), Lex-cellent and Bourbon (1996),Bo and Lagoudas. (1999),Zaki and Moumni
(2007) andMorin et al.(2010).
The highlight is only given on the model ofZaki and Moumni(2007) Moumni et al. (2005) that is partly at the inception of this PhD subject.
Thanks to cyclic loading experiments on shape memory alloys, they no-ticed that the dissipated energy per cycle was diminished during the first cycles before stabilizing around a quasi constant value. Making the hy-pothesis that the major part of the lifetime of the material is in this stabi-lized phase, they tried to link the dissipated energy in the stable state and the number of cycles to failure. They brought to light an energy based law which validates experimental results in the tensile case.
The goal of this thesis lies in the continuity of this work to study thanks to acoustic emissions monitoring the micro-structural changes that occur when the dissipated energy seems quasi constant at the macro scale. The fact that it is not perfectly constant is a proof that some underlying mi-croscopic mechanisms are still taking place although mami-croscopic shake-down seems to be reached. Those mechanisms can not be seen thanks to macroscopic variables, that is the reason why we hope to reveal this ac-tivity thanks to acoustic monitoring to quantify the evolution of internal
16 Chapter 2. Bibliography
damages and find indicators of fatigue crack initiation at a microscopic scale.
Many experiments were performed during this thesis. These ex-periments involved several coupled devices. Among them are a servo-hydraulic loading machine, an acoustic emission monitoring system and an infrared camera. Consequently, readers that are not used to these ex-perimental systems are invited to read the appendix A to understand how data are generated, recorded and filtered.
2
.2 Complexity and self organized criticality
2.2.1 Introduction about complex systems
What is complexity? How to properly define complexity? Here are proba-bly two very ambitious questions. This concept of complex systems is born with the interest of people about out-of-equilibrium dynamics (e.g. dy-namical phase transition) and heterogeneous systems (e.g. spin-glasses). In each case systems are dealing a large number of elements with mutual interactions which are the base of an exchange of matter, of energy or of information with their environment. This constitutive parts of complex systems self-organize their internal structure and their dynamics to expose a novel and outstanding macroscopic behavior, also known as emergent property.
But let us define the common properties of complex systemsMitchell
(2009):
• Complex collective behavior, all complex systems consist of large networks of individual components (ants, e.g. see figure 2.4, neu-rons, stock-buyers), each typically following relatively simple rules with no central control or leader. It’s the collective actions of vast number of components that give rise to complex system. The oc-currence of coherent large-scale collective behaviors with a very rich structure is a consequence of the repeated non-linear interactions among its constituents : the whole turns out to be much more than the sum of its parts.
• Signaling and information processing, all complex systems produce and use information and signals from both their internal and exter-nal environments.
• Adaptation, all complex systems adapt themselves, change their be-havior to improve their chances of survival or success through learn-ing or evolutionary processes.
Now, one can define more properly what is a complex system: it’s a system in which large networks of components with no central control and simple rules of operation give rise to complex collective behavior, sophis-ticated information processing and adaptation via learning or evolution. Therefore, it can be defined as a system that exhibits nontrivial emergent and self-organizing behaviors.
Self-organized critical systems is representative of a sub-class of com-plex systems.
2.2. Complexity and self organized criticality 17
Figure 2.4 – Bridge constituted by ants which is one of the most famous natural example of complexity
2.2.2 Genesis of Self-Organized Criticality (SOC)
The Self-Organized Criticality (SOC) concept was introduced byBak et al.
(1988). In this famous paper, they made the hypothesis that systems
con-sisting of many interacting constituents may exhibit some general charac-teristic behavior. One of their claims was that dynamical systems organize themselves into a state with a complex but rather general structure. The complexity of system stands in the fact that no single characteristic event sizes. One can not just consider one time and one length scale that con-trols the temporal evolution of these systems. Although the dynamical response of the systems is complex, the simplifying aspect is that the sta-tistical properties are described by simple power laws. One other claim was that this typical behavior was developed without the "tuning" of any outside parameter, in this sense systems self-organizes. Moreover, the states into which systems organize themselves have comparable proper-ties with the ones exhibited by equilibrium systems at the critical point. Therefore, these systems have been qualified as SOC.
The sandpile model In this pioneer article, Bak et al.(1988) introduced the sandpile model as a toy model to illustrate their concept. The function-ing can be summarized as follows. When you first start buildfunction-ing a sand pile on a tabletop, the system is weakly interactive. A sand grain driz-zled from above onto a randomly chosen location on the tabletop has little effect on sand grains at other locations. However, as you keep dribbling sand grains from above onto randomly chosen tabletop locations, eventu-ally the sandpile at one or more locations reaches a "critical state" where the pile cannot grow any higher without a breakdown of the pile occur-ring. These breakdowns can be of various sizes depending on the exact configuration of the sand pile at the time the breakdown occurs as shown in figure 2.5. Bak refers to these critical states as states of self-organized
18 Chapter 2. Bibliography
criticality (SOC), i.e., states in which the system has self-organized to a point where it is just marginally stable. But, what does it mean to say that "breakdowns of all different sizes" can happen at SOC state? The drib-bling of one more grain of sand onto a location in a SOC state can result in an "avalanche" or "sand slide", i.e., a cascade of sand down the edges of the sand pile and (possibly) off the edge of the table. The size of this avalanche can range from one grain to catastrophic collapses involving large portions of the sand pile. Bak conjectured that the size distribution of these avalanches obeys a "Power Law" over any specified period of time T. That is, he conjectured that the average frequency of a given size of avalanche is inversely proportional to some power of its size, implying that big avalanches are rare and small avalanches are frequent.
Figure 2.5 – Pictures taken in experiments led on ricepile byFrette et al.(1996) to study experimentally the sandpile model
Theoretically, a large number of discrete and sandpile models have been studied. This point is not the core of this thesis but interested readers can refer to the Abelian sandpile modelDhar(1990) which is the simplest
and the most popular, and the models ofZhang (1989), Priezzhev et al.
(1996),Takayasu (1989). In each case, these models do not aim at
repro-ducing the exact dynamics of a sandpile, there are studies discussing this specific point Held et al. (1990), Jaeger et al. (1989; 1992), but rather at
introducing a generic toy model able to capture the key mechanisms of a broad class of system. One can think to illustrate this point that a plane made with a sheet of paper reproduces several key phenomenon of the ability to fly of a real aircraft.
2.2.3 Characterization of the SOC state
Defining and characterizing SOC is not an easy task because we are deal-ing with a concept which needs to be well-specified. This definition must
2.2. Complexity and self organized criticality 19
be based on physical mechanisms rather than on observations. Among the literature, the definition which is the most rigorous in my point of view is the one given bySornette(2003) which is quoted below :
SOC refers to the spontaneous organization of a system driven from the outside into a globally stationary state, which is characterized by self-similar distributions of even sizes and fractal geometrical properties. This stationary state is dynam-ical in nature and is characterized by statistdynam-ical fluctuations, which are referred generically to as "avalanches".
These avalanches, correspond to rare and sudden transitions that oc-cur over time intervals that are short compared to the characteristic time scales of their posterior evolution. These crises, are the core of the main evolution inside the system and large event can be viewed, as defined bySornette (2003) as belonging to the natural non-linear organization of
com-plex systems according to the SOC concept. They can result from the long-range power-law decay of spatial and temporal correlations and the heavy tail power-law distributions of even sizes. It’s essential now to distinguish how critical are these burst events. In a supercritical system, a single local event leads to an exponentially exploding process. In a sub-critical process, activity is exponentially decaying, always dying out. In the critical state, the activity is just able to continue indefinitely, with a power-law distribution of stop-ping times, reflecting the power-law correlations in the system. Thus, one has to be aware that SOC refers to complex system which are marginally stable, oscillating at the edge of order and disorder in a critical state.
These out-of-equilibrium systems are made of many interactive com-ponents and possess the following properties:
• a highly nonlinear behavior, which refers to the threshold response • a very slow driving rate
• a globally stationary regime, characterized by stationary statistical properties
• power-law distributions of event sizes, and fractal geometrical prop-erties which take into account the long range correlations.
Among SOC systems, another fundamental aspect is constituted by the threshold dynamics. The threshold must be highly considered since it acts as a local rigidity that allows the separation of time scales and pro-duces a large number of metastable states. These conditions of time scale separation and metastability are essential for the existence of scale invari-ance in this class of systems. Scale invariinvari-ance must be discussed here as it is an essential component of self-organized criticality. This property means that when an object is looked at different levels of magnification, its structures remains roughly the same. This was termed as fractals by Man-delbrot (1982) and mathematically, scale invariance can be captured by a
power-law. For physical phenomena scale invariance is an indicator of the absence of any characteristic length or time scale in a spatially extended dynamical system with both temporal and spatial degree of freedom.
20 Chapter 2. Bibliography
2.2.4 "Rain is earthquakes in the sky" - Christensen
Beyond, the theoretical example of the sandpile, several other systems from very various fields of sciences are exhibiting SOC behavior. Indeed, beyond being very beautiful, the citation of Christensen suggests an anal-ogy between disconnected systems, a priori, that nevertheless share com-mon properties in the frame of SOC. All these systems possess the follow-ing aspects:
• slowly driven non-equilibrium • threshold dynamics
• Relaxation event dissipates energy • Reaches statistically stationary state
where<in f lux>=<out f lux>
• Relaxation events of all sizes up to a system dependent cut-off Based on these key properties, an attempt is realized to summarize exam-ples of SOC in our day to day life in the following table:
System Source Storage Threshold Relaxation Earth’s crust [1] convection tension friction earthquakes
Landslide [2] moisture potential friction landslide Atmosphere [3] sun vapor saturation rain event
Sandpile [4] adding grains potential friction avalanche Snow avalanche [5] snow potential friction avalanche forest fires [6] sparking heat density burn area These examples are just a short list of all the phenomena that scien-tists have tempted to explain with SOC which provides a general mech-anism for the emergence of complex behavior in nature. It has also been proposed that traffic Nagel and Paczuski (1995), magnetic fusion plasma Dendy and Helander(1997), river networksI. Rodriguez-Iturbe(2001),
su-perconductors in a magnetic field Field et al.(1995), etc., all operate in a
self-organized critical state.
Among these examples, one will be discussed intensively in the chap-ter 4, earthquakes. Attention will be given to detail each point of the former table and demonstrate how linked it is with the cyclic loading of SMA. Let us now turn to the suspected mechanisms that could lead to SOC.
1Bak et al.(2002) 2Malamud et al.(2004) 3Peters et al.(2001)
4Frette et al.(1996),Christensen et al.(1996) 5Bak et al.(2002)
2.2. Complexity and self organized criticality 21
2.2.5 Scenarios leading to SOC
The mechanisms by which an open system self-organizes into a state with no characteristic scale is not unique. Several mechanisms have been stud-ied in the literature and three different classes of systems are proposed to be at the origin of SOC.
• The first class of systems exhibits SOC as a result of its tendency to synchronize Corral et al. (1997). Meanwhile this tendency is
frustrated by constraints such as open boundary conditions and quenched disorder which lead to a dynamical regime at the edge of synchronization, the SOC state.
• Extremal models are the second class to exhibit SOC due to the com-petition between local strengthening and weakening due to interac-tionsPaczuski and Boettcher(1997).
• A third class of models is constituted by multiplicatively driven sys-tems. Due to its multiplicative driving, criticality occurs even with periodic boundary conditions via a coarsening process. The ob-served behavior should be relevant to a class of systems approach-ing equilibrium via a punctuated threshold dynamicsSornette et al.
(1995)
There are other suspected scenarios able to lead to SOC. Interested readers can refer to the thorough book ofSornette (2003) which gives the
details of all of them.
2.2.6 SOC and material sciences
After the introduction of the concept of SOC Bak et al. (1988), different
fields of sciences were reported as key examples of SOC. Among the first ones were the geophysics natural phenomena exampled with earthquakes
Bak and Tang (1989),Sornette and Virieux(1992), snow pilesChen et al.
(1991), or volcanic rocksDiodati et al.(1991).
Indeed, this pioneer work ofDiodati et al. (1991) on the survey of the
Strombolian activity through acoustic emissions was the first to verify that SOC provides a robust framework to understand the relaxing dynamics underlying AE phenomena. Scaling laws for time and amplitude distribu-tions of the AE bursts were reported and the other key properties of SOC were checked one by one. This paper is the core of many other following studies in the domains of fracture and plasticity.
Fracture
The key property of the SOC systems is the scale invariance and con-sequently, considering the results of Sornette and Diodati at very large scales (earthquakes and volcano), it was natural to carry out studies about fracture at smaller scales. This was performed through the works ofPetri et al.(1994) andCannelli et al.(1993). These works were among the first
to focus on the SOC formalism as an explanation of micro-fracturing pro-cesses. The applicability of SOC to micro-fracturing has been immediately
22 Chapter 2. Bibliography
questioned, however, as power-laws alone are not unequivocal evidence for itSornette(2003),Cannelli et al.(1993).
The year 1997 The year 1997 was prolific in interesting articles deal-ing with fracture. Subsequently to these empirical discoveries, Zapperi et al.(1997) introduced one of the first model that deal with plasticity and
avalanche behavior in micro-fracturing process. This model, in the spirit of the random fuse model previously established byL. de Arcangelis and Herrmann (1985), takes a mesoscopic point of view and a very simple
plastic relation between the effective Hooke tensor and damages that is sufficient to recover the empirical observations that is a plastic steady state with its associated power-law distributions for the size, energy of events and the time intervals between events.
Regarding the experimental advances, Garcimartín et al. (1997)
pre-sented experimental data underlying the strong analogy between the for-mation of a crack in composite materials and percolation in a fuse net-work. They brought empirical proofs that micro-cracks cluster along the final crack and that fracture can be thought of as a critical phenomenon.
At the same time, studies were also beginning to take interest in the comprehension of the scaling laws of the roughness of the fracture surface with the works ofBouchaud(1997). The morphology of fracture surfaces
of various materials are reviewed. The observations are interpreted within the frameworkd of models of lines moving in a random environment. This suggests that fracture of heterogeneous materials could be seen as a dynamic phase transition.
Plasticity
The same year, one pioneer work stands the basis of the study of plas-ticity with the critical angle. This works is the one of Weiss and Grasso
(1997) which revealed, in the monotonic loading of a single ice crystal,
the strongly intermittent plastic flow characterized by jerks of dislocations with power-law distributions of energy. Few years later,Weiss et al.(2001), Weiss and Marsan(2003),Weiss and Miguel(2004) andMiguel et al.(2001)
get through another step by realizing the following key discoveries: • The viscoplastic deformation during the creep of ice occurs by a
suc-cession of avalanches which result from elastic interactions between dislocations
• Dislocation avalanches consist of a main shock correlated in time with a sequence of aftershocks
• The distribution of AE energies follow a power-law distribution scal-ing with an exponential cutoff which depends on the creep stage. They suggest the framework of non-equilibrium critical phenomena. • Scale-invariant distribution of the locations of the avalanches of
2.2. Complexity and self organized criticality 23
• Dislocations motions are coupled in space and time that organize themselves into avalanches that are themselves dynamically cou-pled into avalanche cluster, plasticity results from a collective phe-nomenon.
These findings are of prior importance to consider some results pre-sented in this thesis.
Regarding the modeling aspect of these discoveries,Zaiser and Aifan-tis (2006) contributed intensively to the development of models that aim
at capturing these lack of scales in plasticity. Then, other classes of mate-rials extended the field of knowledges through the work ofRicheton et al.
(2006) who recovered results really similar to those found for ice in
metal-lic single crystals. These works strengthened the idea of the universal character of plasticity which is sustained inWeiss et al.(2007).
Dimiduk et al.(2006) is another key contributor in the comprehension
of the scale-free intermittent flow in crystal plasticity through the clever experiment he realized at the nanometer scale. Working at such small scales permitted to directly determine the sizes of discrete slip events which are distributed according a power-law ranging on three orders of magnitude. Moreover, the time structure exhibited by the material exhib-ited a shock-and-aftershock earthquake-like behavior. Miguel and Zapperi
(2006) discussed this result drawing parallels with the previous works of Uchic et al. (2004) which dealt with the influence of the sample
dimen-sion on strength and the model of Zaiser and Moretti(2005) designed to
account for fluctuation phenomena in crystal plasticity.
Finally, it is worthwhile to notice the article of Csikor et al. (2007)
that demonstrated the universality of avalanche behavior in plasticity and elucidate the cross-over between intermittent and smooth plastic flow. It is explained that avalanche strains decrease in inverse proportion to sample size which results in difficulties to observe strain bursts in macroscopic sample. Meanwhile dislocation avalanches arise, on all scales, from the most basic feature of dislocation motions.
Martensitic phase transition
SOC has also received a particular interest from people who were work-ing on materials displaywork-ing a first-order phase transition. These materials, slowly driven exhibit sudden and local changes in their strain field, for martensitic materials or in their local magnetization for magnetic mate-rials. Indeed, the acoustic emission in ferroelastic systems is the analog of Barkhausen noise in magnetic materials Colaiori et al. (2004), Durin and Zapperi (2000). The avalanches generated during this phase
transi-tion reflect the fact that these systems dissipate energy, which causes the hysteresis loop, to go from one marginally metastable state to an other metastable state. The intrinsic distribution of disorder in the system de-termines the configuration of the metastable minima. Consequently, many studies were led in these two kinds of materials but the study of magnetic materials will not be treated and focus is made on the martensitic materi-als.
In this domain, Vives has undoubtedly contributed the most inten-sively to the discoveries of the SOC character of the phase transition of
24 Chapter 2. Bibliography
SMA. The scale-free distributions of avalanche size and duration associ-ated to the thermally induced martensitic transition were first reported in its precursory article Vives et al. (1994). Then, it was shown Vives et al.
(1995) that the distributions are independent of the temperature
indicat-ing that the physical behavior is unchanged along the transformation. The first part to transform are statistically transformed as the last. This crit-icality can be understood in echo of the works of Sethna et al. (1993) on lattice models with quenched disorder following athermal dynamics that correspond to a local energy relaxation. This local character is responsible for the fact that systems evolve, when driven by an external field, through metastable states rather than an equilibrium path. Criticality emerges for a sufficient amount of disorder and it has been checked by the fact that dis-locations are formed during the transformation processPons et al.(1990)
and consequently cycling through the transition enables to control the amount of disorderPerez-Reche et al.(2004).
Cyclic martensitic transition The question of the evolution of the power-law distributions upon cycling was first raised byCarrillo and Ortín(1997)
found that cycling reduces the extent of power-law behavior. The energy barrier sizes encountered during the transition are scale-invariant, which sustained the complexity of the free energy landscape. Carrillo et al.
(1998) also brought empirical evidences that this scale-free behavior hold
for different alloys, that exhibit a phase transition, independently of their chemical composition, concentration, phase temperature, heat treatment, etc... The sufficient amount of disorder needed was quantified through the demonstration that, after few cycles, distributions became critically stable. In the continuity of these works, it was shown that the distribution of the amplitudes of avalanches evolve, for an initially virgin sample, from supercritical to critical with the number of cycles by Perez-Reche et al.
(2004). The first quantitative measure of the changes occurring from
cy-cle to cycy-cle was introduced through the statistical correlation between the AE patterns of the consecutive loops. The correlation is low in the first cycles and after roughly ten cycles the activity profile tends toward a sta-ble pattern which exhibits a higher correlation. This result shows that the disorder evolves in such a way that the systems reaches a stationary metastable trajectory after the learning which then becomes reproducible. The dissipated energy is then a minimum according to Prigogine’s theo-remPrigogine I.(1977).
The driving mechanism of the transition has also been studied and recognized as strongly influent. All the studies previously exposed, fo-cused on thermally induced transition. Heczko and Straka(2004) studied
the strain driven martensitic transition of a Ni-Mn-Ga alloy. An asymmet-rical response of the material between the behavior during loading and unloading is noticed.
Bonnot et al. (2008) adressed this question by submitting a Cu-Zn-Al
single crystal to a stress and strain driven experiment. One conclusion was the inclusion of the strain hysteresis loop in the stress hysteresis loop showing a much large dissipation of energy in the second case. More-over, the shape of the hysteresis loop is different since the stress-driven curve display a linear behavior during the transition, whereas the
strain-2.3. Conclusion 25
driven curve shows a yield point followed by strong instability of the force.
Pérez-Reche et al. (2008) proposed a model to explain the influence of a
soft driving (displacement is free to fluctuate and force is imposed) and hard driving (displacement is constrained and force can fluctuate). They found a crossover, determined by the driving mode, between two kinds of criticality. Soft driving corresponds to criticality whereas hard driving cor-responds to self-organized criticality, the first one requiring the fine tuning of disorder whereas the second is disorder independent. They associated one different physical mechanism for each mode, the first one describes regime with nucleation whereas the second deal exclusively with propa-gation. Vives et al. (2009) recently led experiments for stress and strain
driven Cu-Zn-Al SMA. The three important conclusions to keep in mind are that:
• The values of the energy distributions tend to stabilize with cycling as found for thermally induced experiments, meanwhile, exponents are first decreasing as a exponential for the stress driven transition whereas, it seems independent of cycles for the strain driven case. • After stabilization, exponents does not depend on the driving rate. • Exponents for the stress-driven case are larger than exponents for the
strain-driven case which is in accordance with the model previously exposed.
These findings are of great importance since no study are specifically studying the behavior in fatigue of the SMA within the framework of criticality. As a consequence, these empirical evidences in cycling will be our unique points of comparison.
A large range of study in martensitic transition are also devoted to the modeling of the hysteresis, the evolution of the micro-structure and the correlations as well as the jerky nature of the transformation. It will not be developed here but interested readers can refer to the works of Sreekala et al.(2004),Ahluwalia et al.(2004),Cerruti and Vives(2008),Perez-Reche et al.(2007) orSalman and Truskinovsky(2011).
A major part of this thesis focused on the concept of self-organized crit-icality which embedded the power-law distributions of times and energies of the analyzed system. As a consequence, it comes naturally that a precise mathematical definition of what is a power-law is necessary. The fascinat-ing world of the power-law distributions and their associated scale-free property and mathematical definitions can be found in appendix A for readers who are not used to this kind of distributions.
2.3 Conclusion
This bibliographical chapter enabled to introduce the knowledges regard-ing the triptych of this thesis SMA, fatigue and SOC.
It has been explained what are shape memory alloys and how their properties are transformed with cycling, noticeably, the evolution of the
26 Chapter 2. Bibliography
hysteresis loop in the stress strain diagram during the transient phase until its stabilization in the stable state.
On another hand, the SOC concept was introduced with its constitu-tive properties, non-linear and threshold response, stationary conditions and power-law distributions of the size and duration of events. Conse-quently, scientists made used of this concept in a wide range of areas, from geophysics natural phenomena to fracture and for the martensitic transition. Studies of the martensitic transition in the SOC framework, re-vealed an evolution of the exponents of the power-law distribution in the first cycles.