HAL Id: hal-01416464
https://hal.archives-ouvertes.fr/hal-01416464
Submitted on 14 Dec 2016
HAL is a multi-disciplinary open access
archive for the deposit and dissemination of
sci-entific research documents, whether they are
pub-lished or not. The documents may come from
teaching and research institutions in France or
abroad, or from public or private research centers.
L’archive ouverte pluridisciplinaire HAL, est
destinée au dépôt et à la diffusion de documents
scientifiques de niveau recherche, publiés ou non,
émanant des établissements d’enseignement et de
recherche français ou étrangers, des laboratoires
publics ou privés.
VEGAS: Visualizing, exploring and grouping alerts
Damien Crémilleux, Christophe Bidan, Frédéric Majorczyk, Nicolas Prigent
To cite this version:
Damien Crémilleux, Christophe Bidan, Frédéric Majorczyk, Nicolas Prigent. VEGAS: Visualizing,
exploring and grouping alerts. IEEE/IFIP International Workshop on Analytics for Network and
Service Management, Apr 2016, Istanbul, Turkey. pp.1097 - 1100, �10.1109/NOMS.2016.7502968�.
�hal-01416464�
VEGAS: Visualizing, Exploring and Grouping
AlertS
Damien Cr´emilleux
∗, Christophe Bidan
∗, Fr´ed´eric Majorczyk
†, and Nicolas Prigent
∗∗
CentraleSup´elec, Email: {firstname.lastname}@centralesupelec.fr
†DGA-MI and CentraleSup´elec, Email: [email protected]
Abstract—The large quantities of alerts generated by intrusion detection systems (IDS) make very difficult to distinguish on a network real threats from noise. To help solving this problem, we propose VEGAS, an alerts visualization and classification tool that allows first line security operators to group alerts visually based on their principal component analysis (PCA) representation. VEGAS is included in a workflow in such a way that once a set of similar alerts has been collected and diagnosed, a filter is generated that redirects forthcoming similar alerts to other security analysts that are specifically in charge of this set of alerts, in effect reducing the flow of raw undiagnosed alerts.
Index Terms—Visualization, Intrusion Detection, CyberSecu-rity, PCA, Workflow, Teamwork.
INTRODUCTION
Security operators are in charge of the crucial tasks of monitoring networks, detecting anomalies and attacks as well as correcting them or at least limiting their impact. IDS (Intrusion Detection Systems) have been developed to help reach these goals. While they have proven to be useful, they are well-known to raise large quantities of alerts. Worse, some of these alerts are redundant, while some can be false positives, i.e. alerts that are not related to an effective attack, due to erroneous detection rule or incorrect tuning of the IDS. More-over, even though the detected event was indeed malicious the target of this event could be in fact not vulnerable. According to [13], more than 90% of alerts reported by IDS are not linked to relevant security issues.
We strongly believe that an efficient way to handle the large quantity of alerts is to make collaboration among security operators easier by better organizing the workflow through visualization [6], [12]. Following that goal, we developed VEGAS, an intuitive visualization tool that allows grouping similar alerts easily and dispatching these groups of alerts among security operators for further analysis. Once a security operator has identified a group of alerts, any forthcoming alert that should belong to that group will be forwarded automatically to the analyst in charge of the group for further analysis. Therefore, VEGAS reduces the amount of alerts received by the operator in charge of dispatching them and make the flow of alerts more manageable.
Specifically, VEGAS proposes the following contributions:
• Visual exploration of alerts based on principal component analysis (PCA). Our system uses this technique to con-vert incoming alerts into two dimensions variables and
represent them on a scatterplot, making it easier for the security operator to group similar attacks.
• Assisted generation of rules to dispatch alerts. Once a group of similar alerts has been identified, the security operator can easily interact with VEGAS to generate a rule that describes alerts belonging to this group.
• Filtering of incoming alerts based on previous
manipu-lations. Alerts are dispatched according to the rules that have been generated. Therefore, VEGAS only displays new alerts (i.e., alerts that do not belong to an identified group of alerts that has already been taken care of) and alerts that belong to a group are automatically dispatched in this group for further analysis or persistent storage. This paper is organized as follows. First, Section I presents an overview of our approach. Then, we show in Section II the main interface, with details about principal component analysis, user interactions and the generation of dispatching rules. In Section III, we provide an illustrative use case. Finally, we discuss related work in Section IV.
I. ORGANIZING COLLABORATION TO MANAGE THE FLOW OF ALERTS
A. IDS alerts as a data source
VEGAS uses IDS-generated alerts as a data source. Without loss of generality, the prototype we developed for VEGAS uses Snort alerts as a data source since they are common in public datasets such as [3] for instance. We underline the fact that it would be easy to switch to another alert format made of a constant number of well-defined field.
Several fields describe the packet that is identified as mali-cious by Snort. In VEGAS, these fields are treated differently given their meaning: the type of alerts, the source and desti-nation IP, and the source and destidesti-nation port are used in the PCA computation and in representations. The priority and the timestamp are only used in representations. The fields cited here are those described as important in the dataset [3]. B. Actors
VEGAS supposes two types of actors. First, a front-line security operator is in charge of receiving the raw alerts and quickly dispatching them using the interface that we describe in Section II. Second, the security analyst inspects in details each group of alerts transmitted by the front-line security operator. In classical contexts, a given front-line security operator generally dispatches alerts to a few security analysts.
C. Workflow
Alerts generated by the IDS are transmitted to a filter that dispatches them. Originally, the filter only has the default rule that sends all the alerts to the front-line security operator for display. When the front-line security operator identifies a new group of alerts, he performs a quick analysis of it, annotates it and adds a new filtering rule to the filter to redirect these alerts to a new bucket to be analyzed by a security analyst. From this moment, the group of alerts that has been identified by the front-line security operator disappears from his or her interface and is sent directly to the bucket. Forthcoming alerts matched by the rule will also be sent directly to the bucket and won’t be displayed on the front-line security operator interface.
When a security analyst is available to analyze a bucket, he receives all the alerts matched by the rule (i.e., alerts that were in the group when it was created and alerts that arrived later and were dispatched to this bucket). He performs the required analysis and deploys relevant mitigation actions if necessary (patching a service, modifying firewall rules, reinstalling a device, modifying configuration, etc.). He can also modify the filtering rule according to the results of the analysis or of the performed mitigation actions.
II. VISUAL REPRESENTATION OF ALERTS
A. Computing PCA and displaying alerts
Visual correlation is effective if humans can detect patterns in the visualization, and many dimensions make it difficult to detect relevant patterns. Due to that fact, we needed to perform dimension reduction to offer the operator a simple enough rep-resentation to detect similar alerts. We think that alerts should be displayed in only two dimensions, to be easily manipulated. We chose the Principal Component Analysis (PCA) [8] that as been proven efficient for dimension reduction.
Other techniques of machine learning (like classification or clustering) are voluntary excluded to visualize IDS alerts, because selecting and grouping alerts to create meaningful sets and rules is the task of the front-line operators, given their knowledge about the monitored network. Our approach gives more flexibility to the operators. Moreover it makes sure to bring back human intelligence in the loop and avoid grouping unrelated alerts.
The variables contained in an alert consist of numerical val-ues and categorical valval-ues [9]. Therefore, categorical variables are transformed into numeric one, using the dummy variable creation technique [7]. For each category, a new variable is created, and elements belonging to this category take the value 1 for the new dummy variable, else 0. Thanks to this technique, alerts are now only composed of numeric values, and can be used as input for the principal component analysis.
B. Overview of the interface
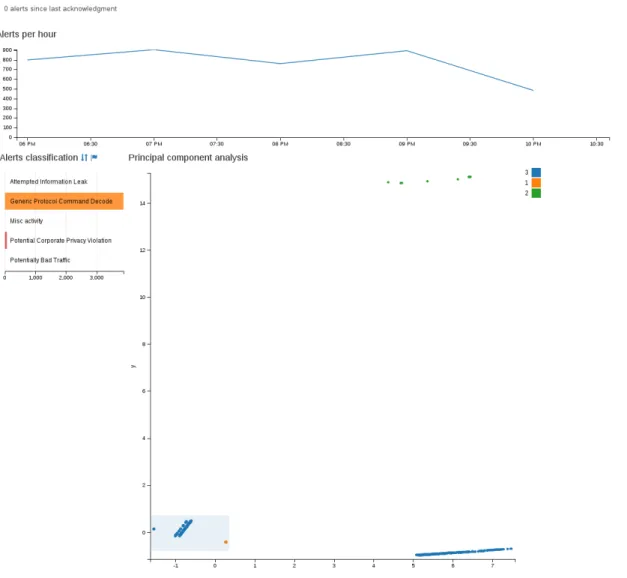
Figure 1 shows the VEGAS interface presented to the front-line operator. At the top, the header provides general information and manipulations about the current situation. The timegraph then provides the distribution of alerts over time. It first gives knowledge to the operator about the variations in the
volume of alerts that could for instance indicate an increase in the amount of attacks. The operator can also zoom in to select a specific period of time.
Below, the scatterplot displays the result of the PCA that was applied on the alerts. The Priority field of the alert is shown on the scatterplot using colors to transmit this important information to the front-line security operator.
Classification, Source IP, Destination IP, Source port and Destination port bar charts present the distribution for these features in the alerts that have been selected by the front-line security operator in the scatterplot. Due to space constraint, Figure 1 does not display all these bar charts.
At the bottom (still not shown on Figure 1), selected alerts are listed in their raw form. This way, the operator can directly view the subset of original matched alerts.
C. Analyzing alerts
The front-line operator can then select a group of alerts on any charts. All other representations are automatically updated to display only the values exhibited by the selected alerts.
He can go through the bar charts representing the values exhibited by the alerts for each field to try to better understand the features shared by the selected alerts. Bar charts have been chosen because the are very efficient to represent categorical fields when they can take numerous different values [10].
The front-line security operator can also filter the scale on the values present for this field, meaning “the whole set of values that are present in all alerts”, not only the selected ones. This interaction helps the front-line operator in viewing the values for the field in the selected alerts while keeping the possibility to perceive the relative distribution of these values compared to the full set of alerts.
D. Generating relevant filtering rules
While the set of alerts that leads to a rule has a set of values for each of the fields, only some of these fields are relevant. Therefore, the front-line security operator needs to select the relevant fields to be included into the rule. Here, we should emphasize that the selection of the relevant field could arguably depend on the front-line security operator a priori knowledge and/or way of understanding attacks. We advocate that any experts should have the required knowledge.
Once a group of similar alerts has been identified and the relevant fields selected, the front-line security operator generates a new rule to be inserted in the dispatching filter. The operator can then give a title to the new rule and add comments to help analysts to better understand the identified group of alerts.
The filtering rule generation is a simple automated process. All the selected values of the selected fields for the selected alerts are put in a dictionary. All the alerts matched by the filter are immediately reclassified according to this new filtering rule, including the alerts that were displayed as well as the forthcoming alerts.
In our prototype, existing rules can not be directly modified from the interface, but can be manually changed or updated to remain relevant.
Figure 1. VEGAS interface for the front-line security operator (beginning).
III. CASE STUDY
We used the logs of the 2012 VAST Challenge [3] to perform experiments with VEGAS, with more than 50,000 Snort alerts during the three days of capture. The first 4,500 alerts are used to initiate PCA computation. This corresponds to the first hours of the challenge, from 6pm to 10pm. Figure 1 shows the representation generated by VEGAS. Three groups of alerts clearly appear on the scatterplot. Due to the priority, given by the color on the graph and knowing that a priority of 1 is the most severe and 4 is the least severe, the group on the bottom left is the first one to inspect.
By analyzing it using the interaction offered by VEGAS, we are able to learn that this group is composed of 3,935 alerts, and that it can actually be split in two distinct categories:
• The first, with only 60 alerts, appears only during the first hour and is defined by a suspicious traffic toward the DNS server on the port 53. Regarding their priority these alerts should be analyzed more in depth by a security analyst to see if this threat is as serious as it seems.
• The second category, with 3,510 alerts, is differentiated from the first one by the destination port: 139 and 445. These two ports are used for Microsoft file sharing technologies and are often targeted by attackers [5]. The timegraph indicates that contrary to the traffic toward the port 53, alerts of this type are still arriving at a huge rate. These two different groups are visually close on the scatterplot because all the source IP addresses are internal IP, meaning that workstations have surely been compromised.
We now study the two other groups:
• The group of alerts at the top is composed of 32 alerts,
which arrived around 9pm. These alerts are characterized by a single source IP address, 172.23.240.156, and a single destination IP address, 172.23.0.1. Given the number of different destination ports, and the repartition of the alerts, we believe that a scan of the services on the firewall is currently happening.
• The last group is a flow of alerts beginning at 7pm. We have seven external IP communicating with many internal IP using the port 6665. This is probably C&C connections
through IRC, to give orders to the compromised stations. At this point, we create four rules, according to the four groups we had discovered and the meaningful fields used to describe them. This allows to quickly dispatch alerts to the security analysts.
During the first iteration of the analysis, other alerts arrived waiting to be displayed on VEGAS, so we refresh the interface to display them. We perform a few iterations, each of them using the alerts that have not otherwise been dispatched by the already created filters. For instance, thanks to the scatterplot, and the interaction proposed by VEGAS, we discovered that two others external IP are creating suspicious IRC traffic. We manually add them to the previous rule, updating the knowledge of VEGAS.
IV. RELATED WORK
Aggregators and correlators have been proposed to auto-matically aggregate and correlate alerts so as to reduce their quantity and to improve their relevance. Nevertheless, they often require extensive configuration and the quantity of alerts that remains is still high and consequently very difficult to handle, even by groups of security operators.
The security visualization community has proposed several solutions to represent IDS alerts. SnortView [11] uses a two-dimensions diagram to manage the flow of alerts created by Snort. Alerts are displayed using the time each alert was raised on the abscissa and the source IP on the ordinate. Different colors and icons are used to represent alerts, according to their classification (e.g. attacks on a mail server). However, SnortView is limited to displaying a maximum of 40 different alerts that happened over four hours. It is also limited since it does not allow to add supplementary information to alerts.
In IDS Rainstorm [1], alerts are also displayed on a two-dimensions diagram using time on the abscissa and destination IP addresses on the ordinate. This representation allows to identify the main targets and threats on the network. However, the classification of the alert is not taken into account. And, due to the time-sliding window, alerts can be missed.
TVi [2] applies PCA to detect anomalies in network flows. The PCA algorithm is also used in [14]: the authors apply this technique to detect runtime problem and classify errors. Results from the PCA are automatically classified and decision trees are created to visualize and understand what are the characteristics of detected problems. However, both these tools focus on detecting outliers. Therefore, they do not allow fine-grained exploration of alerts as does VEGAS.
Regarding the visual exploration of alerts, VEGAS follows an approach similar to CORGI [10], since the notion of values of interest that helps keeping track of specific log entries can be related to the notion of meaningful variable. Nevertheless, CORGI was designed for in depth analysis of multiple data sources while VEGAS is clearly intended for quick analysis and sorting of alerts.
Finally, VEGAS follows the same objectives as the tool proposed by Curtis et al. [4] that displays alerts in a list with a specific color encoding for quick visual analysis. This proposal provides basic sorting functions to be applied to variables, and
specific IP can be tagged as malicious for a later processing. However, future alerts can not be automatically classified and the list representation is not compatible with a high volume of events.
V. CONCLUSION AND FUTURE WORK
In this article, we presented VEGAS, an IDS alerts visual-ization and classification tool that allows security operators to manage important flows of IDS alerts on a network.
Experiments on the VAST Challenge 2012 dataset have pro-duced encouraging results. We are now performing extended tests on other datasets to really evaluate VEGAS. We are also studying other projection techniques to compare the results with those of the PCA.
Moreover, VEGAS can be improved in at least three ways. First, performance could be boosted by replacing SVG-based representation. Second, we believe that the time dimension is currently underused. Time patterns between the different labels of alerts may be found and this will lead to the description of a global attack. Finally, VEGAS can be extended with learning techniques. Filters are currently created as simple patterns matching on data. Learning techniques could be used to propose a broader definition for filters and attacks.
REFERENCES
[1] K. Abdullah, C. Lee, G. Conti, J. Copeland, and J. Stasko. IDS rain-Storm: visualizing IDS alarms. In Proceedings of the IEEE Workshop on Visualization for Computer Security, VizSec ’05, pages 1–10, 2005. [2] A. Boschetti, L. Salgarelli, C. Muelder, and K.-L. Ma. TVi: A visual
querying system for network monitoring and anomaly detection. In Proceedings of the 8th International Symposium on Visualization for Cyber Security, VizSec ’11, pages 1:1–1:10. ACM, 2011.
[3] K. Cook, G. Grinstein, and M. Whiting. The VAST Challenge 2012, BankWorld, 2012.
[4] P. Curtis, N. Phillips, D. Simpkins, and T. Jankun-Kelly. A tool for rapid visual interrogation & triage of alerts. In Proceedings of the Workshop on Visualization for Cyber Security, VizSec ’14, 2014.
[5] H. Du. Windows TCP 139 and 445 vulnerability.
[6] A. D’Amico and K. Whitley. The real work of computer network defense analysts. In Proceedings of the Workshop on Visualization for Cyber Security, VizSec ’07, Mathematics and Visualization, pages 19–37. Springer Berlin Heidelberg, 2007.
[7] S. Garavaglia and A. Sharma. A smart guide to dummy variables: Four applications and a macro. In Proceedings of the Northeast SAS Users Group Conference, 1998.
[8] H. Hotelling. Analysis of a complex of statistical variables into principal components. Journal of Educational Psychology, 24:417–441, 1933. [9] C. Humphries, N. Prigent, C. Bidan, and F. Majorczyk. ELVIS:
Extensible log VISualization. In Proceedings of the Tenth Workshop on Visualization for Cyber Security, VizSec ’13, pages 9–16. ACM, 2013. [10] C. Humphries, N. Prigent, C. Bidan, and F. Majorczyk. CORGI: Com-bination, organization and reconstruction through graphical interactions. In Proceedings of the Eleventh Workshop on Visualization for Cyber Security, VizSec ’14, pages 57–64. ACM, 2014.
[11] H. Koike and K. Ohno. SnortView: Visualization system of snort logs. In Proceedings of the ACM Workshop on Visualization and Data Mining for Computer Security, VizSEC/DMSEC ’04, pages 143–147. ACM, 2004. [12] N. Mahyar and M. Tory. Supporting communication and coordination in collaborative sensemaking. IEEE Transactions on Visualization and Computer Graphics, 20(12):1633–1642, Dec 2014.
[13] R. Vaarandi. Real-time classification of IDS alerts with data mining techniques. In Proceedings of the IEEE Military Communications Conference, MILCOM 2009, pages 1–7, 2009.
[14] W. Xu, L. Huang, A. Fox, D. Patterson, and M. I. Jordan. Detecting large-scale system problems by mining console logs. In Proceedings of the 22nd ACM SIGOPS Symposium on Operating Systems Principles, SOSP ’09, pages 117–132. ACM, 2009.