Dyspeptic symptoms in the general population: a factor and cluster analysis
of symptom groupings
H. Piessevaux,* B. De Winter,† E. Louis,‡ V. Muls,§ D. De Looze,¶ P. Pelckmans,** M. Deltenre,†† D. Urbain‡‡ & J. Tack§§
*Department of Gastroenterology, Cliniques Universitaires St Luc, Brussels, Belgium
†Laboratory of Gastroenterology, Division of Gastroenterology, Medicine, University of Antwerp, Antwerpen, Belgium ‡Department of Gastroenterology, CHU, Domaine du Sart Tilman, Luik, Belgium
§Department of Gastroenterology, CHU Saint Pierre, Brussels, Belgium
¶Department of Gastroenterology, University of Gent R.U.G., University Hospital, Gent, Belgium **Dienst Gastro-enterologie, University Hospital Antwerp, Edegem, Belgium
††Gastroenterology, CHU Brugmann, Brussels, Belgium
‡‡Department of Gastroenterology, Faculty of Medicine and Pharmacy Vrije Universiteit Brussel, Vrije Universiteit Brussel (VUB), Jette, Belgium
§§Division of Gastroenterology, Department of Internal Medicine, University Hospital Gasthuisberg, Leuven, Belgium
Abstract
Both dyspeptic and gastro-oesophageal reflux-like symptoms are frequent in the general population, but their degree of overlap is unknown. In severe functional dyspepsia (FD), symptoms are organized in factors associated with pathophysiological mechanisms. The aims of this study were: (i) to assess the prevalence of dyspeptic symptoms with and without overlapping reflux symptoms in the general population and their impact on daily life and on healthcare utilization; and (ii) to compare symptom groupings in the general population to FD patients. A total of 2025 subjects, representative of the Belgian general population, were used in this study. The subjects were submitted to a questionnaire with validated questions on their dyspeptic and reflux symptoms and with evaluators of impact on daily life and use of healthcare resources. Significant dyspeptic symptoms were found in 417 (20.6%). Overlapping reflux symptoms were present in 141 (33.8%). In this group, symptoms were more frequent and more severe. Dyspeptic symptoms induced weight loss (12.7%) and absenteeism (12.4%), affected daily life (61.2%) and generated use of healthcare resources, such as medical consultations (61.4%) and medication (70.9%). Factor analysis revealed a three-component structure with factor 1 including fullness, bloating and early satiety, factor 2 including nausea and vomiting and factor 3 including discomfort, pain, belching and reflux. If forced in a four-factor model, the analysis separates belching as independent factor. Dyspeptic symptoms are frequent in the general population, with overlapping reflux symptoms and increased symptom burden in about a third.
Keywords : cluster analysis ; dyspepsia ; epidemiology ; factor analysis ; survey.
INTRODUCTION
Dyspeptic symptoms are extremely common in the general population.1 While the majority will never seek medical care, a significant proportion of these will eventually proceed to consult.2 This proportion is of
considerable magnitude and has a major impact on health economics.3,4 Quality of life is significantly affected in dyspepsia, especially functional dyspepsia (FD).5
Several reports exist on the prevalence and impact of dyspepsia in the general population.6,7 However, the results of these studies are strongly influenced by criteria used to define dyspepsia. Expert consensus has proposed to define dyspepsia as pain or discomfort centred in the upper abdomen.8 It has been suggested that these symptoms differentiate dyspepsia from gastro-oesophageal reflux disease (GORD), where heartburn is the predominant symptom. Nevertheless, separating GORD from dyspepsia is hampered by a number of
confounding factors, such as the presence of dyspepsia-type symptoms in many GORD patients,9 and difficulties to recognize heartburn by both patients and physicians.10,11
It has been suggested that a word-picture questionnaire may help to improve the identification of dyspeptic patients with underlying heartburn.12 Indeed, a word-picture questionnaire to recognize heartburn identified putative FD patients that were likely to respond to acid-suppressive therapy or in whom pathological oesophageal acid exposure could be demonstrated.10,13,14
It is generally assumed that dyspepsia, and especially FD, is a heterogeneous condition in which different pathophysiological mechanisms underlie different symptom patterns.8,15 In addition, it has been suggested that subdividing FD into subgroups is relevant for epidemiological, pathophysiological, and clinical research, and for the development of new therapeutic strategies.16 There is a growing tendency to identify dyspepsia symptom subgroups based on statistical analysis instead of arbitrarily predefined classifications. In a group of tertiary care FD patients, a factor analysis performed on symptom groupings revealed the presence of four different factors determining the symptom pattern. Statistical analysis revealed that each of these factors is associated with distinct pathophysiological and/or psychosocial dimensions in FD.17 It is unknown whether, using similar questionnaires, the same factors are present in dyspeptic subjects in the general population. Such a finding would suggest similar pathophysiological mechanisms are present in different severity groups of the syndrome. This knowledge would eventually be important when extrapolating suggested management and therapeutic strategies for severe FD patients to less severe (non-)consulters.
To study this, we undertook a survey of a representative sample of the general population and submitted the subjects to a validated dyspepsia questionnaire to identify the prevalence, severity and frequency of individual dyspeptic symptoms in the Belgian population. In addition, we identified overlapping GORD by means of a validated heartburn questionnaire10,13,14 and we questioned the individuals on their predominant complaint, on the impact of their symptoms on their daily life, on their use of medical resources, on their familial history of upper gastrointestinal (GI) complaints, on their smoking and drinking habits, on the experienced life stress and on the impact of their symptoms on their work.
Our aims were: (i) to asses the prevalence of dyspeptic symptoms with or without overlapping heartburn in the general population; (ii) to evaluate the impact of these symptoms on daily life, utilization of medical resources and on absenteeism; (iii) to study symptoms groupings in the general population; and (iv) to compare these data to findings in FD patients.
METHODS Subjects
In November and December 2002, 2025 subjects completed a face-to-face questionnaire. These subjects had been selected randomly from the entire population (8 359 200) of people aged over 15 years, to make up a sample which is representative of the total Belgian population. Subject selection was stratified for the 11 Belgian provinces, the degree of urbanization, sex, age, profession and economical level.
The selection of individuals was performed at random as follows. The country was divided into 34 entities based on 11 provinces and four degrees of urbanization. Inside these entities, a series of municipalities were chosen at random. Up to five interviews were performed in each municipality according to its size. In each municipality, habitations were selected at random for these interviews by a computer program choosing streets and numbers of these habitations by groups of 10 interviews. The randomly selected individuals were interviewed face-to-face at their homes for a maximum of 30 min by professionals not involved in health care: these interviewing
professionals were agents from INRA Belgium, a company specializing in face-to-face interviews. Questionnaire
A complete version of the questionnaire both in Dutch and in French is available upon request to the
corresponding author. In brief, the first question was: 'Over the last 12 months, did you experience digestion or stomach problems not related to an acute infection?'. On positive answers, questions on the presence of reflux symptoms, based on the validated GORD questionnaire,13 on the presence and intensity of eight dyspeptic symptoms, identical to the one used in previous studies in tertiary care patients,14,17,18 on the influence of meals or bowel movement on symptoms and on the predominant complaint were asked. Subsequently, the frequency and the history of the symptoms, the presence of triggering factors, the impact on the daily life and the fear for
organic diseases were asked for. The next chapter was related to healthcare seeking, the use of medical diagnostic resources and medication use. Finally, questions about familial history of upper GI complaints, life stress, smoking habits, alcohol consumption, non-GI medication and dyspepsia-induced absenteeism were posed. This questionnaire was first tested on a sample of 20 subjects and small revisions were made where necessary. Statistical analysis
The subjects who answered yes to the first question were divided into four groups: reflux+/dyspepsia+ (R+D+), reflux-/dyspepsia+ (R-D+), reflux+/dyspepsia-(R+D-) or reflux-/dyspepsia- (R-D-). In line with previous studies in tertiary care patients in Belgium,14,17,18 dyspepsia was considered present when the answer to the first question was positive and when at least two dyspeptic symptoms out of a total of eight were present. The cut-off value for the presence or absence of reflux was based on a sensitivity analysis comparing responses to the reflux score to the presence of a reflux-like complaint as the most bothersome symptom question and after computation of a receiver operating characteristics (ROC) curve. In the subsequent analysis, only patients classified as R+D+ or R-D+ were analysed. Normally, distributed data were compared using the independent-samples T-test. Non-parametric correlations were performed using the Pearson's chi-squared analysis or the Spearman's ρ-test as appropriate. The association between the presence of dyspeptic symptoms or efficacy of treatment and covariates was assessed using multiple logistic regression analysis with backward Wald's elimination procedure. In the stepwise procedure, the probability for entry was 0.05 and for removal 0.10. Odds ratios and the 95% confidence interval were computed.
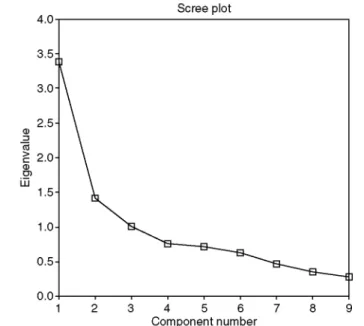
Factor analysis (principal component analysis) was applied to the dyspeptic population (R+D+ and R-D+) to assess for the presence of correlations between particular types of upper GI symptoms which might reflect symptom complexes. The variables were the eight dyspeptic symptoms coded either in the presence or absence of any intensity, in the presence or absence of moderate to severe or in four points severity scale and the reflux score coded accordingly. The principal components analysis method of data extraction was used. An eigenvalue of greater than one (Kaiser criterion) was used to determine the number of components needed to represent the study data. A scree plot of eigenvalues was computed. To improve interpretation of the components, they were rotated using the varimax technique. Only loadings of 0.5 or higher were considered in the interpretation of factors. In the analysis, missing values were excluded on a pairwise basis.
Subsequently, non-hierarchical cluster analysis based on the factor scores derived earlier was performed to examine their distribution within the total population. A k-means cluster analysis for a three-cluster solution was investigated. One-way analysis of variance was used to investigate possible association between the clusters and the three factors that were identified or continuous variables. Finally, Pearson's chi-squared analysis was applied to study the association between cluster membership and categorical data. All statistics have been performed with SPSS 11.5 (SPSS, Chicago, IL, USA) for Windows. All data are shown as mean ± SD or median (95% CI). P-values were two-tailed and considered as statistically significant at a level of 5%.
RESULTS
Demographic characteristics
Two-thousand and twenty-five subjects were interviewed. The mean age of the interviewed subjects was 45.3 ± 17.7 years. Of these, 1179 (58.2%) were Dutch speaking, 801 (39.6%) French speaking and 45 (2.2%) had another mother tongue. The marital status was as follows: 1181 (58.3%) married or living in couple, 400 (19.8%) divorced, separated or widowed and 444 (21.9%) single. The mean height was 170 ± 9.7 cm and the mean weight was 71.9 ± 14.0 kg. The mean body mass index (BMI) was 25.0 ± 4.7 kg m-2
Prevalence of dyspeptic symptoms
Of the 2025 individuals, 417 (20.6%, 95% CI 18.8-22.4%) subjects had experienced epigastric symptoms during the preceding 12-month period. In univariate analysis, dyspeptic symptoms were significantly more frequent in women (253/1039, 24.4% vs 164/986, 16.6%, P < 0.0005). The prevalence of dyspeptic symptoms was also significantly different in the Belgian regions: north Belgium (Flanders, mainly Dutch speaking, 17.1%) vs Brussels metropolitan area (48/189, 25.4%) and vs south Belgium (Wallonia, mainly French speaking, 25.7%) (χ2: P < 0.0005). Finally, the prevalence of dyspeptic symptoms increased significantly with age (7.7% at age 15-17 years; 17.6% at 18-24, 18.3% at 25-34, 19.7% at 35-44,22.8% at 45-54, 23.7% at 55-64 and 24.4% above 65 years, ρ = 0.084; P < 0.0005). In univariate analysis, other demographic variables such as the social level or degree of urbanization did not influence the prevalence of dyspeptic symptoms.
In multivariate analysis, using multiple logistic regression, the presence of dyspeptic symptoms was associated with female sex (OR 1.575, 95% CI 1.261-1.965, P < 0.005), increasing age (OR 1.011, 95% CI 1.005-1.017, P < 0.005) and with decreased degree of urbanization (on a scale of 4) (OR 1.11, 95% CI 1.006-1.215, P = 0.038). The most bothersome complaint was heartburn in 218/417 subjects (52.3%), dyspeptic symptoms in 162/ 417 subjects (38.8%) and not specified in 37/417 (8.9%).
Prevalence of dyspeptic and of heartburn symptoms
The presence of heartburn was only assessed in the 417 subjects with epigastric symptoms during the preceding 12-month period. In these, a positive answer to 1,2, 3 or 4 items of the heartburn word-picture questionnaire was obtained in respectively 86%, 59%, 35% and 10%. When the answer to the most bothersome complaint revealed heartburn and this was used as a reference, a ROC analysis to determine the cut-off level for the reflux score yielded the following results: for a cut-off value of ≥2: sensitivity 0.734 and specificity 0.472 and for a cut-off value of ≥3: sensitivity 0.564 and specificity 0.714. Hence, a cut-off value of ≥3 was used to allow sufficient specificity for identifying subjects with concomitant reflux symptoms. Using this parameter, of the 417 subjects with dyspeptic complaints, 141 (33.8%) were classified R+D+, 237 (56.8%) R-D+, 4 (1.0%) R+D- and 35 (8.4%) R-D-(Fig. 1). The subjects presenting with pure reflux symptoms (R+D-) or minimal dyspeptic symptoms (R-D-) were discarded from further analysis.
The mean age of individuals with or without concomitant reflux symptoms was not different (48.9 ± 16.1 vs 47.7 ± 17.4, P > 0.05). Similarly, other demographic features such as sex and BMI were not different in these two groups. The average number of symptoms reported in individuals with concomitant reflux (R+D+) was significantly higher than in the group without reflux (R-D+) (5.45 ± 1.81 vs 3.85 ± 2.03, P < 0.0005), and was not correlated with age. The mean severity of each individual symptom was significantly higher in R+D+ subjects compared to R-D+ (data not shown).
Characteristics of dyspepsia symptoms in the general population
The frequency of the severity grading of each of the eight dyspeptic symptoms is detailed in Table 1. Compared to men, women with dyspepsia had significantly higher scores for nausea and vomiting and lower scores for belching (ρ = 0.130, P = 0.012; p = 0.118, P = 0.022 and ρ = -0.109, P = 0.034 respectively). The symptoms were reported to be relieved by eating in 64/378 (16.9%). Dyspeptic subjects with significant heartburn were more likely to have worsening of symptoms by intake of a meal (46.8% vs 31.2%, P = 0.002). Approximately, one quarter of the subjects (25.1%) reported relief of symptoms by defecation. There was a significant association between the presence of relief by eating and relief by defecation (χ2: P = 0.002). At the level of the individual symptoms, there was a significant positive correlation between the presence of relief by eating and the score for pain (ρ = 0.108, P = 0.035) and the score for belching (ρ = 0.117, P = 0.023). Also, we found a positive correlation between the presence of relief by defecation and the scores for fullness (ρ = 0.147, P = 0.004), bloating (ρ = 0.194, P < 0.0005) and early satiety (ρ = 0.149, P = 0.004). The circumstances in which symptoms most frequently occur are: after the meals (37%), after intake of a specific food or beverage (42.6%), during stressful periods (52.6%) or at work (5.6%). We identified significant bivariate correlations between occurrence of symptoms during specific circumstances and specific symptom or reflux scores: occurrence after a meal was associated with the discomfort score (ρ = 0.163, P = 0.001), the fullness score (ρ = 0.153, P = 0.003), the early satiety score (ρ = 0.168, P = 0.001) and the reflux score (ρ = 0.123, P = 0.012), occurrence after intake of a specific food or beverage was negatively associated with the pain score (ρ = -0.116, P = 0.024) and the vomiting score (ρ = -0.163, P = 0.001), occurrence during stressful periods was associated with the discomfort score (ρ = 0.110, P = 0.032), the pain score (ρ = 0.233, P < 0.0005), the bloating score (ρ = 0.188, P < 0.0005), the early satiety score (ρ = 0.146, P = 0.005), the nausea score (ρ = 0.123, P = 0.016), the belching score (ρ = 0.112, P = 0.03) and the reflux score (ρ = 0.167, P = 0.001), finally, symptoms occurring at work were associated with the early satiety score (ρ = 0.107, P = 0.037).
Figure 1 Summary of epidemiological data in the current survey in 2025 subjects in the general population. The pie chart on the left-hand side shows the proportion of subjects without and with dyspeptic symptoms. The pie chart on the right-hand side shows the overlap between dyspepsia and reflux symptoms in those with self-reported dyspeptic symptoms.
Table 1 Frequency of severity grading for each of the eight symptoms in 378 subjects with significant dyspepsia
Absent Mild (slightly
bothersome)
Moderate (bothersome but not interfering with
activities) Severe (interfering with activities) Discomfort 103 (27.2) 148 (39.2) 105 (27.8) 22 (5.8) Pain 96 (25.4) 125 (33.1) 118 (31.2) 39(10.3) Fullness 121 (32.0) 111 (29.4) 117(31.0) 29 (7.7) Bloating 121 (32.0) 121 (32.0) 108 (28.6) 28 (7.4) Early satiety 193 (51.1) 92 (24.3) 69(18.3) 24 (6.3) Nausea 231 (61.1) 80(21.2) 42(11.1) 25 (6.6) Vomiting 290 (76.7) 48 (12.7) 29 (7.7) 11 (2.9) Belching 189 (50.0) 104 (27.5) 64(16.9) 21 (5.6)
Data are shown as absolute counts (row percentage).
The dyspeptic symptoms occurred at the following frequency: daily (13.9%), several times per week (18.1%), once a week (13.1%), two to three times per month (22.8%), once a month (13.6%) or less often (18.4%) (missing data in 19 cases). We found a significantly higher frequency of symptoms in the subjects with reflux symptoms (ρ = 0.199, P < 0.0005). There was a significant correlation between the sum of the intensity scores of the individual symptoms and the frequency score (ρ = 0.333, P < 0.0005). The mean duration of the symptoms was 69.1 ± 5.8 months. There was no significant difference in duration of the symptoms between those with and without reflux symptoms.
Risk factors
In univariate analysis, the presence of dyspeptic symptoms was significantly associated with stressful life experience (ρ = 0.162, P < 0.0005), a family history of upper GI symptoms (ρ = 0.193, P < 0.0005), the use of non-steroidal anti-inflammatory drugs (NSAIDs) (ρ = 0.118, P = 0.013), but not to alcohol intake. In
multivariate analysis, using logistic regression, only stressful life experience (OR 1.90, 95% CI 1.50-2.40) and use of NSAIDs (OR 2.07, 95% CI 1.29-3.31) were retained in the model.
Consequences of dyspeptic symptoms
Weight loss was reported by 12.7% of the individuals presenting with dyspeptic symptoms. In univariate
analysis, the presence of weight loss was significantly correlated to the presence of fullness (χ2: P = 0.035), to the presence of bloating (χ2: P = 0.006), to the presence of early satiety (χ2: P < 0.0005), to the presence of vomiting (χ2: P = 0.013) and to the presence of reflux symptoms (χ2: P = 0.010). The average weight loss was 7.7 ± 5.4 and was not different whether specific symptoms were present or not (data not shown). In multivariate analysis, we found a significant association between the presence of weight loss and the early satiety score (OR 1.85, 95% CI 1.32-2.61, P < 0.0005), the pain score (OR 1.72, 95% CI 1.15-2.59, P = 0.009) and the belching score (OR 0.68, 95% CI 0.46-1.00, P = 0.049).
Impact on work absenteeism
Two-hundred and one out of 378 subjects (53.2%, 95% CI 48.0-58.3%) with dyspeptic symptoms were engaged in a professional or educational activity. Of these 25 (12.4%, 95% CI 7.8-17.1%) had to stay away from work or educational activities as a result of their dyspeptic symptoms during the previous year. The presence of absenteeism was significantly correlated to the presence of bloating (χ2: P = 0.008) and to the presence of vomiting (χ2: P = 0.039). In a multivariate model, only the pain score was a significant covariate for the presence of absenteeism (OR 2.28, 95% CI 1.29-4.06, P = 0.005).
Impact on daily life and anxiety
Daily life was affected by dyspeptic symptoms in 61.2% of subjects (missing data in 17). The proportion of subjects with symptoms affecting daily life was significantly higher in patients with coexisting reflux symptoms (70.9% vs 55.5%, P = 0.004). The individuals rated the impact of their symptoms on their daily life as follows: hampering daily life (8.3%), interfering with some activities (10.2%), interfering slightly (42.7%) and not interfering at all (38.8%). Aspects of daily life that were the most hampered were family life (44.8%), professional life (25.3%), leisure time (24.4%), social life (22.2%) and intake of specific foods (11.8%). A logistic regression analysis revealed that the presence of pain, early satiety and belching were significant
determinants of hampering daily life [OR 3.17 (95% CI 1.92-5.25%), 2.44 (95% CI 1.53-3.90) and 1.53 (95% CI 0.97-2.40) respectively]. The dyspeptic symptoms were generating anxiety, severely in 7.5% or moderately in 37.1%. If anxiety was present, a severe disease was feared in 28.6%. This disease was an ulcer in 71.7% cancer in 23.9%, or an infection in 19.6%.
Utilization of medical resources
Two-hundred and thirty-two subjects reported having consulted a physician for their dyspeptic symptoms (61.4%, 95% CI 56.4-66.4%). Medical consultations were higher in R+D+ patients compared to R-D+ (82% vs 53%, P < 0.001). Of these, 74.1% reported several visits with a physician. In most instances, the subjects first consulted a general practitioner and were referred to a gastroenterologist (n = 135). One-hundred and forty-two subjects were still in regular follow-up. A large proportion of dyspeptic subjects underwent diagnostic testing: e.g. 36.5% reported undergoing upper GI endoscopy. The patient's assessment of the usefulness of the endoscopy was to gain access to a specific treatment (67.4%) or to obtain reassurance (48.6%). Only 4.3% experienced the endoscopy as useless.
Treatment of dyspeptic symptoms
Seventy-one per cent of individuals were currently taking medication for their symptoms. Factors significantly associated with intake of medication were region of living (83% in Flanders, 43.2% in Brussels and 64.5% in Wallonia; χ2: P < 0.005), frequency of symptoms (χ2: P < 0.005) and stressful daily life experience (χ2: P = 0.039). Antacids were used by 53.0%, 21.3 used H2-antagonists, 23.1% proton pump inhibitors and 36.2%
prokinetics. When asked about their satisfaction with this treatment, 48.5% were very satisfied, 44.4% rather satisfied, 3.7%, rather unsatisfied and 0.4% not satisfied at all. Satisfaction did not differ between types of medication (data not shown). When a logistic regression adjusted for age, sex, BMI, social status, familial history, stressful life experience, smoking and alcohol consumption, was applied on the satisfaction of the treatment as dependent variable and the dyspeptic and reflux symptoms as covariates, only the reflux score was retained in the model (OR 1.71, 95% CI 1.37-2.12). When the same analysis was performed in the R-D+ subgroup, no significant association was found.
Factor analysis
Principal component analysis of the data set, using the Kaiser criterion, revealed the presence of a three-factor structure of the symptoms when using the intensity grading of each dyspeptic score and the reflux score (Table 2).
These three factors explain 64.5% of the variance with factors 1, 2 and 3 accounting for 37.6%, 15.7% and 11.2% of the total variance respectively. Factor 1 includes fullness, bloating and early satiety; factor 2 includes vomiting and nausea and factor 3 includes reflux, belching, discomfort and epigastric pain. Similar results were obtained when the data were coded in present or absent, but this explained only 59.7% of the variance. A borderline significant negative association was found between factor 2 and age (ρ = -0.101, P = 0.049) and a significant association between factor 3 and sex (ρ = 0.108, P = 0.036) and between factor 1 and weight (ρ = -0.204, P < 0.0005) but none for symptom duration, absenteeism or BMI. We identified a correlation between score for factor 1 and relief by defecation (ρ = 0.193, P < 0.0005) and between the score for factor 3 and relief by meals (ρ = 0.170, P = 0.001). There was also a negative association between score for factor 3 and relief by defecation (ρ = -0.111, P = 0.031). The mean factor scores were significantly different in men and women for factor 2 (-0.14 ± 0.85 vs 0.09 ± 1.08, P = 0.023) and factor 3 (0.14 ± 1.01 vs -0.09 ± 0.98, P = 0.031). The mean score for factor 2 was significantly higher in subjects with symptoms-induced weight loss than those without (0.31 ± 1.27 vs -0.05 ± 0.95, P = 0.02).
Table 2 Factor loading of the severity of eight dyspeptic symptoms and a reflux score in 378 subjects with significant dyspeptic complaints in a three-factor analysis
Factor 1 2 3 Fullness 0.839 0.133 0.139 Bloating 0.823 0.120 0.154 Early satiety 0.688 0.344 0.118 Nausea 0.231 0.869 0.072 Vomiting 0.137 0.896 0.080 Discomfort 0.435 -0.145 0.534 Pain 0.430 0.104 0.520 Belching -0.029 0.304 0.690 Reflux score 0.138 -0.015 0.741
Data reduction using principal component analysis and vari-max rotation in factors with an eigenvalue > 1.0. Bold values indicates the significance of highest loading values for each factor.
Analysis of the scree plot (Fig. 2) indicates a four-factor solution may also be valuable. In a four-factor solution, factor 1 includes fullness, bloating and early satiety, factor 2 includes vomiting and nausea, factor 3 includes reflux score, pain and discomfort and factor 4 includes belching. The factor loading of the symptoms is depicted in Table 3. This model explains 73.0% of variance.
Figure 2 Scree plot of the factor analysis of dyspeptic symptoms in 2025 subjects in the general population.
Table 3 Factor loading of the severity of eight dyspeptic symptoms and a reflux score in 378 subjects with significant dyspeptic complaints in a four-factor analysis
Factor 1 2 3 4 Fullness 0.854 0.121 0.142 0.086 Bloating 0.835 0.110 0.158 0.088 Early satiety 0.667 0.360 0.178 0.002 Nausea 0.199 0.887 0.087 0.044 Vomiting 0.128 0.894 0.030 0.127 Discomfort 0.407 -0.139 0.510 0.225 Pain 0.302 0.189 0.706 -0.050 Reflux score 0.023 0.048 0.818 0.151 Belching 0.117 0.153 0.155 0.950
Data reduction using principal component analysis and vari-max rotation in four-factor solution. Bold values indicates the significance of highest loading values for each factor.
Cluster analysis
The cluster analysis showed that a subdivision into three separate clusters was sufficient. One-way analysis of variance was used to investigate associations between the three clusters and the three factors that were identified. For all factors, significantly different levels were found in each cluster (F scores 83.0, 432.5 and 61.2
respectively, all P < 0.0005). (Table 4). The first cluster is characterized by high scores on epigastric pain, discomfort and reflux symptoms, and is low on other symptoms. The second cluster is characterized by fullness, bloating and early satiety, and has low scores on the other symptoms. The third cluster has dominant scores on nausea and vomiting, but the other symptoms are also associated.
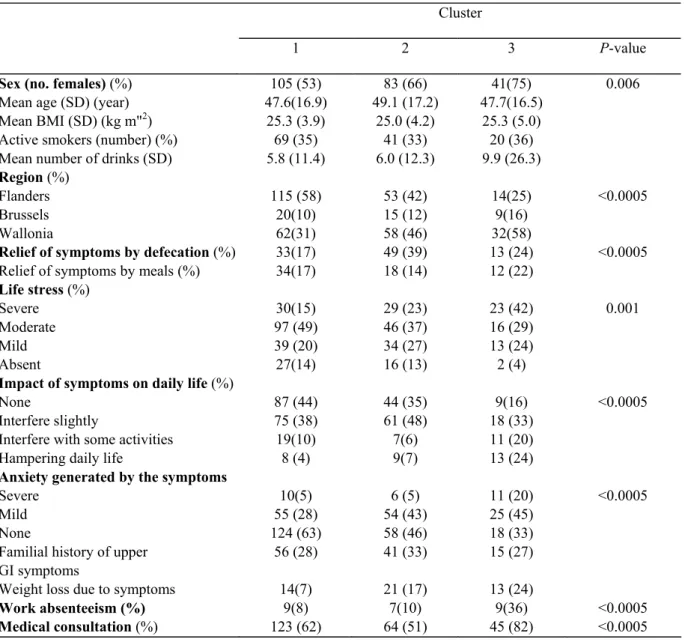
The clusters formed based on symptoms alone were also found to be differentiated in other respects (Table 5). Cluster 3, which has the broadest symptom impact, is associated with female sex, increased life stress events, a higher impact on daily life and more anxiety induced by the symptoms. This cluster is more prevalent in the south of the country and is associated with more medical consultations and higher work absenteeism.
Table 4 Overview of factor scores generated by a factor analysis, by cluster using a three-cluster solution
Cluster (n) Factor 1 Factor 2 Factor 3
1 (197) -0.52 -0.32 0.35
2(126) 0.67 -0.38 -0.70
3 (55) 0.31 2.02 0.34
Table 5 Association between various variables and cluster membership
Cluster
1 2 3 P-value
Sex (no. females) (%) 105 (53) 83 (66) 41(75) 0.006
Mean age (SD) (year) 47.6(16.9) 49.1 (17.2) 47.7(16.5)
Mean BMI (SD) (kg m"2) 25.3 (3.9) 25.0 (4.2) 25.3 (5.0)
Active smokers (number) (%) 69 (35) 41 (33) 20 (36)
Mean number of drinks (SD) 5.8 (11.4) 6.0 (12.3) 9.9 (26.3)
Region (%)
Flanders 115 (58) 53 (42) 14(25) <0.0005
Brussels 20(10) 15 (12) 9(16)
Wallonia 62(31) 58 (46) 32(58)
Relief of symptoms by defecation (%) 33(17) 49 (39) 13 (24) <0.0005
Relief of symptoms by meals (%) 34(17) 18 (14) 12 (22)
Life stress (%)
Severe 30(15) 29 (23) 23 (42) 0.001
Moderate 97 (49) 46 (37) 16 (29)
Mild 39 (20) 34 (27) 13 (24)
Absent 27(14) 16 (13) 2 (4)
Impact of symptoms on daily life (%)
None 87 (44) 44 (35) 9(16) <0.0005
Interfere slightly 75 (38) 61 (48) 18 (33)
Interfere with some activities 19(10) 7(6) 11 (20)
Hampering daily life 8 (4) 9(7) 13 (24)
Anxiety generated by the symptoms
Severe 10(5) 6 (5) 11 (20) <0.0005
Mild 55 (28) 54 (43) 25 (45)
None 124 (63) 58 (46) 18 (33)
Familial history of upper 56 (28) 41 (33) 15 (27)
GI symptoms
Weight loss due to symptoms 14(7) 21 (17) 13 (24)
Work absenteeism (%) 9(8) 7(10) 9(36) <0.0005
Medical consultation (%) 123 (62) 64 (51) 45 (82) <0.0005
Variables significantly associated to cluster membership are represented in bold.
DISCUSSION
This is one of the largest face-to-face surveys of the general population which aimed at better establishing the epidemiology of dyspepsia. We studied the prevalence and severity of dyspeptic symptoms and we
systematically assessed the presence of predominant heartburn or the co-existence of overlapping heartburn in the general population with self-reported epigastric symptoms. We evaluated the impact of dyspeptic symptoms on daily life, utilization of medical resources and on absenteeism. Furthermore, we used factor analysis to recognize different dimensions underlying the dyspeptic symptom pattern in the general population.
Dyspeptic symptoms were our main interest, but as it has been well documented that separating GORD from dyspepsia is difficult, and major overlap between dyspepsia and GORD occurs, we used a questionnaire that was designed to optimize the recognition of heartburn10,13,14 This questionnaire was previously shown to identify putative FD patients in whom pathological oesophageal acid exposure could be demonstrated or that were likely to respond to acid-suppressive therapy. To the best of our knowledge, this approach has not been used in previous epidemiological studies and hence, comparison to other prevalence studies in which pure heartburn was not excluded should be made with care. Nevertheless, the prevalence of dyspeptic complaints (20.6%) we found is within the range of previous published data.15 It is remarkable that the prevalence of dyspeptic symptoms with exclusion of predominant reflux-like complaints (11.7%) is very close to another very large scale prevalence study.19
In contrast to several previous epidemiological studies, we found a clear association between prevalence of dyspepsia and increasing age. Westbrook et al. found a higher mean age of individuals with epigastric pain and symptoms suggestive of GORD such as acid regurgitation, dysphagia and burping/belching.6 These findings were not reproduced in our data set, suggesting that the subgroup of individuals with reflux symptoms is not responsible for the association with age in our study. An alternative explanation for this association between age and the prevalence of dyspepsia could be the increasing use of medication, specifically NSAIDs. This hypothesis was not supported by the analysis of the data. It is conceivable that Helicobacter pylori infection, whose
prevalence also increases with age, contributes to the age-dependent increase in dyspeptic symptoms,15,20 but H. pylori status was not addressed in this study.
Surprisingly, we found that the prevalence of dyspeptic symptoms was significantly different in the three Belgian regions. It has been suggested that such discrepancies may be influenced by cultural or linguistic differences.20 This is unlikely in our study, since in multivariate analysis, region of living and not mother tongue was associated with the dependent variable, the presence of dyspeptic symptoms. Alternatively, the lower economic status in Wallonia and Brussels might be advocated to explain these findings. In a large scale postal survey in Australia, socio-economic class was a determinant of upper and lower GI symptoms.21 In our study, however, we did not find such association and in the multivariate model, regional differences in prevalence of dyspeptic symptoms persisted after adjustment for social class. Finally, differences in the H. pylori epidemiology in the different regions may be incriminated, but data are lacking to substantiate this hypothesis.
We found, similar to other studies, a large overlap of symptoms not only with GORD-like symptoms, but also with irritable bowel syndrome-like symptoms.22,23 Our data also show that dyspeptic subjects with concomitant GORD-like symptoms have higher intensity and frequency scores, even for those symptoms which are not classically associated with GORD. The severity of the symptoms in this subgroup also more significantly impacts on the daily life. Due to its design (self-reported stomach symptoms as an entry criterion), the study does not provide accurate on GORD prevalence in the population. About one quarter of the dyspeptic subjects indicated that their symptoms are relieved by defecation. An unexpected observation was the association between relief by eating and relief by defecation. Although the former is classically known to be associated with peptic ulcer disease or ulcer-like dyspepsia, and the latter to irritable bowel syndrome, there are no obvious arguments that the two conditions are related.
The determinants of the impact on daily life, which can be considered a surrogate marker of quality of life, were the presence of pain, early satiety and belching. The impact of dyspeptic symptoms on healthcare resource utilization is surprisingly high, as about 60% of dyspeptic subjects have consulted a physician for these symptoms, and more than once in 3/4 of the cases. A significant proportion of these underwent an upper GI endoscopy and, 71% were currently taking medication for their symptoms. The only factor predictive for the efficacy of the treatment was the presence of reflux-like symptoms. This finding is not surprising, because the majority of dyspeptics in the general population are likely to represent FD, a syndrome which, in contrast to GORD, is less responsive to the currently used drug treatments.
The analysis of risk factors found an important role for stressful life experience, a striking similarity to findings in FD. This finding is in line with recent observations suggesting that FD patients and dyspeptic subjects in the general population both associate with psychosocial disturbances.24 A second risk factor was the use of NSAIDs, and this is associated with both FD25 and organic dyspepsia, caused by peptic ulceration.26
Two major consequences of dyspepsia were studied. Weight loss was only present in a minority of subjects, but was significantly associated with specific symptoms: early satiety, pain and belching. These symptoms have been associated with the occurrence of weight loss and the presence of defective gastric accommodation and visceral hypersensitivity in tertiary care FD patients.18,20,27 The current observations are in line with recent
epidemiological studies in Australia and further establish that unexplained weight loss is not a unique feature of dyspepsia in tertiary care alone.28 Absenteeism was related to the pain score, suggesting that the presence of pain is indicative of a more severe form of dyspepsia.
Factor analysis revealed the presence of a three-factor structure underlying the dyspepsia symptom pattern in the general population. In this study, factor 1 mainly contains loadings of fullness, bloating and early satiety, factor 2 corresponds to nausea and vomiting and factor 3 corresponds to pain, heartburn and belching. These data are reminiscent of findings in tertiary care FD where four factors corresponding to fullness, bloating, to nausea, vomiting, early satiety, to belching and to pain were observed. The differential association of early satiety with the other symptoms in the respective factors is not fully understood, although it is clear from the data of Fischler et al. that both factors may share an association with a common pathophysiological mechanism, namely delayed gastric emptying.17,19 It is also striking that when a four-factor structure is forced in the analysis, which is licit according to the scree plot, factor 3 is further subdivided, into a separate factor of belching, similar to what was found in tertiary care FD.17'19 It seems thus that the symptom pattern in our general population data contains the same structure, as those in a group of severe FD patients in tertiary care. This finding also suggests that similar pathophysiological mechanisms may be present in these less severely affected individuals, thereby supporting the validity of extrapolating data from patients to non-consulters.
The cluster structure extracted from the factor scores validates the pertinence of the factor analysis. In addition, the presence of clear demographic and clinical correlations with cluster adherence further validates this classification. The striking association between cluster 3, life stress events and region of the country deserves further investigation to determine whether this is driven by cultural-linguistic or by socio-economic
characteristics in different regions.
In conclusion, our findings further confirm the high prevalence of dyspeptic symptoms in the general population. In addition, we identified an important impact of these symptoms on personal, familial and socio-economic aspects of life. Finally, we found a striking similarity between the structure of the symptoms in the general population when compared to well-identified and well-investigated FD patients.
ACKNOWLEDGMENTS
This study was supported by a sponsorship from AstraZeneca Belgium. The authors wish to thank Mrs Danielle Conem from INRA Belgium for her valuable help in the organization of the study.
REFERENCES
1 Heading RC. Prevalence of upper gastrointestinal symptoms in the general population: a systematic review. Scand J Gastroenterol Suppl 1999; 231: 3-8.
2 Haycox A, Einarson T, Eggleston A. The health economic impact of upper gastrointestinal symptoms in the general population: results from the Domestic/International Gastroenterology Surveillance Study (DIGEST). Scand J Gastroenterol Suppl 1999; 231: 38-47. 3 Moayyedi P, Mason J. Clinical and economic consequences of dyspepsia in the community. Gut 2002; 50(Suppl. 4): iv10-2. 4 Nyren O, Adami HO, Gustavsson S, Loof L. Excess sick-listing in nonulcer dyspepsia. J Clin Gastroenterol 1986; 8: 339-45. 5 Enck P, Dubois D, Marquis P. Quality of life in patients with upper gastrointestinal symptoms: results from the
Domestic/International Gastroenterology Surveillance Study (DIGEST). Scand J Gastroenterol Suppl 1999; 231: 48-54.
6 Westbrook JI, Talley NJ. Empiric clustering of dyspepsia into symptom subgroups: a population-based study. Scand J Gastroenterol 2002; 37: 917-23.
7 El-Serag HB, Talley NJ. Systematic review: the prevalence and clinical course of functional dyspepsia. Aliment Pharmacol Ther 2004; 19: 643-54.
8 Talley NJ, Stanghellini V, Heading RC, Koch KL, Malagelada JR, Tytgat GN. Functional gastroduodenal disorders. Gut 1999; 45 (Suppl. 2): II37-42.
9 Madsen LG, Wallin L, Bytzer P. Identifying response to acid suppressive therapy in functional dyspepsia using a random starting day trial - is gastro-oesophageal reflux important? Aliment Pharmacol Ther 2004; 20: 423-30.
gastroesophageal reflux disease. Scand J Gastroenterol 1998; 33: 1023-9.
11 Dent J. Definitions of reflux disease and its separation from dyspepsia. Gut 2002; 50(Suppl. 4): IV17-20.
12 Dent J, Brun J, Fendrick AM et al. An evidence-based appraisal of reflux disease management - the Genval Workshop Report. Gut 1999; 44(Suppl. 2): Sl-16.
13 Johnsson F, Roth Y, Damgaard Pedersen NE, Joelsson B. Cimetidine improves GERD symptoms in patients selected by a validated GERD questionnaire. Aliment Pharmacol Ther 1993; 7: 81-6.
14 Tack J, Caenepeel P, Arts J, K-Lee J, Sifrim D, Janssens J. Prevalence of acid reflux in functional dyspepsia and its association with symptom profile. Gut 2005; 54: 1370-6.
15 Tack J, Bisschops R, Sarnelli G Pathophysiology and treatment of functional dyspepsia. Gastroenterology 2004; 127: 1239-55. 16 Suzuki H, Nishizawa T, Hibi T. Therapeutic strategies for functional dyspepsia and the introduction of the Rome III classification. J Gastroenterol 2006; 41: 513-23.
17 Fischler B, Tack J, De Gucht V et al. Heterogeneity of symptom pattern, psychosocial factors, and pathophysiological mechanisms in severe functional dyspepsia. Gastroenterology 2003; 124: 903-10.
18 Tack J, Piessevaux H, Coulie B, Caenepeel P, Janssens J. Role of impaired gastric accommodation to a meal in functional dyspepsia. Gastroenterology 1998; 115: 1346-55.
19 Moayyedi P, Forman D, Braunholtz D et al. The proportion of upper gastrointestinal symptoms in the community associated with Helicobacter pylori, lifestyle factors, and nonsteroidal anti-inflammatory drugs. Leeds HELP Study Group. Am J Gastroenterol 2000; 95: 1448-55.
20 Stanghellini V. Review article: pain versus discomfort - is differentiation clinically useful? Aliment Pharmacol Ther 2001; 15: 145-9. 21 Bytzer P, Howell S, Leemon M, Young LJ, Jones MP, Talley NJ. Low socioeconomic class is a risk factor for upper and lower gastrointestinal symptoms: a population based study in 15 000 Australian adults. Gut 2001; 49: 66-72.
22 Corsetti M, Caenepeel P, Fischler B, Janssens J, Tack J. Impact of coexisting irritable bowel syndrome on symptoms and pathophysiological mechanisms in functional dyspepsia. Am J Gastroenterol 2004; 99: 1152-9.
23 Agreus L, Svardsudd K, Nyren O, Tibblin G. Irritable bowel syndrome and dyspepsia in the general population: overlap and lack of stability over time. Gastroenterology 1995; 109: 671-80.
24 Locke GR III, Weaver AL, Melton LJ III, Talley NJ. Psychosocial factors are linked to functional gastrointestinal disorders: a population based nested case-control study. Am J Gastroenterol 2004; 99: 350-7.
25 Holtmann G, Gschossmann J, Buenger L, Gerken G, Talley NJ. Do changes in visceral sensory function determine the development of dyspepsia during treatment with aspirin? Gastroenterology 2002; 123: 1451-8.
26 Wolfe MM, Lichtenstein DR, Singh G. Gastrointestinal toxicity of nonsteroidal antiinflammatory drugs. N Engl J Med 1999; 340: 1888-99.
27 Tack J, Caenepeel P, Fischler B, Piessevaux H, Janssens J. Symptoms associated with hypersensitivity to gastric distention in functional dyspepsia. Gastroenterology 2001; 121: 526-35.
28 Jones MP, Talley NJ, Coulie B, Dubois D, Tack J. Clustering of weight loss with symptoms of functional dyspepsia: a population-based study. Am J Gastroenterol 2008; 103: 2051-60.