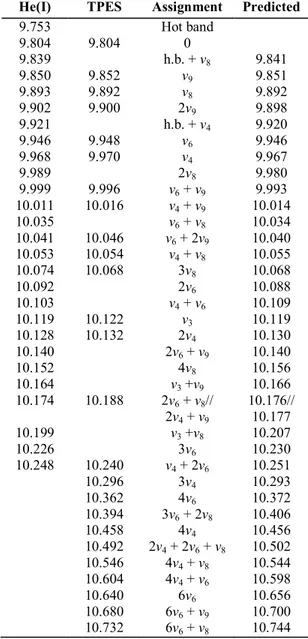
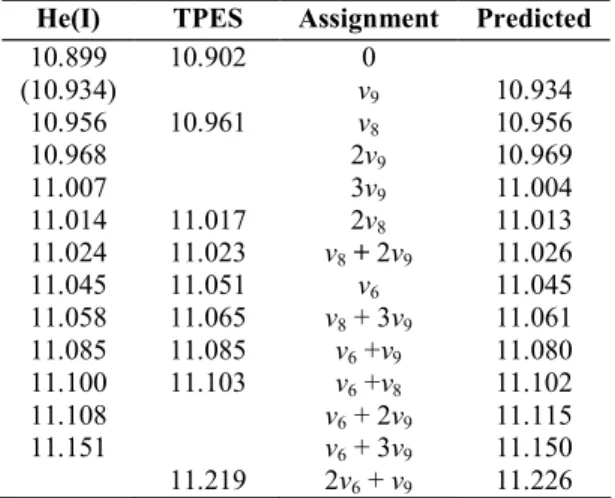
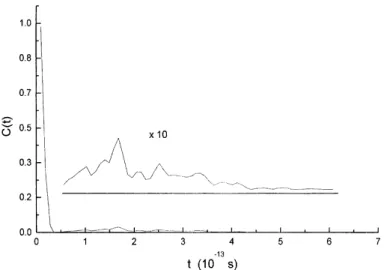
Photoelectron Spectroscopy of Vinyl Bromide and Intramolecular Dynamics of the ionic B state.
Texte intégral
Figure


Documents relatifs
After verifying that the Serre system has dispersive shock waves that are comparable with the full Euler equations, we examine the interactions of simple DSWs starting with the
(2008) a statistical analysis of the simulated response of 12 m diameter SPB to gravity wave packets propagating in the Antarctic stratosphere is used to show that momentum flux
In the Falck case, the far-sighted family champion of change Alberto Falck—with crucial support of the external CEO Achille Colombo—was able to de-escalate the family business
L’archive ouverte pluridisciplinaire HAL, est destinée au dépôt et à la diffusion de documents scientifiques de niveau recherche, publiés ou non, émanant des
Comme en temps différé, les partitions de programmes peuvent être appliquées sur le flot temps réel de façon à spécifier (par exemple) une séquence de transformations
Complète la colonne qui représente le nombre de candidats admis pour les trois écolesa. Nombres et
Although briefly introduce in Section 1.1, this section provides more detail specific to marine vessel control systems and terminology. To create the
Description The work examines comparatively MgCr2O4 oxide samples prepared by three methods (solid state reaction, sol–gel and co-precipitation within reverse microemulsion)
