Évaluation de quelques paramètres de la qualité du bois affecté par l’épidémie de la tordeuse des bourgeons de l’épinette
par Carlos Eduardo Paixão
Mémoire présenté à l’Université du Québec à Chicoutimi en vue de l’obtention du grade de Maîtrise en Ressources renouvelables
Québec, Canada
RÉSUMÉ
Les perturbations naturelles ont de gros impacts sur la dynamique des peuplements et dans la disponibilité des ressources dans la forêt boréale. Les feux et les épidémies demeurent les perturbations les plus importantes. À l’est de l’Amérique du Nord, la tordeuse des bourgeons de l'épinette - TBE (Choristoneura fumiferana Clem.) est l'un des défoliateurs les plus destructeurs de ces forêts. Au Canada, le sapin baumier (Abies balsamea L. (Mill)) et l'épinette noire (Picea mariana B.S.P. (Mill)) sont les hôtes les plus importants et les plus largement distribués. Au Québec, d’importants volumes de bois sont perdus en périodes épidémiques. Afin de minimiser de telles pertes, les usines de sciage et de pâte et papier ont généralement l’obligation de récolter ce type de bois. Toutefois, plusieurs se plaignent de la qualité marginale de ce bois qui nuit à la rentabilité de leurs opérations. Cependant, très peu d’information est disponible sur l’altération de la qualité du bois avec la progression de la durée de défoliation par la TBE. Trente-six peuplements infestés, variant d’un à quatre ans de défoliation, ont été échantillonnés dans la région du Saguenay-Lac-Saint-Jean en 2016 et en 2017 afin de déterminer si des modifications avaient été apportées au niveau physiologique et de la qualité du bois. Le potentiel et état hydrique, le taux d’humidité, la proportion d’aubier, la croissance, la densité et les propriétés anatomiques du bois formé durant les années d’épidémie ont été analysées pour les deux espèces. Nous avons observé qu’aucun changement au niveau physiologique, de la proportion d’aubier et du taux d’humidité de la tige ne s’est produit avec la défoliation. Cependant, les cernes de croissance formés durant l'épidémie présentaient une perte de volume significative et progressive avec la durée de défoliation. Une réduction de la densité du bois final a été constatée dans la deuxième et la troisième année de défoliation chez l'épinette noire et dans la troisième et quatrième année chez le sapin baumier. La densité moyenne du bois a diminué après quatre années de défoliation chez l’épinette noire. Au niveau cellulaire, dans le bois final des diminutions significatives de la paroi cellulaire ont été observées à partir de la deuxième année de défoliation chez l’épinette noire et de la troisième année chez le sapin baumier, tandis que les caractéristiques cellulaires du bois initial sont restées relativement constantes. Notre étude montre que l'infestation par la TBE réduit non seulement la croissance radiale annuelle, mais modifie aussi temporairement les caractéristiques cellulaires du bois final, ce qui a des répercussions sur la densité et la qualité du bois de l'épinette noire et du sapin baumier.
iii TABLE DES MATIÈRES
LISTE DES TABLEAUX ... V LISTE DES FIGURES ... VI LISTE DES ABRÉVIATIONS ... VII REMERCIEMENTS ... VIII
INTRODUCTION ... 1
CHAPITRE1-POTENTIELETÉTATHYDRIQUEDESARBRESDÉFOLIÉSPARLATBEET LEURINFLUENCESURLETAUXD’HUMIDITÉETLAPROPORTIOND’AUBIER ... 7
1.1 INTRODUCTION ... 8 1.2 METHODOLOGICAL APPROACH ... 10 1.2.1 STUDY AREA ... 10 1.2.2 TREE SELECTION ... 11 1.2.3 MEASUREMENTS ... 13 1.2.4 STATISTICAL ANALYSES ... 15 1.3 RESULTS ... 16
1.3.1 RELATIVE WATER CONTENT AND WATER POTENTIAL ... 16
1.3.2 MOISTURE CONTENT... 17
1.3.3 SAPWOOD AND HEARTWOOD RATIO ... 21
1.4 DISCUSSION ... 22
1.4.1 RELATIVE WATER CONTENT AND WATER POTENTIAL ... 22
1.4.2 SAPWOOD AND HEARTWOOD: MC AND AREA RATIO ... 24
1.5 CONCLUSION ... 26
CHAPITRE 2 - ÉVALUATION DE QUELQUES PARAMÈTRES DE LA QUALITÉ DU BOIS AFFECTÉPARL’ÉPIDÉMIEDELATBE ... 27
2.1 INTRODUCTION ... 28
iv 2.2.1 STUDY AREA ... 31 2.2.2 TREE SELECTION ... 31 2.2.3 MEASUREMENTS ... 32 2.2.4 STATISTICAL ANALYSES ... 35 2.3 RESULTS ... 36 2.3.1 RING WIDTH ... 36
2.3.2 MEAN ANNUAL INCREMENT VOLUME (MAI) ... 39
2.3.3 WOOD DENSITY ... 40
2.3.4 ANATOMICAL FEATURES ... 43
2.4 DISCUSSION ... 46
2.4.1 GROWTH RESPONSE... 46
2.4.2 WOOD PROPERTIES OF BALSAM FIR X BLACK SPRUCE BEFORE DEFOLIATION ... 48
2.4.3 WOOD PROPERTIES OF BALSAM FIR X BLACK SPRUCE AFTER DEFOLIATION ... 48
2.4.4 REDUCTIONS IN WOOD GROWTH X WOOD QUALITY ... 50
2.5 CONCLUSIONS ... 51
CONCLUSIONS ET IMPLICATIONS ... 53
v LISTE DES TABLEAUX
Table 1 - Structure and characteristics of the five classes of defoliation by species (D0 to D4). ... 13 Table 2 - Comparisons between control and defoliated trees for relative water content and water potential ... 16 Table 3 - Mean moisture content (MC) and standard deviation (SD) in sapwood, heartwood, and wetwood of control (D0) and defoliated trees (D1 to D4) ... 18 Table 4 - Mean moisture content for control (D0) and defoliated black spruce (D1 to D4) at 0%, 25%, 50%, 75% and 100% stem height for sapwood and heartwood. ... 18 Table 5 - Mean moisture content for control (D0) and defoliated balsam fir (D1 to D4) at 0%, 25%, 50%, 75% and 100% stem height for sapwood and heartwood. ... 19 Table 6 - Repeated measure of moisture content (MC) in a mixed model procedure... 20 Table 7 - Comparisons among defoliation class for sapwood/heartwood area ratio ... 21 Table 8 - Mixed model ANOVA results of the measured growth and wood quality parameters for black spruce and balsam fir ... 41 Table 9 - Mixed model ANOVA results of the lumen area, cell wall thickness, cell thickness, and cell number in early and latewood for black spruce and balsam fir. ... 44
vi LISTE DES FIGURES
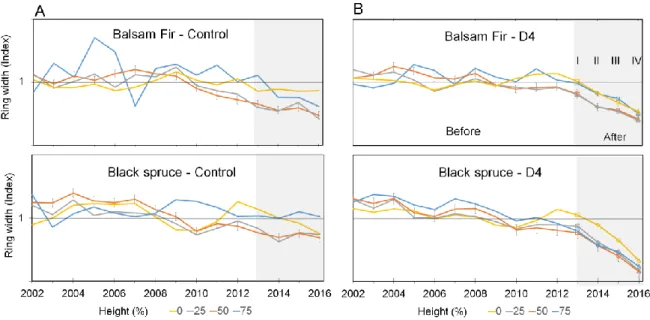
Figure 1 - Study site location in Saguenay, Lake Saint-Jean area, Quebec, Canada ... 11 Figure 2 - Tree sampling methodology for water potential, relative water content, moisture content and sapwood/heartwood ratio ... 15 Figure 3 - Relative water content (RWC % - gray bar) and water potential (Ψwp MPa - orange line) of the branches calculated for each defoliation class for (A) balsam fir and (B) black spruce ... 17 Figure 4 - Comparison of MC for balsam fir trees in (A) sapwood, (B) heartwood (>100%), and wetwood (<100%) between control trees (D0) and four years of defoliation (D4) by height (% stem height). ... 20 Figure 5 - Ratio Sapwood/Heartwood area for black spruce and balsam fir by height (% stem height). ... 21 Figure 6 - Discs section methodology for rings, density and wood anatomical measures...35 Figure 7 - Average radial growth index for the four stem heights for balsam fir and black spruce for control trees and the four defoliation classes; each different symbol represents a year of defoliation ... 38 Figure 8 - Ring width index by defoliation class for black spruce. Only significant results are presented for black spruce at the 0.05 levels. L (Light), M (Moderate), and S (Severe) ... 38 Figure 9 - Radial growth by height for balsam fir and black spruce. (A) Control trees and (B) D4 defoliation class (four years of consecutive defoliation). ... 39 Figure 10 - Annual volume loss by defoliation class for balsam fir and black spruce before and after a consecutive period of defoliation... 40 Figure 11 – (A) Latewood proportion, (B) average ring density, (C) earlywood density, (D) latewood density for black spruce and balsam fir stems before and after defoliation. ... 42 Figure 12 – (A) Lumen area, (B) cell wall thickness, (C) cell thickness, and (D) cell number in early and latewood for black spruce and balsam fir ... 45 Figure 13 - Mean cell wall thickness and cell thickness by year of defoliation for black spruce and balsam fir in early and latewood ... 46
vii LISTE DES ABRÉVIATIONS
TBE Tordeuse des bourgeons de l’épinette
SB Spruce budworm
DBH Diameter at breast height
EWD Earlywood density
LWD Latewood density
MC Moisture content
RWC Relative water content
Ψwp Water potential
viii REMERCIEMENTS
Je tiens tout d’abord à remercier exceptionnellement ma directrice, Cornélia Krause, pour sa patience, sa générosité, sa grande disponibilité tout au long de la maîtrise, même dans des moments plus difficiles pour elle. Merci Cornélia de m'avoir guidé et encouragé depuis notre premier contact, même au-delà de la maîtrise, dans la vie quotidienne à Chicoutimi. Son soutien, ses encouragements et son écoute ont fait que ce projet puisse être une expérience enrichissante pour moi. Je tiens à remercier également mon codirecteur Hubert Morin, pour toutes les connaissances et l'enthousiasme qu'il m'a transmis ainsi que sa générosité lors de mon passage toujours à son bureau. Un grand merci à Alexis Achim, codirecteur de recherche à l’Université Laval, pour ses remarques pertinentes qui ont contribué à l'enrichissement de ce travail.
La réalisation de ce mémoire n'aurait pas été possible sans l'intervention de nombreuses personnes au laboratoire d’écologie végétale qui, de près ou de loin, par des petites ou des grandes contributions, m'ont permis d'atteindre enfin le fil d'arrivée. Je profite de cette occasion pour les remercier et leur offrir toute ma reconnaissance. Merci, Alyson, Audrey, Mireille, Valérie, Florence, Émilie, Cassy, Émy, Maxence, Valentina, Karolane, Miguel, Marie-Josée, Germain, Jean-Guy, Catherine, Lorena, Angelo, Xavier, Janie, Isabel, Pascal. Je tiens à exprimer ma gratitude à vous tous qui m'ont accompagné dans ce projet. Ce sont eux qui ont fait de ce projet une expérience riche et agréable !
Je tiens à exprimer mes plus sincères remerciements à mes parents et ma famille, qui même de loin, m’ont constamment soutenu et encouragé tout au long de mon parcours.
1 INTRODUCTION
La région boréale circumpolaire représente 32% de la superficie forestière mondiale (Burton et al. 2010; FAO 2016). Elle est l'un des plus grands réservoirs de carbone organique vivant sur la planète (Terrier et al. 2012) et est également un facteur majeur dans la détermination du climat mondial (Randerson et al. 2006). Au Canada, la forêt boréale correspond à plus de 27 % du territoire et 77% du couvert forestier (NRC 2016). La dynamique naturelle de la forêt boréale est influencée périodiquement par deux principales perturbations : les feux de forêt (Cogbill 1985; Simard 2011; MacLean 2016) et les épidémies d’insectes (MacLean 1985; Stocks 1987). Plus particulièrement, la tordeuse des bourgeons de l’épinette (TBE, Choristoneura fumiferana Clem.) est l'un des défoliateurs les plus répandus et les plus destructeurs de ce type de forêt à l’est de l’Amérique du Nord (Morris 1963; Blais 1983; Lapointe 2013; MacLean 2016). En période épidémique, la TBE peut causer une défoliation sévère chez le sapin baumier (Abies balsamea (L.) Mill), son hôte principal, mais également chez l’épinette blanche (Picea glauca (Moench) Voss) et l'épinette noire (Picea mariana (Mill) BSP) (MacLean 1984; Hennigar et al. 2008).
Les épidémies sont apparues de façon cyclique tous les 30-40 ans durant le 20e siècle
(Candau et Fleming 2005; Morin et al. 2007; Boulanger et al. 2012), mais ont eu une tendance à être plus sévères et synchrones depuis le début du dernier siècle (Boulanger et al. 2012). Plusieurs variables jouent probablement un rôle pour le début et la durée des infestations : les variations de la composition forestière, l’âge des peuplements, les conditions climatiques, les feux de forêt, la sécheresse et la disponibilité des nutriments (Blais 1983; Candau et Fleming 2005; Hennigar et al. 2008; Dorion 2016).
Les peuplements de sapins et d’épinettes deviennent progressivement défoliés au cours des années en période épidémique de la TBE (Blais 1958; Dorion 2016). Les
2 dommages apparaissent d'abord sur la cime supérieure de l'arbre, limités à une perte partielle de nouveau feuillage, puis se propagent vers les branches inférieures (Carisey et Bauce 1997; Garcia 2015). Ces dommages sont intrinsèques au cycle de vie de l’insecte qui se déroule sur un an. Il compte un stade œuf, six stades larvaires, un stade chrysalide et un stade adulte (Neau 2014). La défoliation se produit durant les stades larvaires deux à six (Simard 2011). Carisey et Bauce (1997) ont démontré que lorsque l'épidémie devient sévère, les larves se nourrissent des nouvelles aiguilles et même de celles âgées d’un an. À partir de la quatrième à la cinquième année de perturbation consécutive et sévère, le développement radial de certains arbres peut être totalement interrompu, et les arbres les plus faibles peuvent mourir (Archambault et al. 1989; Garcia 2015).
Une nouvelle épidémie est en cours dans l’est de la forêt boréale (MFFP 2017). Les secteurs plus nordiques, où l’épinette noire est dominante, sont cette fois aussi affectés (Morin et al. 2007; MacLean 2016). L’épinette noire est l’espèce la plus convoitée dans l’est du Canada particulièrement pour la qualité de sa fibre. Au Québec, cette espèce contribue au statut de la province comme l’un des plus importants fournisseurs de pâtes à papier à l’échelle internationale (MFFP 2015). La défoliation par la TBE pose de grands problèmes pour l’approvisionnement de l’industrie du bois dans les régions attaquées (MFFP 2015). Selon l’accessibilité des usines, la vitesse de propagation de l’épidémie et la sévérité de la défoliation, l’approvisionnement des usines avec du bois de qualité devient une préoccupation majeure (MFFP 2015).
Le temps nécessaire pour que la défoliation cause la mort des arbres diffère entre le sapin baumier et l’épinette noire. Normalement, la mortalité chez le sapin baumier est attendue après 4-5 ans de défoliation sévère, alors que c’est plutôt après 6-7 ans chez l’épinette noire (Blais 1965; MacLean 1980; Pothier 2012). La mortalité des peuplements
3 de sapin baumier après une épidémie sévère est généralement de 42 à 50% (MacLean 1980; Bergeron et al. 1995) et les pertes de volume peuvent varient entre 32 et 48% (Archambault 1983; Ostaff et MacLean 1995). De 1975 à 2000, les infestations de la TBE ont défolié une superficie de plus de 450 M ha (MacLean 2016). Au Québec, au cours de la dernière période épidémique entre 1967 et 1992, de 139 à 238 millions de m3 de bois de
l’épinette noire et du sapin baumier ont été détruits par la TBE, dont une forte partie a pu être récupérée (Boulet et al. 1996; Marmen 2014). La récolte des arbres moribonds ou morts depuis peu permet de réduire les pertes de matière ligneuse pour l’industrie forestière (MFFP 2015). Ce type de bois est cependant plus difficile à transformer par les industries traditionnelles de sciage et de pâte à papier en raison de la détérioration de la qualité du bois (Blais 1983; Parham 1983; Bureau du forestier en chef 2015). D'un point de vue économique, le principal impact d’une épidémie est la perte en accroissement en volume annuel. Cependant, après la mortalité, en plus de cette perte directe en volume du bois, peut avoir lieu la perte de qualité du bois récolté en raison de l’attaque des insectes (Binotto et Locke 1981; Basham 1984; Koran et Nlombi 1994).
Des études ont montré qu’une série de perturbations physiologiques peuvent avoir lieu chez les plantes lors de la perte de feuillage (Reich et al. 1993; Clancy et al. 1995; Smith et Hinckley 1995). Par exemple, la quantité d’eau qui circule dans les cellules suite à la défoliation change et modifie le niveau photosynthétique des plantes défoliées (Kolb et al. 1999; Hart et al. 2000; Lavigne et al. 2001; Quentin et al. 2012; Jacquet et al. 2014). Ces changements peuvent, à leur tour, entrainer des modifications au niveau du transport d’eau dans l’arbre et le taux d’humidité dans la tige (Blais 1983; Gartner 1995; Pallardy et al. 1995). Les altérations du taux d’humidité dans la paroi cellulaire sont connues pour affecter divers processus dans l’industrie papetière (la brillance du papier, le facteur de déchirure, le traitement de fabrication de la pâte), mais peuvent également être un paramètre très
4 important pour les propriétés du bois de structure (Bowyer et al. 2003; Forest Products Laboratory 2010; Passarini 2011).
Par ailleurs, la densité du bois a un impact majeur sur le rendement, la qualité et la valeur des composites à base de bois et des produits en bois massif (Zhang 2004; Shi et al. 2007). Le principal facteur contribuant à la densité du bois est le rapport entre l’épaisseur des parois et la surface du lumen des cellules (Zobel et Buijtenen 1989). Cette densité est beaucoup plus faible dans le bois initial que dans le bois final (Zobel et Buijtenen 1989; Ivkovich et al. 2002). Chez les conifères, il existe généralement une relation négative entre la densité du bois et le taux de croissance (Zhang et al. 1996; Koga et Zhang 2002; Vincent et al. 2011). Cela suggère que des changements au niveau de la croissance radiale de la tige entraînés par la défoliation peuvent se traduire par des différences dans l'épaisseur de la paroi cellulaire, ainsi que du pourcentage du bois final, résultant en des changements dans les propriétés mécaniques du bois (Krause et al. 2010).
Au long de la période de croissance, différentes étapes et sources d’énergie sont nécessaires pour la formation du bois. En début de période de croissance, le bois initial dépend principalement des réserves stockées lors des périodes précédentes de croissance (Deslauriers et al. 2003; Lupi et al. 2010). Ces réserves sont le résultat de la pleine capacité photosynthétique de l’arbre, qui est capable d’approvisionner leur métabolisme et en plus de stocker des réserves (Smith et Hinckley 1995). L’inverse est observé pour la différentiation des trachéides du bois final. Pour ces cellules, l’énergie nécessaire vient des ressources provenant de l’activité photosynthétique de la période de croissance en cours (Reich et al. 1993; Fajardo et al. 2013). Ainsi, la perte de feuillage peut directement affecter les propriétés du bois final et indirectement les propriétés du bois initial avec l’épuisement des réserves (Schweingruber 1979; Krause et Morin 1995a). Par exemple, Vejpustkova et
5 Holusa (2006) ont observé que la défoliation consécutive des mélèzes par Cephalcia lariciphila avait causé une réduction de la croissance et également une réduction de la densité du bois final à cause des changements anatomiques du bois. Axelson et al. (2014) ont détecté le même phénomène chez les Douglas défoliés par la Choristoneura occidentalis.
Dans ce contexte, il devient essentiel d’évaluer les changements physiologiques de l’arbre selon un gradient d’intensité et de durée de défoliation. Établir une relation entre ces modifications et la qualité du bois est de première importance pour l’industrie. Pour ce faire, deux facteurs relatifs à la physiologie des arbres défoliés (potentiel hydrique et contenu relatif en eau) et cinq paramètres de qualité du bois (taux d’humidité, proportion d’aubier, volume annuel, densité et anatomie du bois) ont fait l’objet de cette étude. Ceci permettra d’établir le lien entre la défoliation par la TBE, les impacts physiologiques et les paramètres de qualité du bois.
Plusieurs hypothèses ont été émises : suite à la diminution de la biomasse des aiguilles par la défoliation, il y aurait une réduction dans la translocation de l'eau et des nutriments des branches et des aiguilles restantes (1). La réduction du besoin en eau diminuerait alors la translocation en eau dans la tige, se traduisant ainsi par des réductions au niveau de l’aubier le long de la tige et du taux d’humidité du bois. La baisse de la quantité d’eau sera plus importante avec une augmentation de la durée de la défoliation (2). De plus, la diminution de la biomasse foliaire mènera à une baisse de la croissance radiale, particulièrement dans le bois initial, lieu de transport de l’eau (3). Les modifications de la croissance radiale changeront la masse volumique moyenne du bois (4). Le manque de sucres changera aussi l’épaisseur des parois cellulaires qui influence la masse volumique du bois (5).
6 Ce mémoire est divisé en deux chapitres qui exposent les résultats obtenus sous forme d’articles scientifiques.
Chapitre I: Potentiel et état hydrique des arbres défoliés par la tordeuse des bourgeons de l’épinette et leur influence sur le taux d’humidité et la proportion d’aubier.
Ce chapitre s’intéresse à l’effet que peut avoir la défoliation sur des paramètres physiologiques des arbres défoliés (potentiel et état hydrique) et de la qualité du bois de la tige (taux d’humidité et proportion d’aubier) d’épinette noire et de sapin baumier. Quarante sites ont été échantillonnés dans la région du Saguenay Lac-Saint-Jean, avec des arbres défoliés d’une à quatre années consécutives et d’intensité de défoliation faible à élevée.
Chapitre II: Évaluation de quelques paramètres de la qualité du bois affecté par l’épidémie de la tordeuse des bourgeons de l’épinette.
Ce second chapitre porte sur les effets de la défoliation sur la croissance et les propriétés du bois des tiges d’épinette noire et du sapin baumier après la défoliation consécutive. L’accroissement annuel en volume a été calculé pour les mêmes arbres que chapitre I. La densité du bois et l’anatomie du bois ont été mesurées à partir d’une rondelle prise à 1.3 m.
7 CHAPITRE 1
POTENTIEL ET ÉTAT HYDRIQUE DES ARBRES DÉFOLIÉS PAR LA TBE ET LEUR INFLUENCE SUR LE TAUX D’HUMIDITÉ ET LA PROPORTION D’AUBIER ABSTRACT
Spruce budworm (Choristoneura fumiferana Clem.) is one of the most destructive defoliator agent of coniferous forests in eastern North America. In Canada, balsam fir (Abies balsamea L. (Mill)) and black spruce (Picea mariana B.S.P. (Mill)) are the most important and widely distributed hosts. Little is known of the impact of defoliation on tree physiology and moisture content for the two species. Thirty-six infested stands, varying from one to four years of defoliation, were sampled in the Quebec boreal forestry in 2016 and 2017 to determine whether modifications had occurred on physiological parameters of defoliated trees (potential and relative water status) and on the quality of wood (moisture content and sapwood proportion) of spruce black and balsam fir. The results show that defoliation has no effect on water status and water potential for both species. No changes were observed between defoliated and non-defoliated trees in terms of moisture content and sapwood proportion neither. Wood moisture content has been pointed out as an important parameter during the wood transformation and based on these results no changes are expected for defoliated balsam fir and black spruce.
Keywords: Spruce budworm outbreak, wood quality, Picea mariana, Abies balsamea, moisture content, sap- and heartwood proportion, relative water content.
8 1.1 INTRODUCTION
Boreal forests are widely distributed across the northern hemisphere (Bergeron et Fenton 2012; Strid et al. 2014). In eastern North America, two major types of natural disturbances periodically influence the natural boreal forest: insect outbreaks and fires (Cogbill 1985; MacLean 1985; Stocks 1987; MacLean 2016). The spruce budworm (Choristoneura fumiferana Clem.) is one of the most widely distributed defoliator agents in these ecosystems (Morris 1963; Blais 1983; Lapointe 2013; MacLean 2016). In the last century, there have been three major budworm outbreaks, causing dramatic growth reductions and stand mortality (Morin et al. 2007). Recurrent outbreaks mostly affect balsam fir (Abies balsamea (L.) Mill)) the preferred host, and with the population explosion, other coniferous trees such as black spruce (Picea mariana B.S.P. (Mill)) are damaged (MacLean 1984; Hennigar et al. 2008). However, it has been suggested that insect populations have moved further north (Morin et al. 2007; MacLean 2016), where black spruce is dominating. Thus, black spruce (Picea mariana (Mill.) BSP), which has a crucial role in the forest industry in Eastern Canada (MFFP 2015), is more and more attacked. During a typical outbreak, the insect larvae consume the new foliage of the trees, starting on the upper crown and then spreading towards the lower branches (Carisey et Bauce 1997; Garcia 2015). The outbreaks tend to occur every 30-40 years (Morin et al. 2007; Simard 2011; Boulanger et al. 2012) and last for 10-15 years (Barrette et al. 2015). An outbreak is currently affecting the Eastern boreal forest of Canada.
Several studies have shown a decrease in radial growth after defoliation periods, as a result of the repeated loss of new foliage over successive years of infestation (Blais 1962; MacLean 1984; Krause et al. 2003; Krause et al. 2012). The complete tree mortality can be observed following 4-5 years of severe infestation in balsam fir and 6-7 years in black spruce
9 (Blais 1965; MacLean 1980; Pothier 2012). However, after tree death, besides the direct loss in volume, the quality of wood harvested and of the end-use products can be altered by the infestation (Binotto et Locke 1981; Basham 1984; Koran et Nlombi 1994).
Forest product properties depend strongly on different wood characteristics that are affected by genetics, environmental and silvicultural aspects of tree growth (Zhang et al. 1996; Barnett et Jeronimidis 2003; Downes et Drew 2008). Moisture content is one of the most important properties to monitor for wood quality. It directly affects harvesting and logging operations in the field, the efficiency of numerous industrial processes, as well as the characteristics of the end-products (Ip et al. 1996; Zhang 2004; Barrette et al. 2015).
As sapwood transports water and nutrients, the moisture content of this part is higher than that of heartwood (Woo et al. 2005; Lowell et al. 2010). Thus the proportion of sapwood and heartwood has a significant impact on the moisture content of the stem (Barnett et Jeronimidis 2003). Additionally, moisture content increases with height because of the decreasing proportion of heartwood to sapwood throughout the stem (Barnes et Sinclair 1983; Ip et al. 1996).
Overall, hydraulic efficiency in a tree can be related to two factors: the sapwood efficacy and the water acquisition by the roots (Smith et Hinckley 1995). The first is directly influenced by the largest cell diameters produced in the earlywood (Deslauriers 1999; Domec et Gartner 2002; Lupi et al. 2010); and the second by the water potential gradient between the soil and the atmosphere (Tyree et Zimmermann 2002). Foliage removal disturbs various physiological processes in plants (Reich et al. 1993; Clancy et al. 1995). Studies on several tree species have shown that defoliation or browsing can have contradictory effects on water availability in plants (Kolb et al. 1999; Hart et al. 2000; Lavigne et al. 2001; Quentin et al. 2012; Jacquet et al. 2014). Water potential and relative water
10 content have been used in these studies to express water relations because it reflects changes in the balance between transpiration and water uptake (Stephens et al. 1972; Pallardy et al. 1995; Gieger et Thomas 2002).
For wood moisture content, in the last three decades, numerous studies have examined the changes arising from defoliation only after the tree death (Barnes et Sinclair 1983; Van Raalte 1983; Ip et al. 1996; Barrette et al. 2015). The relationship between duration of defoliation and wood moisture content is still poorly understood. Thus, the main objective of this study was to evaluate the effects of one-to-four years of defoliation on water relations and moisture content for balsam fir and black spruce trees during a spruce budworm outbreak. Water relations will be expressed by examining the water potential and the relative water content in the branches of defoliated trees, and wood moisture content along the stem in sapwood and heartwood. The hypotheses were that: a significant reduction in the water potential and relative water content would be observed with the increase duration of the defoliation event (1); the plant with lower water demand would present less sapwood, first in the upper crown and then in the other parts of the stem, and this would be paralleled by a decreased moisture content in the sapwood (2). The findings of this study will contribute to our understanding of the effects of spruce budworm on wood quality properties and the resilience and plasticity of the two main harvested species in Eastern North America.
1.2 METHODOLOGICAL APPROACH 1.2.1 STUDY AREA
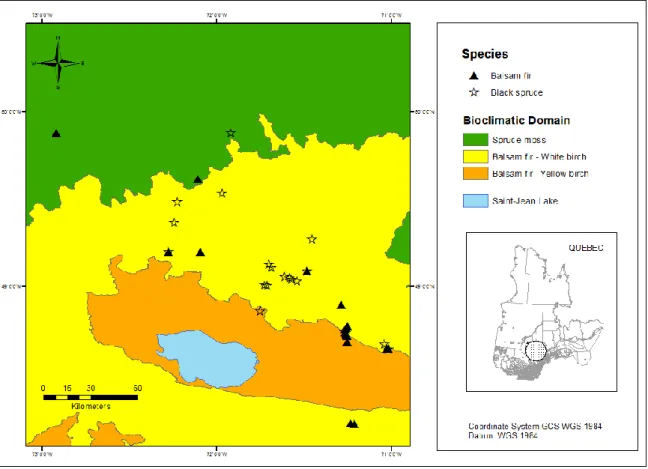
The study area covers approximately 10 000 km2 at the transition between northern
11 characterized by hills that rarely exceed 500 m, on thick and undifferentiated glacial till deposits. This area is part of balsam fir-white birch, balsam fir-yellow birch, and spruce-moss bioclimatic domain (Figure 1). The climate is continental and has a short warm summer, without a dry season. The 30-year mean annual temperature is 2.8° C and total precipitation of 930 mm, with 5-month covert by snow (Government of Canada 2017).
Figure 1 - Study site location in Saguenay, Lake Saint-Jean area, Quebec, Canada
1.2.2 TREE SELECTION
The infested areas was assessed using the spruce budworm annual aerial detection survey data from the government of Quebec (MFFP 2016; 2017). In order to delimit the sampling area, some factors were considered, such as: public lands that were not harvested in the last years, stands defoliated between one to four years of defoliation, stands within
12 150 kilometers from the Lake Saint-Jean. Finally, twenty natural stands dominated by balsam fir (Abies balsamea (L.) Mill.) and twenty-one dominated by black spruce (Picea mariana (Mill.)) were selected. At each site, representative defoliated individuals were chosen randomly among healthy trees. A visually assessment of the defoliation was made with binoculars before harvesting. The trees were sampled in the summers of 2016 and 2017 (June and early July).
Stands were divided according to the duration of defoliation in five classes: from no defoliation to up to four continuous years of defoliation. D0 represents control trees without defoliation, D4 four years of consecutive defoliation. D1, D2, and D3 represent one to three years of continuous defoliation. Additionally, a visual assessment of defoliation intensity was carried out for each sampled tree in the field. Three intensities of defoliation were used: light (25% needle loss), moderate (from 26% to 70% needle loss), and severe (more than 71% needle loss). Thus, the goal of this study is to understand the combined effects of timing and intensity of defoliation on each parameter, where each defoliation class represents the duration of consecutive defoliation, and intensity of defoliation, the degree of needle loss. Preliminary analysis showed more variation in the data between the trees with a longer defoliation lasting. For this reason, the number of harvested trees varied between the defoliation classes, with more trees to a longer defoliation period (Table 1).
Stand characterization was done including information and measurements of stand composition, slope, drainage, and soil type. Height, diameter at breast height (DBH) and crown length were also measured on 15 live trees (si) (Table 1). Soil profiles were classified into three broad categories: well drained (64 % of the study sites), moderately (20 %) and poorly drained (16 %). Two types of soils were found: podzolic (73 %) and organic soils (23
13 %). Tree age ranged from 24- to 132-year-old for the balsam fir and 29- to 172-year-old for black spruce stands (Table 1).
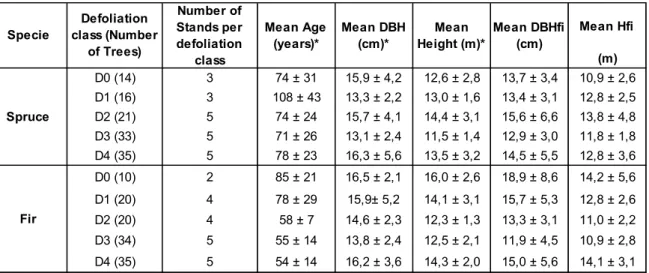
Table 1 - Structure and characteristics of the five classes of defoliation by species (D0 to D4). The number of harvested trees within classes is reported in parentheses. The data from the stand
inventory (si) including 15 trees per stand is also shown.
* Means and standard deviations per defoliation class
A total of 119 black spruce and 119 balsam fir trees were sampled. Five stem discs were collected from each tree, located at 0%, 25%, 50%, 75%, and 100% tree height (15-30 cm from terminal branch end). Two branches were also collected from each tree (Figure 2). Both discs and branches were stored in polyethylene bags and kept refrigerated until moisture content, relative water content, and water potential measurements were made.
1.2.3 MEASUREMENTS
Water potential and Relative water content
The leaf water potential (Ψwp) was obtained by a Scholander pressure chamber (Scholander et al. 1965). To determine the relative water content (RWC), measurements of fresh (immediately weighed after collecting), saturated (24 hours immersed in water) and
Mean Hfi (m) D0 (14) 3 74 ± 31 15,9 ± 4,2 12,6 ± 2,8 13,7 ± 3,4 10,9 ± 2,6 D1 (16) 3 108 ± 43 13,3 ± 2,2 13,0 ± 1,6 13,4 ± 3,1 12,8 ± 2,5 D2 (21) 5 74 ± 24 15,7 ± 4,1 14,4 ± 3,1 15,6 ± 6,6 13,8 ± 4,8 D3 (33) 5 71 ± 26 13,1 ± 2,4 11,5 ± 1,4 12,9 ± 3,0 11,8 ± 1,8 D4 (35) 5 78 ± 23 16,3 ± 5,6 13,5 ± 3,2 14,5 ± 5,5 12,8 ± 3,6 D0 (10) 2 85 ± 21 16,5 ± 2,1 16,0 ± 2,6 18,9 ± 8,6 14,2 ± 5,6 D1 (20) 4 78 ± 29 15,9± 5,2 14,1 ± 3,1 15,7 ± 5,3 12,8 ± 2,6 D2 (20) 4 58 ± 7 14,6 ± 2,3 12,3 ± 1,3 13,3 ± 3,1 11,0 ± 2,2 D3 (34) 5 55 ± 14 13,8 ± 2,4 12,5 ± 2,1 11,9 ± 4,5 10,9 ± 2,8 D4 (35) 5 54 ± 14 16,2 ± 3,6 14,3 ± 2,0 15,0 ± 5,6 14,1 ± 3,1 Number of Stands per defoliation class Mean Age (years)* Mean DBH (cm)* Mean Height (m)* Mean DBHfi (cm) Specie Defoliation class (Number of Trees) Spruce Fir
14 dry mass (48 hours in an oven at 80°C) were taken. The RWC could be expressed as a percentage of the dry mass (Morabito et al. 2006):
RWC = (fresh mass - dry mass)
(saturated mass - dry mass ) x 100
Moisture Content (MC)
Moisture content was measured by separating sap- and heartwood from ¼ sections (Figure 2). The wet and dry weight of each sample was taken with a precision of ±0.1 g. Then MC was calculated as follows (Parham 1983):
MC =(wet weight - dry weight)
dry weight x 100
For balsam fir, heartwood was divided into wet heartwood (wood > 100 % of MC) and dry heartwood (wood < 100 % of MC).
Sapwood and heartwood proportions
On each concentric disc with regular sapwood, the diameter under the bark and the heartwood diameter were measured in the one-half disc, and the sectional cross-area was calculated (Figure 2). For the lower stem part, where the limit between sapwood and heartwood was irregular, and in the cases where decay was present, the discs were scanned to measure precisely the surface using the ImageJ software (ImageJ 2012). The sapwood-heartwood boundary was established visually on fresh discs, based on the darker color of the heartwood.
15 Age
Standard method was used to archive dendrochronological data (Stokes 1968; Holmes 1983). The number of tree rings was counted for the discs at 0 % tree height.
Figure 2 - Tree sampling methodology for water potential, relative water content, moisture content and sapwood/heartwood ratio
1.2.4 STATISTICAL ANALYSES
The moisture content of defoliated (treated) and non-defoliated trees (control) were compared using a repeated measures analysis of variance (ANOVA). The MIXED procedure in SAS was used, with the estimation of the restricted maximum likelihood, and the “UN” covariance structure was applied to the model. The SLICE option of the LSMEANS statement was used when the interaction term defoliation × height was found to be significant to identify which heights differed for the control and for treated trees.
Mixed-16 models were performed to test for differences in water measurements and sapwood/heartwood ratio between defoliated and control trees. For these mixed-models, sites, defoliation lasting, and intensity of defoliation were used as fixed factors. For the random effects sites were nested to defoliation lasting. Data were log-transformed when necessary to meet the normality and homoscedasticity assumptions. All the analysis was also performed by specie. Differences between mean values were considered significant when p-value was <0.05. Statistical analyses were performed using SAS 9.4 software (SAS Institute Inc. 2013).
1.3 RESULTS
1.3.1 RELATIVE WATER CONTENT AND WATER POTENTIAL
A non-significant trend was observed in relative water content (RWC) for both species. For water potential (Ψwp), only balsam fir showed a non-significant trade (Table 2, Figure 3 AB). Balsam fir showed the mean RWC varied between 72% and 66% in defoliated trees, and water potential from -1.2 and -1.6 MPa (Table 2, Figure 3A). For black spruce, RWC increased from D0 (62%) to D2 (76%), and after decreased to 64% (D4). Water potential did not present a clear trend for black spruce (Table 2, Figure 3B).
Table 2 - Comparisons between control and defoliated trees for relative water content and water potential (Using SAS software, PROC MIXED)
DF F Pr > F DF F Pr > F Defoliation (D) 3 3.14 0.0926 3 0.23 0.8764 Intensity (IN) 2 0.65 0.5278 2 0.76 0.4733 Age 1 0.03 0.8626 1 0.53 0.4672 D x IN 5 0.57 0.7224 5 1.37 0.2444 Defoliation (D) 3 1.47 0.2757 3 1.68 0.2158 Intensity (IN) 2 0.62 0.5423 2 0.06 0.9390 Age 1 0.71 0.4016 1 0.12 0.7284 D x IN 5 0.94 0.4619 5 0.10 0.9923 Parameter Relative Water Content Water Potential
17
Figure 3 - Relative water content (RWC % - gray bar) and water potential (Ψwp MPa - orange line) of the branches calculated for each defoliation class for (A) balsam fir and (B) black spruce
1.3.2 MOISTURE CONTENT
The average moisture content (MC) in control and defoliated trees varied between 117% and 123% in the sapwood of black spruce and between 144 and 159% for balsam fir (Table 3). Mean MC of the heartwood of black spruce was stable with a percentage varied
18 from 44% to 46%. More variability was obtained for balsam fir with MC heartwood ranged from 67% to 136%. In some trees, MC of heartwood was similar to sapwood in balsam fir and named wetwood.
Table 3 - Mean moisture content (MC) and standard deviation (SD) in sapwood, heartwood, and wetwood of control (D0) and defoliated trees (D1 to D4)
Significant changes in MC were observed depending on the tree height for both species and in all the defoliation classes (Table 4, 5). The pattern of black spruce sapwood was more variable between defoliation classes (Table 4), but the general pattern showed the lowest MC at 0% stem height, followed by a gradual increased up to 75% and lower values at 100% stem height. MC values for black spruce heartwood were higher at 0%, decrease at 25% and increase gradually up to 75%. No trend was observed by increasing the duration and intensity of defoliation.
Table 4 - Mean moisture content for control (D0) and defoliated black spruce (D1 to D4) at 0%, 25%, 50%, 75% and 100% stem height for sapwood and heartwood.
Means in the same horizontal row followed by different letters are significantly different (p≤0.05). Defoliaiton class Number of trees % MC Sapwood SD % MC Heartwood SD Number of trees % MC Sapwood SD % MC Heartwood SD % MC Wetwood SD D0 14 122 17 46 11 10 144 31 69 19 116 12 D1 16 117 25 44 8 20 154 25 67 19 133 28 D2 21 122 17 46 9 20 159 25 72 18 136 28 D3 33 120 23 44 7 34 151 26 74 19 131 23 D4 35 123 18 46 12 35 155 27 68 17 124 17 Balsam Fir Black Spruce 0 25 50 75 100 0 25 50 75 D0 110 a 125 ab 133 bd 128 cd 121 ad 45 a 40 ab 48 ac 51ad D1 93 a 128 ab 139 c 126 c 141 bc 43a 36 ab 39 ab 50 a D2 112 a 118 ab 121 bd 136 c 122 ad 53a 39 c 42 b 50 a D3 109 a 122 ab 128 bc 127 c 114 a 45 a 39 b 43 a 48 a D4 118 a 120 ab 125 a 132 c 119 ab 53 a 40 c 43 b 49 a Defoliation class Sapwood Heartwood
19 For balsam fir, significant changes in MC were observed depending on the tree height for both heartwood and sapwood of control and defoliated trees (Figure 4A, B). All the classes presented the same pattern, the lowest MC at 0% stem height, followed by a gradual increase up to the middle of the stem and lower values at the top tree (Table 5). The trees attacked by the spruce budworm had a slightly higher non-significant trade of sapwood moisture content than the control trees at all measured heights (Figure 4A). The highest difference was found at 0% stem height, varying between 123% (D0) and 149% (D2) of moisture content.
Table 5 - Mean moisture content for control (D0) and defoliated balsam fir (D1 to D4) at 0%, 25%, 50%, 75% and 100% stem height for sapwood and heartwood.
Means in the same horizontal row followed by different letters are significantly different (p≤0.05). Heartwood over 100% moisture content is not presented.
Despite the changes observed for both species in the moisture content along the stem in the sapwood and heartwood, the statistical analyses do not show an interaction of the term defoliation × height (Table 6). Statistical analyses pointed out only significant differences in heartwood of balsam fir. However, the changes were not observed between control and defoliated trees, but between the different defoliation classes. Tree age was significant (P=0.0493) only in black spruce in the sapwood.
0 25 50 75 100 0 25 50 75 D0 123a 149 b 164 b 158 b 140 ab 60a 86 b 86 b 66 ab D1 133 a 163 b 168 b 166 b 150 ab 54 a 74 b 77 b 80 b D2 149 a 162 b 171 c 172 c 142 a 61 a 83 b 83 b 82 b D3 136 a 159 b 164 b 157 b 139 a 62 a 94 b 85 b 80 b D4 145 a 154 b 167 c 170 c 141 a 56 a 79 b 73 b 74 b Sapwood Heartwood Defoliation
20
Table 6 - Repeated measure of moisture content (MC) in a mixed model procedure (Using SAS software, PROC MIXED)
Figure 4 - Comparison of MC for balsam fir trees in (A) sapwood, (B) heartwood (>100%), and wetwood (<100%) between control trees (D0) and four years of defoliation (D4) by height (% stem
height). DF F Value Pr >F DF F Value Pr >F Defoliation (D) 3 0.95 0.4452 3 0.45 0.7214 Intensity (IN) 2 0.22 0.7992 2 1.72 0.1845 Height (H) 4 33,07 <.0001* 4 17.27 <.0001* Age 1 3.98 0.0493* 1 1.80 0.1821 D*H 12 1.36 0.1930 12 1.31 0.2173 D*IN*H 20 1.38 0.1394 20 0.43 0.9843 Defoliation (D) 3 1.00 0.4094 3 4.66 0.0073* Intensity (IN) 2 0.79 0.4569 2 1,27 0.2869 Height (H) 3 31.05 <.0001* 3 35.00 <.0001* Age 1 0.01 0.9191 1 0.52 0.4730 D*H 9 0.84 0.5849 9 1.78 0.0782 D*IN*H 15 0.62 0.8524 15 1.10 0.3568
Parameter Effect Black Spruce Balsam Fir
Sapwood
21
1.3.3 SAPWOOD AND HEARTWOOD RATIO
The same pattern observed in MC was also noted in the sap-heartwood ratio, the values were significantly different depending on the stem height for both species, but no effect of the interaction of the stem height was found associated with defoliation (Table 7).
Table 7 - Comparisons among defoliation class for sapwood/heartwood area ratio (Using SAS software, PROC MIXED)
Overall for black spruce, sapwood area was low at 0%, 25% and 50% of the stem height and much higher at 75%, except for D1 class (Figure 5). Whereas for balsam fir the pattern was more variable at 75%, with lowest values for D0 and D4 classes (Figure 5).
Figure 5 - Ratio Sapwood/Heartwood area for black spruce and balsam fir by height (% stem height). DF F Value Pr >F DF F Value Pr >F Defoliation (D) 3 1.67 0.2147 3 1.11 0.3729 Intensity (IN) 2 0.03 0.9707 2 1.60 0.2031 Height (H) 3 37.56 <.0001* 3 34.57 <.0001* Age 1 26.95 <.0001* 1 0.56 0.4532 D*H 9 0.38 0.9436 9 1.48 0.1527 D*IN*H 15 0.41 0.9760 15 0.63 0.8533
Ratio Sap/ Heart wood
22 1.4 DISCUSSION
A consecutive defoliation, lasting from one to four years, in different intensities had no effect in balsam fir and black spruce on either moisture content or sapwood/heartwood ratio. Moreover, repeated defoliation of the current-year needles had no effect on relative water content and water potential.
1.4.1 RELATIVE WATER CONTENT AND WATER POTENTIAL
Herbivore causes a variety of negative physiological responses in most plants (Reich et al. 1993; Clancy et al. 1995). The first immediate effect of defoliation is the reduction of plant’s capability to obtain carbon (Smith et Hinckley 1995; Deslauriers et al. 2015), which reduces the amount of available carbohydrates (Li et al. 2002). Severe defoliation can also deplete the plant’s carbohydrates reserves, so tree growth may decline, and in some cases, the tree death can occur (Reich et al. 1993; Krause et Morin 1995a; Rossi et al. 2009).
Depending on the publications, negative or positive effects were reported for water availability after defoliation (Kolb et al. 1999; Hart et al. 2000; Lavigne et al. 2001; Jacquet et al. 2014). An increase of water availability was associated with a compensatory photosynthesis mechanism following defoliation by several authors (Stephens et al. 1972; Wright et Berryman 1978; Gieger et Thomas 2002; Quentin et al. 2012). This compensatory photosynthesis mechanism in plants has been greatly discussed (Heichel et Turner 1983; Nowak et Caldwell 1984; Hoogesteger et Karlsson 1992; Ovaska et al. 1992). While it is clear that some plants can compensate in part the damages for defoliation by improved water relations, the extent and timing of this response are poorly understood (Meinzer et Grantz 1990; Ovaska et al. 1992; Hart et al. 2000). The photosynthesis stimulation after
23 defoliation has been attributed to either improved water relations, reduced foliar carbohydrate concentrations, or increased allocation of mineral nutrients (Ovaska et al. 1992; Clancy et al. 1995; Lavigne et al. 2001).
In our study the defoliation of black spruce and balsam fir did not affect water relations. However, it is possible that the water potential in this study did not represent adequately all variations in the defoliated trees since the measurements were taken at different moments during the day, over a six-week period. Inherent differences entailed by temperature and relative humidity changes along the day (expressed by the VPD) may have confused the interpretation of the data.
The typical pattern expected in plants is decreasing stomatal conductance with increasing VPD (Zhao et Running 2010). By dropping stomatal conductance to water vapor, plants can diminish water deficit and maintain the hydration of plant cells as VPD increases (Ocheltree et al. 2014). The response of stomatal aperture to VPD varies with environmental factors as light, air, and soil temperature, and soil water potential (Graham et Running 1984; Beadle et al. 1985; Goldstein et al. 1985; Pallardy et al. 1995). All those factors together become challenging to control under natural forestry conditions in northern areas defoliated by spruce budworm.
Furthermore, the influence of VPD on water potential can differ among different conifers species (Grossnickle 2000; Zhao et Running 2010; Ocheltree et al. 2014). Black spruce is described as having a direct influence on the water potential and stomatal conductance with the daily change in VPD (Grossnickle et Blake 1985; Fan et Grossnickle 1998; Grossnickle 2000). However, the balsam fir behavior in field conditions to different VPD has not been yet described. Lavigne et al. (2001) observed for the balsam fir seedling suffering artificial defoliation in controlled greenhouses conditions, no significant changes
24 in water potential to defoliation. The author suggests that these results might be due to a response of increased photosynthetic rate. In this study, for the water potential and relative water content, balsam fir presented a non-significant reduced trend when defoliation duration increased (Figure 3A).
1.4.2 SAPWOOD AND HEARTWOOD: MC AND AREA RATIO
On living balsam fir and black spruce trees, no effects of defoliation were observed on neither MC nor in the sapwood/heartwood ratio. The average moisture content (MC) in black spruce was in agreement with the literature (Krause et Gagnon 2006; Savard 2010) oscillating around 120% in the sapwood and 45% in the heartwood. Balsam fir presented slightly higher MC values, around 151% in sapwood and from 67% to 136% in the heartwood in accordance with Etheridge et Morin (1962) and Jeremic et al. (2004). The sapwood proportion increased exponentially at 75% tree height for both species. These findings are coherent with previously published results for sound trees in both species (Shmulsky et Jones 2011). Thus, the hypothesis that defoliated trees would form less sapwood area, and therefore moisture content would decrease in sapwood by the fact of lower water transported was rejected.
As expected, the MC of the sapwood was higher than that of heartwood (except for some balsam fir trees that presented wetwood). The sapwood has several primordial functions, as water storage and water transport from the roots to the foliage (Gartner 1995; Pallardy et al. 1995) whereas heartwood has only mechanical function (Woo et al. 2005; Lowell et al. 2010).
From a hydraulic point of view, trees that suffer defoliation are at a disadvantage considering they have smaller carbon reserves available for allocation to fine root
25 production. Fine roots develop an important role for water and nutrients acquisition in the tree (Pallardy et al. 1995; Schäfer et al. 2013; Deslauriers et al. 2015). Further, the amount of foliage on a tree is often strongly correlated to the amount of sapwood (Long et Smith 1988; Ryan 1989; Berthier et al. 2001). However, the period from one to four years of consecutive defoliation presented in this study apparently does not have effect in the water transport, and consequently, in the moisture content and sapwood/heartwood ratio.
After a consecutive defoliation period, the loss of foliage normally translates into changes in the formation of latewood cells, whereas the formation of earlywood cells remains unaltered (Krause et Morin 1995a; Schmitt et al. 2003). Vejpustkova et Holusa (2006) and Axelson et al. (2014) studied different insect-trees interactions in conifers species and noted important reductions in latewood anatomical features, while the cellular characteristics of the earlywood remained fairly constant. The cells of earlywood are directly related to the hydraulic role of sapwood (Deslauriers 1999; Domec et Gartner 2002; Lupi et al. 2010). This may suggest that the changes observed in the anatomical features after defoliation are not significant to reduced hydraulic efficiency in the stem, because they mainly occur in latewood cells (Vejpustkova et Holusa 2006; Axelson et al. 2014).
Furthermore, conifers species in the boreal forests have been evolving to manage challenging strategies to survive in harsh and extreme conditions by millennia (Gartner 1995; Domec et Gartner 2002; Eder et al. 2009; West 2014). It can be argued that mature balsam fir and black spruce have developed strategies to reduce the effects of the foliage loss in some physiological aspects such water relations, water transport and storage into the tree during the first four years of defoliation.
26 1.5 CONCLUSION
In light of the results obtained, it can be suggested that the period from one to four years of consecutive defoliation by the spruce budworm does not have any effect on the tree water relations (water potential and relative water content), sapwood proportion and stem moisture content in balsam fir and black spruce. Thus the hypothesis of the reduction in foliage would be compensated by decreases in the water potential or relative water content into the tree, and consequently in sapwood formation and stem moisture content was rejected.
Despite the limited number of sites sampled, the analyses provided detailed information on the temporal changes in sapwood proportion and wood moisture content at different tree heights. However, we are aware that our results require additional investigations to be validated with extensive samplings involving more trees and sites. Further, future studies on the effects of defoliation in the water potential in mature trees, especially in black spruce, should be taken in pre-dawn to minimize the effects of VPD in the results.
27 CHAPITRE 2
ÉVALUATION DE QUELQUES PARAMÈTRES DE LA QUALITÉ DU BOIS AFFECTÉ PAR L’ÉPIDÉMIE DE LA TBE
ABSTRACT
Spruce budworm (Choristoneura fumiferana Clem.) is one of the most widely distributed and impressive defoliator agent of coniferous forests in eastern North America. In Canada, balsam fir (Abies balsamea L. (Mill)) and black spruce (Picea mariana B.S.P. (Mill)) are the most important and widely distributed hosts. Thirty-six infested stands, varying from one to four years of defoliation, were sampled in the Quebec boreal forestry in 2016 and 2017 to determine whether modifications had occurred in the wood quality of the infected trees. Ring growth, wood density, and anatomical characteristics of stem wood formed during the outbreak years was analyzed for both species. We determined that rings formed during the spruce budworm outbreak had a significantly and progressively loss of volume with the lasting of defoliation, reduced latewood density in the second and third year of defoliation in black spruce, and third and fourth year in balsam fir. A reduced average wood density only for black spruce after four years of defoliation was also measured. These changes were related with changes in the anatomical features. While the cellular characteristics of the earlywood remained fairly constant, significant reductions in cell wall occurred only after three years of defoliation. Our study shows that spruce budworm outbreak not only reduce annual radial growth, but also temporarily modify cellular characteristics in latewood cells, which has implications for wood density and quality in black spruce and balsam fir.
Keywords: Spruce budworm outbreak, wood quality, Picea mariana, Abies balsamea, growth reduction, wood density, lumen area, cell wall thickness, early- and latewood.
28 2.1 INTRODUCTION
The boreal forest biome covers much of the landmass of the northern hemisphere and constitutes a very large pool of the global carbon stock (Melillo et al. 1993; Dixon et al. 1994). The dynamics of the boreal forest are periodically influenced by two principal natural disturbances: fires (Cogbill 1985; MacLean 2016) and insect epidemics (MacLean 1985; Stocks 1987). In particular, the spruce budworm (Choristoneura fumiferana Clem.) is one of the most widely distributed and impressive defoliator agents in the Canadian boreal forest (Morris 1963; Blais 1983; Lapointe 2013; MacLean 2016). Since 1909 there have been three major spruce budworm outbreaks destroying hundreds of thousands of hectares of valuable forest stands (Morin et al. 2007). Damages occur at the larval stage. Spruce budworm feeds on needles and buds of balsam-fir (Abies balsamea L. (Mill)), the preferred host, and with the population explosion, other coniferous trees are damaged, such as black spruce (Picea mariana B.S.P. (Mill)) (Blais 1983; Hennigar et al. 2008). A new outbreak is currently developing in the eastern boreal forest following its usual cycle, but now it occurs in more northern areas than previous outbreaks, where black spruce, a species that is not recognized as a privileged host, is dominant (Gouvernement du Québec 2014).
Once the forest is attacked by the spruce budworm, the infested trees become progressively defoliated (Blais 1958; Dorion 2016). The damages first appears on the upper crown of the tree, restricted to a partial loss of new foliage, and then spreads towards the lower branches (Carisey et Bauce 1997; Garcia 2015). Several studies have shown a decrease in radial growth after defoliation periods as a result of repeated losses of new foliage over a number of years of infestation (Blais 1962; MacLean 1984; Krause et al. 2003; Krause et al. 2012), and consequently tree mortality following four to five years of severe infestation in the case of balsam fir, and a little longer for black spruce (Blais 1965; MacLean
29 1980; Pothier 2012). Outbreaks play a significant role in forest yield (MacLean 2016), spruce budworm typically results in an average of 42-50% stand mortality (MacLean 1980; Bergeron et al. 1995) and volume losses varying between 32 and 48 % (Archambault 1983; Ostaff et MacLean 1995). From 1975 to 2000, spruce budworm outbreaks defoliated a total area exceeding 450 M ha (MacLean 2016). In Quebec, from 139 to 238 million m3 of spruce
and fir timber was lost due to budworm during the last epidemic period between 1967 and 1992 (Boulet et al. 1996; Marmen 2014). From an economic viewpoint, volume losses are crucial. However, after tree death, besides direct losses, insect attacks can also result in reductions of quality of wood harvested from budworm-infested-stands (Binotto et Locke 1981; Basham 1984; Koran et Nlombi 1994).
Forest product properties depend strongly on wood characteristics such as ring density, modulus of elasticity (MOE) and microfibril angle (Zhang et al. 1996; Downes et Drew 2008). More specifically, wood density has a major impact on the yield, quality and value of wood-based composites and solid wood products (Shi et al. 2007). From an anatomical point of view, the major factor explaining the variation of wood density is the proportion of latewood and, specifically, cell wall thickness (Zobel et Buijtenen 1989; Ivkovich et al. 2002). This suggests that differences in cell wall thickness, as well as the percentage of latewood, should translate into changes in mechanical wood properties (Krause et al. 2010). Since the formation of the latewood tracheids is mainly dependent on the growing conditions of the current year, it may be directly affected by defoliation (Schweingruber 1979; Krause et Morin 1995a). Vejpustkova et Holusa (2006) observed in larch trees defoliated by Cephalcia lariciphila in the Czech Republic a decrease in radial growth, followed by a decrease in latewood density, as a result of latewood cell-wall thickness reduction. Axelson et al. (2014) also detected that Douglas-fir rings formed during
30 a western spruce budworm outbreak in Canada had significantly reduced ring width followed by decreases in latewood cell wall thickness and cell width.
Over the last two decades, several studies have focused on quantifying and understanding the growth losses caused by spruce budworm in balsam fir (Piene et al. 1989; Krause et al. 2003), and in black spruce (MacLean et MacKinnon 1997; Krause et Morin 1999; Krause et al. 2012), and how defoliation might affect cambium activity (Krause et Morin 1995a; Rossi et al. 2009; Deslauriers et al. 2015). However, the degree to which tree defoliation alter wood formation and in turn the wood density of balsam fir and black spruce remains unclear.
This paper aims to assess the volume loss, wood density and the variation of anatomical characteristics in black spruce and balsam-fir trees affected by the current spruce budworm outbreak. This was done by examining inter-annual changes in xylem characteristics formed during the defoliation period. The hypotheses were that: a significant volume loss would occur after the beginning of defoliation, and would be more pronounced in balsam fir than in black spruce (1); the reduced radial growth of the stem following defoliation would occur as a result of changes in anatomical structure (lumen area and cell wall thickness in earlywood and latewood) (2); thus wood density properties would also decrease following defoliation since they are highly correlated with the latewood proportion and ratio lumen area/cell wall thickness (3). The findings of the research will contribute to our understanding the effects of spruce budworm on wood quality, and the resilience and plasticity of the two main harvested species in Eastern North America.
31 2.2 METHODOLOGICAL APPROACH
2.2.1 STUDY AREA
The study area covers approximately 10 000 km2 at the transition between northern
temperate and boreal forest in Quebec, Canada (48°25’N 71°04’W). The region is characterized by hills that rarely exceed 500 m, on thick and undifferentiated glacial till deposits. This area is part of balsam fir-white birch, balsam fir-yellow birch, and spruce-moss bioclimatic domain (Figure 1). The climate is continental and has a short warm summer, without a dry season. The 30-year mean annual temperature is 2.8° C and total precipitation of 930 mm, with 5-month covert by snow (Government of Canada 2017).
2.2.2 TREE SELECTION
The infested areas was assessed using the spruce budworm annual aerial detection survey data from the government of Quebec (MFFP 2016; 2017). In order to delimit the sampling area, some factors were considered, such as: public lands that were not harvested in the last years, stands defoliated between one to four years of defoliation, stands within 150 kilometers from the Lake Saint-Jean. Finally, twenty natural stands dominated by balsam fir (Abies balsamea (L.) Mill.) and twenty-one dominated by black spruce (Picea mariana (Mill.)) were selected. At each site, representative defoliated individuals were chosen randomly among healthy trees. A visually assessment of the defoliation was made with binoculars before harvesting. The trees were sampled in the summers of 2016 and 2017 (June and early July).
Stands were divided according to the duration of defoliation in five classes: from no defoliation to up to four continuous years of defoliation. D0 represents control trees without defoliation, D4 four years of consecutive defoliation. D1, D2, and D3 represent one to three
32 years of continuous defoliation. Additionally, a visual assessment of defoliation intensity was carried out for each sampled tree in the field. Three intensities of defoliation were used: light (25% needle loss), moderate (from 26% to 70% needle loss), and severe (more than 71% needle loss). Thus, the goal of this study is understand the combined effects of timing and intensity of defoliation in each parameter, where each defoliation class represents the duration of consecutive defoliation, and intensity of defoliation, the degree of needle loss. Preliminary analysis showed more variation in the data between the trees with a longer defoliation lasting. For this reason, the number of harvested trees varied between the defoliation classes, with more trees to a longer defoliation period (Table 1).
Stand characterization was done including information and measurements of stand composition, slope, drainage, and soil type. Height, diameter at breast height (DBH) and crown length were also measured on 15 live trees (si) (Table 1). Soil profiles were classified into three broad categories: well drained (64 % of the study sites), moderately (20 %) and poorly drained (16 %). Two types of soils were found: podzolic (73 %) and organic soils (23 %). Tree age ranged from 24- to 132-year-old for the balsam fir and 29- to 172-year-old for black spruce stands (Table 1).
A total of 119 black spruces and 119 balsam firs were harvested (Table 1). Five stem discs were collected from each tree, located at tree base (0m), DBH (1.30m), 25%, 50%, 75% tree height.
2.2.3 MEASUREMENTS
Age and Growth estimation
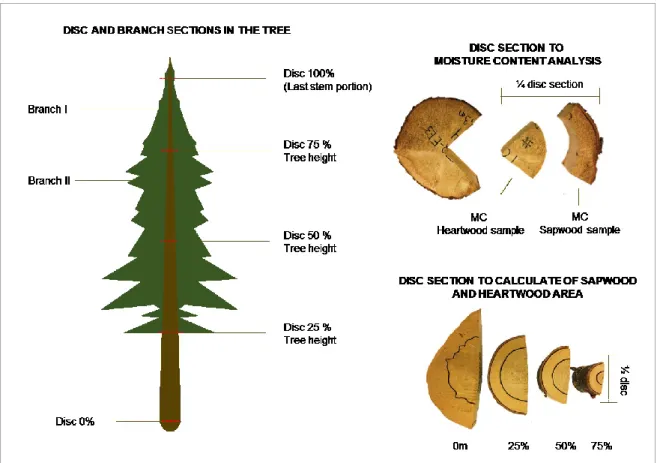
A standard method was used to archive dendrochronological data (Stokes 1968); discs were cut in half, air-dried and transversal surface cut or sanded (Figure 6). Tree-ring
33 widths were measured to an accuracy of 0.01 mm using a WinDendro measuring system (Régent Instruments Inc 2011) along two paths per disc. Crossdating was performed visually and by using the COFECHA computer program for the discs at 0 m (Holmes 1983).
To standardize the data, radial growth in the defoliated and control trees was evaluated based on the average of the growth in the last 20 years, for the respective height and defoliation class. The ring width index was calculated as follows:
Ring width index = (Annual ring width)
(20-years mean annual ring width)
To assess the growth response to defoliation, the current (CAI) and periodic (PAI) annual volume increments were assessed for each tree 15 years prior to the outbreak. The volume of a tree for one particular year was estimated as the sum of the volumes of cone sections delimited by two consecutive discs whose diameters were calculated from a quadratic mean of two radii. A linear equation of the form y1=ax1 + b was used to express
the relationship between the CAI of the stem before the infestation and the age of each defoliated tree. The mean correlation coefficient of these equations was 0.92 for black spruce and 0.95 for balsam fir. Theoretical growth (without infestation) was assessed by extrapolating this equation and the growth loss was obtained by subtracting observed growth from theoretical growth (Archambault 1983). In order to minimize the probability of overestimating the theoretical increment, only trees that had not reached their maximum current annual increment in volume were used in the analysis. Furthermore, trees with equation correlation lower than 0.85 were disregarded.
34 Wood density and Anatomical features
Wood density and anatomical measurements are time-consuming, we limited these analyses to trees with three and four years of consecutive defoliation. Furthermore, eighty breast height discs (40 fir and 40 spruce trees) were randomly chosen from 137 discs sampled. Strips of 1.63 mm thick (longitudinal) and 25 mm wide (tangential) were obtained from radial segments (Figure 6). The strips were dried to 12% moisture content and measurements were made from bark to pith at intervals of two mm, using an X-ray densitometer available at Université Laval, Quebec City, Canada. The transition from early- to late-wood within a ring was defined as the point where the maximum change in density was reached (Mothe et al. 1998; Lemay et al. 2016). Earlywood, latewood, and average ring density were measured for every annual ring of each sample. Only the data from the 11 years prior to the defoliation until the last year of defoliation were kept for the analyses.
The same eighty discs were used for the wood anatomical analyses. Wood samples containing the last five annual rings were collected. The samples were embedded in paraffin (Leica TP1020), cut into sections of 7μm with a rotary microtome (Leica RM2145), fixed on slides, and stained with an aqueous solution of 1% safranin. A camera fixed on an optical microscope was used to record numerical images at a magnification of 20×. Lumen area, cell wall thickness, cell width, and cell numbers were measured in each ring on three radial files per ring using Wincell v.2010 (Deslauriers et al. 2003).
35
Figure 6 - Discs section methodology for rings, density and wood anatomical measures
2.2.4 STATISTICAL ANALYSES
All statistical analyses were performed using the software SAS, version 9.4 (SAS Institute Inc. 2013). The MIXED procedure in SAS was used, with the estimation of the restricted maximum likelihood, and the “UN” covariance structure was applied to the model. For the growth analysis, mixed-models were performed to test for differences in growth between individual years of defoliation (2013-2016), the eleven years prior to defoliation (2002-2012) and the last fifteen years in non-defoliated control trees (2002-2016). Individual years had to be significantly different from both, control and non-defoliated periods, to reject the null hypothesis. The following fixed effect factors were used in the mixed-models: defoliation class (D), intensity of defoliation (IN), year of the growth ring, the respective year of defoliation during the formation of growth ring (Y), and the stem height (H) for ring width