RECRUTEMENT ET PRODUCTIVITÉ DE LA MOULE BLEUE (MYTILUS SPP.) SUR LES BOUÉES DE NAVIGATION POUR L'ENSEMBLE DU SYSTÈME DU
SAINT -LAURENT (ESTUAIRE ET GOLFE), CANADA
MÉMOIRE PRÉSENTÉ À
L'UNIVERSITÉ DU QUÉBEC À RIMOUSKI COMME EXIGENCE PARTIELLE
DU PROGRAMME DE MAÎTRISE EN OCÉANOGRAPHIE
PAR
V ALÉRIE BÉLANGER
Avertissement
La diffusion de ce mémoire ou de cette thèse se fait dans le respect des droits de son auteur, qui a signé le formulaire « Autorisation de reproduire et de diffuser un rapport, un mémoire ou une thèse ». En signant ce formulaire, l’auteur concède à l’Université du Québec à Rimouski une licence non exclusive d’utilisation et de publication de la totalité ou d’une partie importante de son travail de recherche pour des fins pédagogiques et non commerciales. Plus précisément, l’auteur autorise l’Université du Québec à Rimouski à reproduire, diffuser, prêter, distribuer ou vendre des copies de son travail de recherche à des fins non commerciales sur quelque support que ce soit, y compris l’Internet. Cette licence et cette autorisation n’entraînent pas une renonciation de la part de l’auteur à ses droits moraux ni à ses droits de propriété intellectuelle. Sauf entente contraire, l’auteur conserve la liberté de diffuser et de commercialiser ou non ce travail dont il possède un exemplaire.
A V ANT -PROPOS
Cette thèse est le fruit d'un travail de recherche combinant des données récentes que j'ai récoltées sur les bouées de navigation de la garde côtière et de bases de données historiques issues des mêmes bouées. Toutefois, les variations entre les méthodes d'échantillonnage ont limité les conclusions tirées.
Le présent mémoire est rédigé en deux langues, soit le français et l'anglais. Le cœur du travail a été rédigé en anglais afin d'être soumis à une revue de publication primaire anglophone dans le domaine de la biologie marine.
Les résultats présentés dans ce mémoire ont déjà été présentés en fragments à différentes occasions. En effet, j'ai eu l'occasion de présenter mes travaux sur les plans international et régional à différentes occasions. Une première partie de mes résultats ont été exposés sous forme d'affiche à Halifax en Nouvelle-Écosse (Canada) lors de 1'« ICES Annual Science Conference 2008 )} et une autre sous la forme d'une présentation orale en 2009 lors du «European Marine Biology Symposium)} (EMBS) à Liverpool en Angleterre. De plus, j'ai vulgarisé mon projet lors des colloques de vulgarisation scientifique «La Biologie dans tous ses ÉtatS)} à Rimouski en 2008 et 2009, lors du colloque JSTE à Québec en 2008 et lors de la réunion annuelle du RAQ en 2008. Pour chacune de ces présentations, j'ai remporté le prix de la meilleure présentation. Ainsi, mon mémoire n'est pas une première divulgation des résultats obtenus dans le cadre de ma maîtrise, mais plutôt l'intégration de l'ensemble des analyses et conclusions tirées.
Ce mémoire se veut donc l'aboutissement final de trois années de travail acharné. En plus de réaliser un travail de recherche pour mon mémoire de maîtrise, j'ai eu la chance de participer à deux stages qui m'ont fait grandement progresser dans le domaine de la recherche lors de ma formation. Le premier, réalisé à l'Oregon Stage University dans le laboratoire de Bruce Menge, m'a permis de me familiariser avec le travail de terrain sur le littoral établi depuis de nombreuses années sur les côtes de l'Oregon aux États-Unis. Le second, réalisé à Paris en France à l'École Normale Supérieure, m'a permis de développer une certaine expertise dans le domaine de la synchronie spatiale et d'autres analyses spatiales. Le mémoire présenté est donc imprégné de ces expériences personnelles effectuées dans le cadre de ma maîtrise.
REMERCIEMENTS
Dans un premier temps, je tiens à remercier mon directeur Philippe Archambault. Sa confiance en moi en me proposant un projet de maîtrise passionnant m'a permis de poursuivre des études supérieures. Son éternel optimisme et ses encouragements ont été d'un soutien inestimable. De plus, il m'a permis de participer à la mission multispécifique à bord du Teleost, une expérience très enrichissante. Je tiens aussi à remercier mon codirecteur Ladd Johnson pour ses nombreux conseils et le temps passé à travailler la qualité linguistique de mon article, me permettant de le rédiger en anglais.
Je remercie aussi Frédéric Guichard pour sa grande collaboration dans le projet. Ses idées ont mené ma maîtrise plus loin. De plus, son accueil en France m'a permis de réaliser des analyses spatiales consolidant ainsi le projet et mes connaissances personnelles.
De plus, je ne peux passer sous silence l'accueil de Bruce Menge et de son laboratoire à 1'« Oregon State University» en Oregon aux Etats-Unis. Le stage réalisé dans cette autre université m'a permis d'acquérir de nombreuses connaissances de terrain en milieu côtier en plus d'améliorer mon anglais. Enfin, les discussions en lien avec mon projet m'ont amenée à adopter une vision beaucoup plus large des possibilités qu'il offrait.
Je désire aussi témoigner ma reconnaissance à tous les membres du comité stratégique dans lequel mon projet de maîtrise s'insère pour leurs commentaires. De plus, je désire remercier le CRSNG et le RAQ pour leur soutien financier.
Un merci particulier à mes collègues et amis, Mélanie Lévesque, Annie Séguin, Mylène Bourque, Reynald Belley, Cindy Grant, Nicolas Le Corre, Charlotte Roby et Laure de Montety qui ont contribué à mon projet par des discussions, des conseils, de l'aide sur le terrain et leur support moral.
Enfin, je désire remercier mes parents, mon frère et ma sœur ainsi que mon copain Dany Thibault qui m'ont encouragée à persévérer dans mon projet de maîtrise et qui ont écouté mes histoires de benthos à multiples reprises, au cours des deux dernières années.
RÉsUMÉ
La majorité des études se penchant sur les mécanismes responsables des patrons
spatiaux formés par des espèces benthiques s'intéressent aux rôles des facteurs
environnementaux. Lorsque l'environnement est insuffisant pour expliquer ces patrons, les
interactions biologiques telles que la compétition et la prédation sont tenues responsables.
Toutefois, il a été démontré que la limite de dispersion larvaire peut aussi induire des patrons spatiaux.
Afin d'observer les phénomènes de recrutement larvaire en condition limitée de prédation à très grande échelle dans l'estuaire et le golfe du Saint-Laurent (EGSL), Canada, les bouées de navigation de la Garde Côtière sont utilisées comme collecteurs. Chaque automne, ces bouées sont retirées de l'eau et nettoyées par la Garde Côtière Canadienne afin de les préserver contre les glaces. En 2005 et 2007, des échantillons quantitatifs du recrutement des moules bleues ont été recueillis sur plus de 150 bouées de navigation mouillées de mai à novembre dans diverses zones de EGSL.
Nos objectifs sont d'identifier les mécanismes responsables de la distribution
hétérogène du recrutement des moules bleues sur les bouées. Nous avons analysé la
synchronie afin de détecter la limite de dispersion larvaire et l'importance des paramètres environnementaux sur le recrutement.
Nos analyses des données de 2007 suggèrent que la taille des agrégats dans la partie sud (>lOOkm) est supérieure à celle de la zone nord (-20km) du système. La comparaison des patrons biologiques avec ceux de l'environnement montre des similarités entre les deux, expliquant ainsi, au moins en partie, la structure en agrégats des paramètres de recrutement. Des régressions linéaires multiples permettent de conclure que près de 50% de la variation de la distribution des recrues de moules de EGSL est expliquée par les paramètres abiotiques. D'un autre côté, la compétition et la prédation ne semblent pas être des facteurs principaux dans le système. Enfin, des données historiques récoltées sur
certaines des bouées de navigation associées à nos données récentes permettent d'analyser
la variabilité temporelle des patrons spatiaux.
Ces connaissances permettront de guider les décisions quant à l'instauration de zones protégées ainsi qu'au développement des industries mytilicoles dans le système du Saint -Laurent.
TABLE DES MATIÈRES
AVANT PROPOS ... II REMERCIEMENTS ... IV RÉsUMÉ ... VI TABLE DES MATIÈRES ... VII LISTE DES TABLEAUX ... IX LISTE DES FIGURES ... X LISTE DES ANNEXES ... XI
INTRODUCTION GÉNÉRALE ... 1
ABSTRACT ... 9 1.1 INTRODUCTION ... 10 1.2 METHODS ... 13 1.2.1 Study area ......... 13 1.2.2 Collectors ...... 13 1.2.3 Sampling ... 15 1.2.4 Historical data ... 15 1.2.5 Environmental parameters ...... 16 1.2.6 Data analysis ...... 17 1.2.7 Population interactions ...... 21 1.3 RESULTS ... 22
1.3.1 Blue mussel density, biomass and maximum size in 2007 ... 22
1.3.2 Multiple linear regressions ... 25
1.3.3 Autocorrelation of environmental parameters ... 25
1.3.4 Autocorrelations of biotic pa ra meters ... 28
1.3.5 Covariogram ...... 30
1.3.6 Predation ... 31 1.3. 7 Competition ...... 32
1.4 DISCUSSION ... 33 1.4.1 Spatiotemporal stabiliiJ' .......... 33 1.4.2 Synchrony ... 34 1.4.3 Environmental parameters ...... 36 1.4.4 Dispersal limitations ................... 40 1.4.5 Biotic interactions ...... 42 ACKNOWLEDGMENTS ...•.•...•..•...•...•..•...•... 43 CONCLUSION GÉNÉRALE ... 44 Hétérogénéité spatiale .................... 44 Synchronie ... 45 Limites de la dispersion ...... 45 L'effet de Moran ...... 48
Mécanismes autres que la dispersion ...... 49
Paramètres environnementaux ............ 49
Prédation et compétition ...... 53
Aquaculture ...... 55
Autres perspectives ...... 57
LISTE DES TABLEAUX
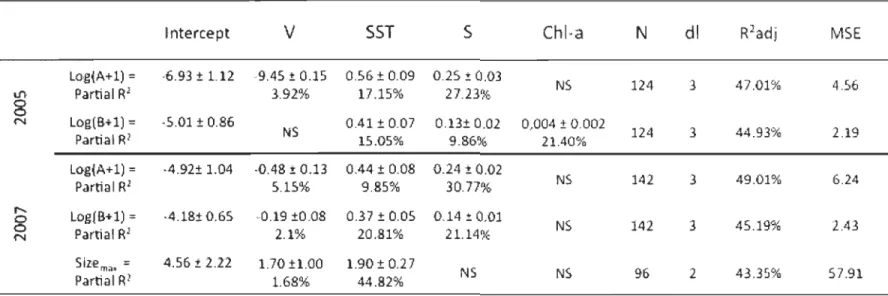
Table 1. Results of multiple linear regression models (AIC procedure) used to estimate
density (A, mussels by 100cm-2), biomass (B, mussels by 100cm-2) and maximum size (Sizemax) among EGSL navigation buoys in 2005 and 2007. Maximum CUITent velocity
01
,
cm2s-1), mean surnmer sea surface temperature (SST, OC), mean salinity (S, PSU) and mean surnmer chlorophyll a (Chl a;mg.m-3) were variables in regression models. Partial ~ below each regression coefficient (±SE); NS : not significant ; N = number of data inc1uded. Unbiased R2 (R2 adj) are shown; MSE : Mean squared errors ............................ 24
Table 2. Slope of linear regression between log (density) and log (biomass) in different regions of the estuary and Gulf of St. Lawrence (EGS= Sourthern Gaspé water; CN=North Coast; EM=Lower St. Lawrence Estuary; IPE= Prince-Edward-Island; IM= Magdalen Islands) ... 32
LISTE DES FIGURES
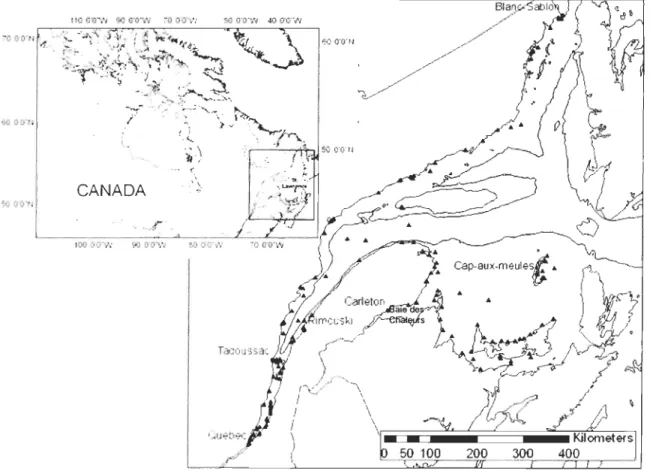
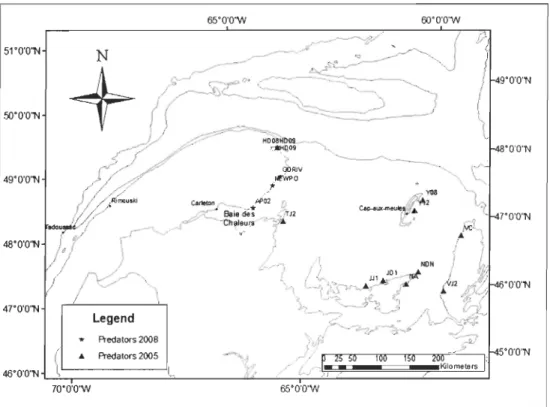
Figure 1. Location ofbuoys sampled in 2005 and 2007 in the St. Lawrence system ... 14
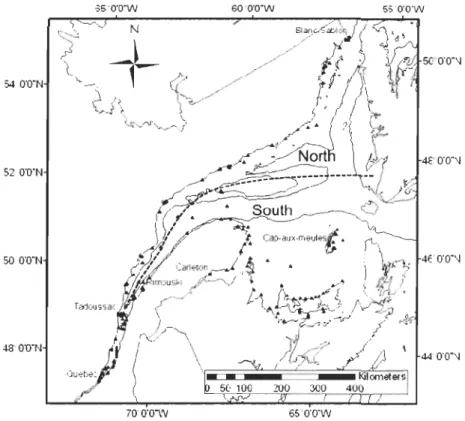
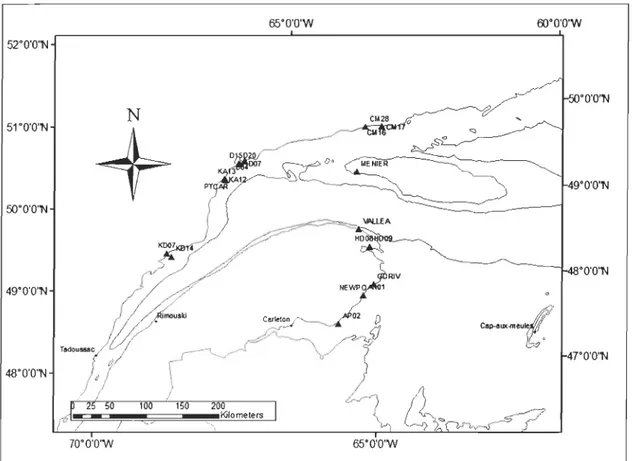
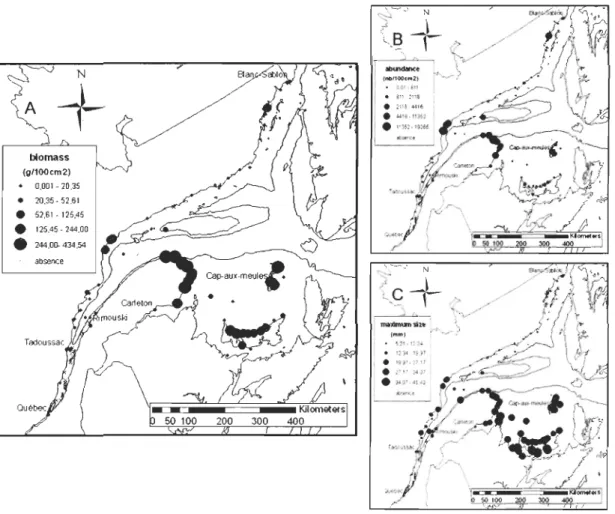
Figure 2. North and South division of St. Lawrence system for spatial autocorrelation analysis ... 18 Figure 3. The 22 buoys sampled between 1980 and 1985 (except 1982) and in 2007 and 2008 ... 20 Figure 4. Blue mussel (a) density (mussels.100cm2) (b) biomass (g.100cm2) and (c)
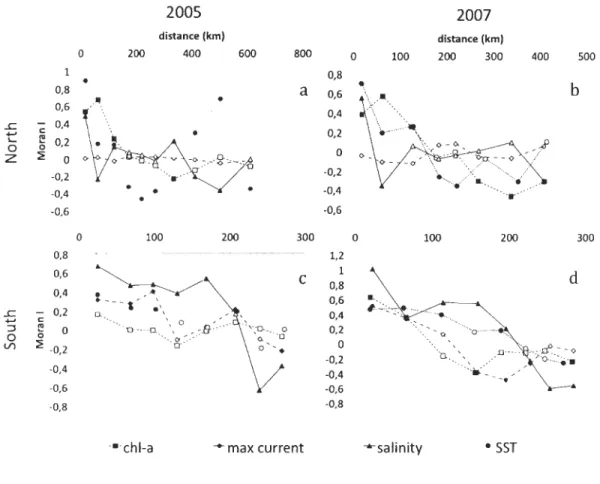
maximum size (mm) observed on navigation buoys in EGSL, 2007 ... 23 Figure 5. Moran's l index correlogram of mean summer chlorophyll a (ChI-a), maximum
CUITent velocity (max CUITent), summer sea surface temperature (SST) and mean salinity (salinity) of EGSL, (a) 2005, northem area; (b) 2007, nOrthem area; (c) 2005, southem area and (d) 2007, southem area. Full symbols indicate statistically different from 0 at
a ::;
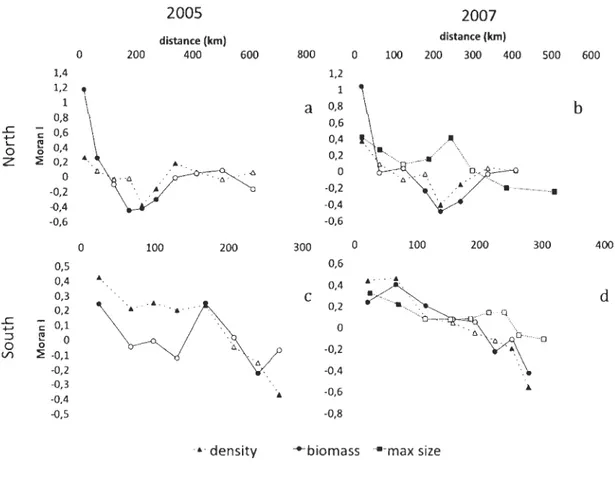
0.05 ... 27 Figure 6. Moran's l index correlogram of density, biomass and maximum size (a) 2005,northem area; (b) 2007, northem area; (c) 2005, southem area and (d) 2007, southem area. Full symbols indicate statistically different from 0 at a::; 0.05 .... 29
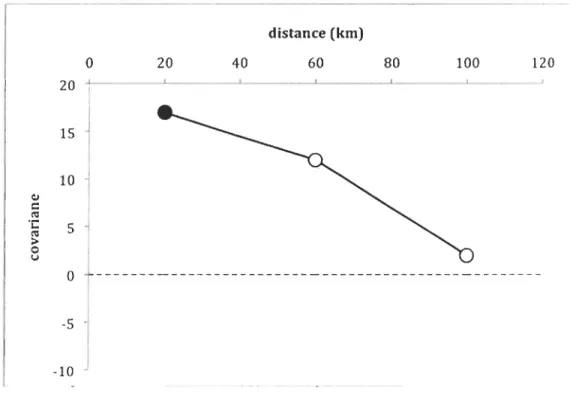
Figure 7. Covariance between temporal series (7 years) of maximum size observed on 22 buoys in relation to the geographic distance that separated them. Filled symbols indicate statistically different from 0 at a ::; 0.05 after 10,000 Monte Carlo permutations ... 30 Figure 8. Presence of predation by the seastar Asteria vulgaris on navigation buoys in 2005 and 2008 ... 31
LISTE DES ANNEXES
Annexe 1. Position des bouées échantillonnées en 2005 et 2007 ... 71 Annexe 2. Positionnement des quadrats échantillonnés sur une bouée type ... 74 Annexe 3. Séries temporelles des tailles maximales (mm) observées sur 26 bouées de navigation du Saint-Laurent ... 75
INTRODUCTION GÉNÉRALE
L'organisation spatiale des espèces biologiques est un phénomène suscitant beaucoup d'intérêts chez les écologistes. La régularité de certains patrons est spectaculaire et plusieurs chercheurs désirent comprendre les phénomènes contrôlant l'apparition de ces derniers. Dans d'autre cas, en absence de régularité, l'espace est occupé de manière hétérogène par une ou plusieurs espèces. Quels sont les mécanismes qui régissent l'apparition de ces patrons biologiques dans l'espace, voilà une question explorée depuis de nombreuses années. Les processus physiques et biologiques affectant la distribution et l'abondance du recrutement des moules bleues (Ekman, 1996) sont étudiés afin de déterminer leur rôle et leur importance.
L'étude des phénomènes de synchronie en écologie permet d'expliquer les
interactions entre la dynamique des populations et les variations environnementales extrinsèques (Grenfell et al., 1998 et Blassius et al., 1999). Trois hypothèses ont été identifiées comme pouvant conduire à l'apparition de patrons de synchronie spatiale dans différents systèmes, soient (1) la présence de prédateurs nomades, (2) la dispersion et (3) la synchronie environnementale (Koeing, 1999).
Dans un premier temps, les paramètres environnementaux ont été identifiés. En effet, la quantité et qualité des ressources alimentaires, la température, la salinité et l'hydrodynamisme sont des paramètres affectant le recrutement des moules bleues (Bayne, 1976). Lorsque ces paramètres sont dans un cadre optimal, le recrutement atteint sa capacité maximale, alors que dans des conditions limitantes, il est plus faible.
D'un autre côté, des phénomènes d'interaction tels que la compétition et la prédation peuvent contrôler les populations de moules en limitant l'arrivée de nouveaux individus ou en éliminant certains individus (Menge, 1992; 2000).
Par ailleurs, les effets des paramètres environnementaux (<< bottom-up ») sont
intimement liés aux processus de prédation et de compétition (<< top-down ») et ils peuvent
affecter la structure de la communauté (Menge, 2000).
Les théories élaborées dans les écosystèmes marins afin d'expliquer la dynamique régionale des métapopulations sont presque exclusivement basées sur l'importance de
l'environnement (Gouhier et al., 2010). En effet, les données sont plus difficiles à observer
qu'en milieu terrestre et le potentiel de dispersion des espèces est beaucoup plus grand en
milieu marin. TI est non négligeable de considérer le grand pouvoir de dispersion de la
plupart des larves d'invertébrés benthiques. Ce grand potentiel est contrôlé par les courants
de l'océan et la durée du cycle larvaire affectant nécessairement les patrons d'abondance
via les processus de recrutement (Gaylord et Gaines, 2000). Ceci entraîne donc des
difficultés importantes lorsque l'on désire observer la dispersion des larves et de là découle
l'hypothèse que les océans étaient complètement fermés ou ouverts (Roughgarden et Iwasa,
1986; Roughgarden et al., 1985).
Les anémones, les balanes et les moules sont des organismes filtreurs sessiles,
considérés comme de grands disperseurs en raison de leur stade larvaire planctonique
(Kinlan et Gaines, 2003). Les moules possèdent un stade planctotrophique d'environ 32
conditions du milieu, leur procurant une très grand pouvoir de dispersion (Gosling, 1992, Bayne, 1976). En effet, selon la salinité et l'espèce (M edulis ou M trossulus), il est possible d'observer un cycle de développement variant de 24 à 45 jours (Qiu et al., 2002). Ainsi, les larves peuvent se retrouver à plus de 100km des populations parentales qui sont sessiles (Navarette et al., 2005). Bien que la période de dispersion larvaire entraîne de nombreuses pertes de larves, cette stratégie permet aux moules recrues de s'installer sur de nouveaux sites afin de former de nouvelles populations (Thorson, 1950).
Bien que les conditions météorologiques, climatiques ou hydrodynamiques soient les principaux facteurs influençant les variations dans le recrutement des moules bleues, la fécondité des moules a été identifiée comme un autre facteur non négligeable (Hughes et al., 2003). Certaines études ont tenté d'établir un lien entre les populations adultes et les recrues observées à un même site. Par contre, aucune évidence n'a pu être observée (Hughes et al., 1999; Smith et al., 2009). Toutefois, Smith et al. (2009) ont observé une covariance-croisée significativement positive entre les sites de moules du Saint-Laurent (Mytilus spp.) séparés par 12-18 km et ceux éloignés de 24-30km. Ces résultats ont permis d'émettre l'hypothèse que les populations adultes et le pouvoir de dispersion des larves ont un rôle à jouer dans l'organisation spatiale du recrutement larvaire des moules.
D'un autre côté, une étude réalisée sur la côte ouest américaine a permis de conclure que la limite de dispersion larvaire des moules influence la dynamique spatiale des communautés côtières ainsi que la distribution des abondances de moules observées sur la côte (Gouhier et al., 2010). Cette étude a considéré des données récoltées sur un segment
de plus de 1800 km ainsi qu'un modèle de métapopulation. Dans les deux cas, la
conclusion tirée est la même, soit que la dispersion larvaire est limitante. Ainsi, si la dispersion des larves est limitée (Shanks et al., 2003), la connectivité intervient dans les
variations spatiales à très grande échelle et modifie les patrons de distribution spatiale. Le
cadre de l'étude de Gouhier et al. (2010) permet aussi de quantifier l'échelle de dispersion,
de prédire les patrons régionaux de certaines abondances d'espèces et de déterminer
l'importance relative de la régulation locale et des forçages environnementaux dans la
dynamique des métapopulations.
Afm d'appliquer cette méthode à une plus grande échelle, il serait intéressant de la tester sur un milieu complètement différent, soit le système du Saint-Laurent. En effet, dans
cet environnement, la moule bleue est aussi une des principales espèces sessiles retrouvées
(Fradette et Bourget, 1980) et les conditions environnementales sont différentes. De plus,
l'étude de Smith et al. (2009) suggère la présence d'un lien spatial entre les populations
adultes et recrues du Saint-Laurent, probablement contrôlé par la dispersion larvaire.
En général, les études portant sur la colonisation d'espèces benthiques ayant un
stade larvaire sont réalisées en zone interdidale (Smith et al., 2009; Johnson et Geller,
2006; Jenkins, 2005; McKindsey et Bourget, 2000). Afm d'observer le recrutement larvaire
plus au large, il est possible d'utiliser des collecteurs artificiels (Archambault et Bourget,
1999; Garcia et al., 2003; Frantzen, 2007). Toutefois, cette méthode entraîne une limite
dans le nombre de collecteurs, restreignant ainsi l'échelle à laquelle l'étude est réalisée.
méthode consistant à échantillonner les bouées de navigation du golfe et de l'estuaire du Saint-Laurent.
Cette base de données est une des plus imposante dans le Saint-Laurent en ce qui a trait au recrutement des moules bleues. En effet, dès 1975, les bouées de navigation de la garde côtière canadienne ont été échantillonnées afin d'avoir une image d'ensemble du recrutement saisonnier des espèces benthiques à une large échelle spatiale (Fradette et Bourget, 1980). L'utilisation des bouées de navigation offre un grand nombre d'avantages tels qu'une standardisation de la profondeur, du substrat et de la durée d'immersion (Bourget et al., 2003). De plus, étant donné que les bouées sont retirées sur une brève période de temps à l'automne, les échantillons récoltés sont comparables. Enfin, puisque la garde côtière entrepose ses bouées à quai pour l'hiver, il est possible de couvrir une très grande superficie de l'estuaire et du golfe du Saint-Laurent sans avoir à se déplacer à chacune des bouées, mais seulement en fréquentant quelques ports. Puisque les bouées sont nettoyées annuellement lors de l'entreposage hivernal, les espèces présentes sur les bouées sont le reflet du recrutement annuel en considérant l'intégration des interactions
biologiques lors de la période d'immersion.
À partir de cette base de données de 1975 à 1985, différentes études ont été menées afm de comprendre la variation temporelle et spatiale du recrutement (Fradette et Bourget, 1980; 1981; Ardisson et Bourget, 1992; 1997; Bourget et al., 2003). Ces études ont montré que l'abondance et la biomasse observées sur les bouées de navigation varient sur
l'ensemble de la zone d'étude créant ainsi une hétérogénéité spatiale dans la distribution du recrutement des moules (Ardisson et Bourget, 1991).
Plus récemment entre 2005 et 2008, des échantillons ont été récoltés sur les mêmes bouées de navigation (Annexe 1). Toutefois, l'échantillonnage a été effectué d'une manière plus standard, soit en prélevant trois quadrats situés toujours au même endroit sur la bouée. (Annexe 2) Antérieurement, les quadrats étaient prélevés au maximum d'abondance et aléatoirement un peu partout sur la bouée. Toutefois, il est possible de comparer les données de tailles maximales sur de grandes séries temporelles (Annexe 3). Par ailleurs, les données récentes couvrent une plus grande superficie. La partie sud du golfe, incluant les bouées autour de l'IPE, ont été échantillonnées.
L'objectif principal de cette étude est de caractériser les mécanismes responsables de la distribution spatiale du recrutement des moules bleues sur les bouées de navigation de
l'estuaire et du golfe du Saint-Laurent à une grande échelle spatiale. Plus spécifiquement,
nous analysons la synchronie afin de déterminer les limites de dispersion et nous identifions
les facteurs (environnementaux et biologiques) responsables de la distribution spatiale du
recrutement des moules bleues dans le système. En effet, dans le cas où un patron de
synchronie différent de celui de l'environnement est observé, en absence de compétition et
de prédation, il est possible de déterminer un paramètre de dispersion donnant un indice de la limite de dispersion des larves dans le milieu.
Notre hypothèse est que les paramètres environnementaux expliqueront une part
échelle locale. En effet, des températures et des concentrations en chlorophylle a plus élevées devraient favoriser le recrutement et la croissance des moules bleues, alors que des courants plus importants la réduiraient. Finalement, la salinité ne devrait pas jouer un rôle très important, excepté dans la partie amont de l'estuaire. À cette échelle spatiale, la compétition et la prédation seraient probablement responsables de la variance non expliquée par les paramètres environnementaux, même si cela est difficile à déterminer, car ces phénomènes sont dépendants de l'environnement. D'un autre côté, à une échelle régionale, nous croyons que les limites de dispersion larvaire auront un plus grand contrôle sur le recrutement larvaire que les paramètres environnementaux. Ceci reflètera les différences d'organisation spatiale entre les paramètres biologiques et environnementaux.
Ce mémoire de maîtrise, sous forme d'article scientifique, est rédigé en partie en anglais et contient un chapitre qui devrait être prochainement soumis à la revue Marine
CHAPITRE 1
BLUE MUSSEL RECRUITMENT AND PRODUCTIVITY ON NAVIGATION BUOYS IN THE ST. LAWRENCE SYSTEM (ESTUARY AND GULF), CANADA
Valérie Bélangerl
, Philippe Archambaultl, Frédéric Guichard2, Ladd E. Johnson3
1 Institut des sciences de la mer (ISMER), 310 allée des Ursulines, Rimouski, Québec, G5L
3Al, Canada.
2Department of Biology, McGill University, 1205 Avenue Docteur Penfield, Montréal,
Québec, G5L 3Al, Canada.
3Département de biologie, Pavillon Alexandre-Vachon, 1045 av. de la Médecine,
Université Laval, Québec, Québec, G 1 V OA6, Canada
Corresponding author: philippe _ archambault@uqar.qc.ca;
KEY WORDS
Boreal ecosystems, Settlement, Spatial distribution, St. Lawrence system, Time series, Blue
ABSTRACT
Most studies on mechanisms that generate spatial patterns of the distribution of benthic species focus on environmental influences on these patterns. However, dispersal limitations could also interact with ecological processes su ch as competition and predation to create observed spatial patterns. Navigation buoys have been used as collectors to provide data on blue mussel (Mytilus spp.) recruitment at large spatial scales in the estuary and Gulf of St. Lawrence (EGSL), Canada. Quantitative samples of blue mussel recruitment were obtained in 2005 and 2007, from more than 150 navigation buoys moored each year from May through November in different regions of the EGSL. The main objective of this study was to identify the contribution of environmental determinants relative to local biotic factors, like potential dispersal limitations that generate observed recruitment patterns. Our analyses suggest a larger patch size in the southern (> 1 OOkm) than in the northern (~20km) part of the EGSL, and comparisons with environmental parameters show that they explained around 50% of this variation in mussel distribution across the EGSL. However, because of this high degree of correlation, the role of demographic connectivity could not be assessed although competition and predation seems
to play minor roles in the spatial patterns of density, maximum size and biomass observed.
Additional comparisons with historical data demonstrated that the spatial patterns of maximum size were generally stable over time. This knowledge will assist in the management of both natural and applied aspects of coastal ecosystems.
1.1 INTRODUCTION
Larval distributions and densities are affected by diverse and complex physical and biological processes (Eclanan, 1996; Archambault & Bourget, 1999). For example, environmental parameters, such as food supply, temperature, salinity and hydrodynamics can aU affect blue musse! recruitment (Bayne, 1976). However, the assumption that populations are in equilibrium with the environment can lead to problems in understanding ecological dynamic mechanisms, such as predation. Indeed, both competition and predation are biotic factors that can control musse! population (Menge, 1992; 2000). The supply of new individuals in the population can be another important biotic factor in determining population dynamics as suggested by 'supply-side' theory (Lewin, 1986). In fact, many marine benthic invertebrates can disperse from parental populations during their larval period (Grantham et al., 2003; Qiu et al., 2002), and those with a planktotrophic stage (i.e.,
a feeding form) have extended periods in the water column, giving them a high dispersal potential (Gosling, 1992). Even if meteorological, c1imatic or hydrodynamic factors are primarily responsible for explaining recruitment variation, variation in fecundity, especially at the population level, may also make substantial contributions (Hughes et al., 2003).
Sorne studies have shown the importance of larvae dispersal in density and distribution patterns of metapopulations (Cottenie, 2005). Many have reported weak link between adults and recruits over small scales (~1 OOm) (Hughes et al., 1999; Smith et al., 2009).
There is, however, evidence for linkage over larger scales (12 - 30 km; Smith et al., 2009).
Such meso-scale coupling could create temporal and spatial patterns of correlations at the regional scale.
The combination of these two elements, the abiotic environment and the ecological factors, should determine the dynamics and any synchrony that might exist between
subpopulations within an ecosystem. Studying synchrony over large spatial scales (i.e., an
order of magnitude larger than the estimated scale of dispersal) may help distinguish
between these two possibilities (Grenfell et al., 1998; Blasius et al., 1999). Specifically, the
relative importance of dispersal and environment in controlling population distributions can be determined by identifying specifie patterns in synchrony, when the individual influence
of each of these elements cannot be directly measured. For example, Gouhier et al. (2010)
analysed a 1800-km stretch of the west coast of the United States to compare a metapopulation model with field data. They found a strong signature of dispersal limitation and spatial dynamics in the regional distribution of mussel density that was independent of the large scale environmental gradient that exists along this coast. This approach can be used to quantify the scale of dispersal, to predict the regional patterns of abundance and to determine the relative importance of local population regulation and environmental forcing in the dynamics of metapopulations.
Such a framework requires, however, an extensive set of data to provide sufficient
spatial information. Since 1975, navigation buoys have been periodically sampled at the
end of each settlement and ice-free season to study the recruitment of benthic species with planktonic larval stages, such as the blue mussel, in the estuary and Gulf of St. Lawrence
(EGSL) (Fradette & Bourget, 1980; Ardisson & Bourget, 1992; Bourget et al., 2003).
over large spatial scales, although the long time series of data collected has never been used to assess the stability of this marine system over time.
Here we use both historie and contemporary data to characterize the contribution of ecological (i.e., biological) and environmental mechanisms that are potentially responsible for the patterns of recruitment of blue mussels across the EGSL over large spatial and temporal scales. More specifically, we analyzed spatial synchrony of the recruitment of mussels onto buoys to determine the importance of dispersal limitation relative to the environmental and biotic factors responsible for patterns at local and regional scales. Under stable conditions, environmental parameters should explain a larger part of the variance in blue mussel recruitment (i.e., biomass, density and/or maximum size). Of these potential environmental factors, the hypothesize tested was that blue mussel productivity will be enhanced at higher water temperatures and higher chlorophyll a, and reduced by higher CUITent velocity whereas salinity should not play an important role, except in the brackish portions of the estuary. If local ecological pro cess are strong enough to be destabilizing,
then spatiotemporal variability should be influenced to a greater extent by dispersal limitations. Autocorrelation analyses would show such a situation as specifie patterns of mussel distribution and density that differ from those observed for environmental factors.
Such an analysis provides an assessment of the relative roles of dispersal limitations and environmental controls of mussel recruitment and productivity in boreal ecosystems over regional scales.
1.2 METHODS 1.2.1 Study area
The Gulf of St. Lawrence is a highly stratified semi-enclosure sea with an approximate surface area of 226,000 km2 (Koutitonsky & Bugden, 1991; Saucier et al., 2003). The gulf connects with the Atlantic Ocean through the Cabot and the Belle Isle straits and receives freshwater inflow from the St. Lawrence River and other tributaries.
The physicochemical conditions of the gulf are relatively homogenous, but pronounced horizontal gradients are observed in the estuary (EI-Sabh, 1976) primarily in the surface layer where buoys are located. Salinity graduaUy increases from Ile d'Orléan (0)
to Rimouski (28.5) on southem shore (Lavoie, 1970), but values are lower than on north shore, a result of the Coriolis effect (EI-Sabh, 1979). In the gulf, salinity varies from 29 to
32, and temperatures increase from the northeast to the southwest. In the estuary, the
surnmer surface temperatures vary between 5 to 20°C (Saucier et al., 2003).
1.2.2 Collectors
Navigation buoys, moored each year from May through November along the shores of the estuary and Gulf of St. Lawrence (EGSL), were used as collectors as in past studies
(see Fradette & Bourget, 1980; 1981; Ardisson et al., 1990; Ardisson & Bourget 1990,
1991; Bourget et al., 2003). Because of the extensive sea ice that develops in the EGSL, buoys are removed in the faU, cleaned, and, if necessary, painted (no antifouling agents are,
colonize the buoys. Since the buoys are deployed and retrieved over short periods of time (about 2-3 weeks) each year, their use allowed us to obtain samples on a large spatial scale (Figure 1) without any confounding effects of seasonal differences in the community development across the region.
60 ODoN
;000'"
200 300
1.2.3 Sampling
Buoys sampled in 2005 (126) and 2007 (165) were distributed across the system from the brackish waters of the estuary, eastward to the Lower North Shore (Québec), the Magdalen Islands (Québec) and Prince Edward Island (PEI). A subset (28) of these were also sampled in 2008 to extend the time series for the buoys having the most historical data
(see below). For each buoy, three 10 x 10 cm2 quadrats were sampled on the underside
surface of the buoys at the three cardinal directions that were accessible. AH macroscopic organisms and associated microscopie organisms were collected with a scraper and preserved in 70% ethanol. Samples were then separated in the laboratory using either a 1-mm sieve (2005), a 0.5 mm sieve (2007), or both (2008). AlI mussels from each sample, or
a subsample when densities were high, were then counted and their wet weight (blotted dry
after 5 min) measured for each sample or subsample. The length (the maximum distance between umbo and posterior margin) of the 10 largest mussels was measured using a
vernier caliper (precision 0.01 mm) for each quadrat in 2007. No such measurements were
taken in 2005. Abundance ofpredatory species was also noted in 2005. 1.2.4 Historical data
From 1980 to 1985, between 50 to 100 buoys were sampled but only from a restricted area in the estuary and northwestem portion of the Gulf of St. Lawrence (Fradette & Bourget, 1980; 1981). The sampling protocol differed from that done in 2005-2008 in that
one quadrat sample of 10 x 10 cm was taken from the area of maximum mussel abundance
haphazardly from the submerged surfaces of the buoy. The laboratory procedures were the same as described earlier (sieve size: 1 and 0.5 mm), except that only the length of the large st mussel of each sample was measured (see Fradetle and Bourget 1980, 1981).
1.2.5 Environmental parameters
The data issued from the National Oceanic and Atmospheric Administration (NOAA) NOAA-IB (ctnlb) data stream were used by the remote sensing laboratory of the Maurice Lamontagne Institute (ML!) of Fisheries and Oceans Canada (DFO) to provide sea-surface
temperature (SST) across the study system. The resolution of SST values calculated from
ctnlb is approximately O.I°C. Means ofsemi-monthIy periods starting on the Ist and 16th of
each month from May to the end ofNovember 2005 and 2007 were used.
The hydrodynamic parameters, specifically CUITent speeds, were extracted from the estuary and Gulf of St. Lawrence circulation model (Saucier et al., 2003). Only
environmental data from 1999 were used, and thus interannual variation in circulation was
not included. Variables in this model are computed every hour with a spatial resolution of 4 x 4 km2• We used the maximum CUITent (cm.s-1) from May to November as a general
index of the degree of water motion, which can influence both larval supply and setllement
(Eckman, 1996). The mean salinity from May to November was also obtained from the
same model. Productivity was estimated from sateUite-derived estimates of chlorophyll a (ChI a) from the "greenness" of the water quantified by an Aquamodis chIorophyll sensor.
Web (http://oceancolor.gsfc.nasa.gov), and the value for the 4 x 4 km2 area m the
immediate vicinity of each buoy used in our analyses. 1.2.6 Data analysis
Multiple regression analyses
Multiple regressions analyzes were used to link abiotic parameters to biotic variables,
specifically the relationships between dependant variables (density and biomass for 2005 and 2007 and maximum length for 2007) and environmental conditions (sea surface temperature [SST], salinity, maximum CUITent velocity (cm2s-l) and Chi a (mg/m3
».
TheAIC procedure and the adjusted R2 were used to determine the best model (Quinn and
Keough, 2002). Conditions of normality, homogeneity and absence of colinearity were met. Spatial autoeorrelation analyses
Moran's 1 spatial eorrelograms were performed with SAM 3.0 (Rangel et al., 2006)
for 2005 and 2007 data, except that buoys were separated into North and South groups (Figure 2) as we assumed that there was little or no demographic exchange between them. The three off-shore buoys were inc1uded in both groups. Geographie distance matrix between all pairs of buoys was computed with Geographic Distance Matrix Generator 1.2.2. Straight-line distances between buoys were used except when obstructed by land masses in which case the total length of straight-line segments were used, which corresponds more c10sely to the minimal routes of potentiallarval exchange. The number of distance categories was determined by Sturge' s mIe, based on sample size (Legendre &
Legendre, 1998), with categories having an equal number of paired buoys in them (Sokal & Wartenberg, 1983). This equal frequency approach provides a better estimation of spatial autocorrelation at each distance. Qnly half the maximal dimension of the sampling area of correlograms can be interpreted as larger distances would include only edge points in each sample (Rossi et al., 1992). Correlograms based on Moran's 1 were performed on both biotic parameters (density, biomass and maximum size) and abiotic parameters (mean summer chlorophyll a, maximum current speed, summer SST and mean salinity).
54 O'O"N
52'O'O'N
50 O'O"N
4S0'O"N
70'O'O"W 65'O'O'W
Figure 2. North and South division of St. Lawrence system for spatial autocorrelation analyses.
Spatiotemporal analyses
Historical data from the 1980s were included to compute covariograms of spatiotemporal variation among the 22 buoys that were sampled for 7 different years between 1980 and 2008 (Figure 3). In opposite to density, maximum size is more representative of growth than recruitment. However, oniy maximum mussel size was examined because this measurement was the only one taken in an years. The covariance of temporal series between each pair of buoys was computed, and the mean covariance values for each distance category were plotted as a covariogram. For this analysis, distance categories were separated by a fixed distance, 20km, resulting in three categories as each category ("bin") must include 7 values; again the maximum interpretable distance is half the maximal distance between locations. Given the lower nurnber of buoys in this study, we did not divide them into north and south groups. The distance matrix was thus calculated based on an isotropie system, except that larvae must again be transported via straight-line segments over water and any ex change between north and south could only occur to the west of Anticosti Island (Figure 1). Significance of covariance values was tested using Monte Carlo randomization analysis (ManIey, 1991) based on 10,000 permutations (Legendre, 1993). By randomly assigning density values and recalculating covariance values, any spatial structure in the data is broken. Thus, a distribution of expected values can be used to assess the significance of our variance values.
65'O'O'W OO'O'O'W 52°0'O''N 51°0'O''N N
+
CM28 0 SOOO'O''N 49'O'O''N 48'O'O''Nr/~J
1 0 200 47"O'O''N Kilomelers70'O'O'W 65'O'O'W
Figure 3. The 22 buoys sampled between 1980 and 1985 (except 1982) and in 2007 and 2008.
1.2.7 Population interactions
Predation
The only known mussel predator observed to recruit to buoys is the seastar Asteria
vulgaris (Ardisson et Bourget, 1992 and Bélanger and Archambault, pers. corn.). In 2005,
the abundance of aIl benthic species present, including A. vulgaris was measured in the quadrats. In 2008, the presence of A. vulgaris, the main potential predator observed on buoys, was also noted on the 22 buoys sampled.
Competition
We used an analysis of self-thinning, the process of density-dependent mortality in
sessile organisms, to assess the importance of competitive interactions in this system. Using
the relationship of m
=
kN\ where density (N) and the mean weight of survivors (m) arerelated according to a power equation, competition is considered to be occurring when y <
-1 (Y oda et al., 1963). Here we looked for this evidence of competition by observing the
biomass-density relation of buoys from different regions as determined by Brunei et al.
(1998): Southern Gaspé Water (EGS), North Shore (CN, including BCN, HCN and MCN),
Lower St, Lawrence Estuary (EM), Prince Edward Island (PEI) and the Magdalen Islands
1.3RESULTS
1.3.1 Blue mussel density, biomass and maximum size in 2007
Data from 2007 cover a larger spatial scale than historical data and include smaller mus sels down to 500 J.1ffi for estimates of denisty. They thus provide the most complete overview ofmussel recruitment (i.e., mean density, biomass and maximum size) of the St. Lawrence system for a given year (Figure 4). Several striking differences were observed. First, no mussel recruitment occurred on buoys in two contrasting regions: the upper estuary upstream of the mouth of the Saguenay River (51 buoys) and the Mingan Islands (7 buoys), in the extreme northern part of the study region (Figure 1). Highest abundance in terms of densities occured in Gaspé Peninsula (up to 19,400 mussels.100cm2), the
Magdalen island (4,140 mussels.l00cm2) and on the North Shore near Port-Cartier (14,800
mussels.l00cm2). The same regions were also characterized by higher biomass as was
Prince Edward Island (PEI) (up to 212 g.lOOcm2
) where densities were quite low (1,672
mussels.l00cm2). Not surprisingly then, the large st maximum size was observed around
PEI (45.4 mm) although high values were also se en in the Magdalen Islands (31.2 mm) and the southern Gaspé Peninsula (32.4 mm) (Figure 4). Overall these same patterns occurred in 2005 (data not shown) and, to a more limited extent, in the historical data (Fradette &
biomass (g/100cm2) • 0,001 -20,35 • 20,35-52,61 • 52,61-125,45
•
absenceFigure 4. Blue mussel (a) density (mussels.lOOcm2) (b) biomass (g.100cm2) and (c)
Table 1. Results of multiple linear regression models (AIC procedure) used to estimate density (A, mussels by 100cm-2), biomass (B, mussels by 100cm-2) and maximum size (Sizemax) among EGSL navigation buoys in 2005 and 2007. Maximum
CUITent velocity (V, cm2s-I), mean surnmer sea surface temperature (SST, oC), mean salinity (S, PSU) and mean summer
chlorophyll a (ChI a ; mg.m-3) were variables in regression models. Partial R2 below each regression coefficient (±SE); NS :
not significant; N = number of data included. Unbiased R2 (R2 adj) are shown; MSE: Mean squared errors.
Interce:pt V SST S Chi-a N dl R2adj MSE Log(A+l) = -6.93 ± 1.12 ·9.45 ! 0.15 056 ± 0.09 0.25! 0.03 NS 124 3 47.01% 456 li) !Partial R1 3.92% 17.15% 27.23%
8
Log(B+1) = N -5.01 ± 0.86 0.41 ± 0.07 0.l3± 0.02 0,004 ± 0.002 Partial R! NS 15.05% 9.86% 21.40% 124 3 44.93% 2.19 Log(A+1) = ·4.92± 1.04 ·0.48 ± 0.13 0.44 ± 0.08 0.24 ± 0.02 NS 142 3 49.01% 6.24 Partial Rl 5.15% 9.85% 30.77% l ' Log(B+1) = ·4.18± 0.65 -0.19 ±O.OS 0 . .37 ± 0.05 0 .. 14.! 0.018
NS 142 3 45.19% 2..43 N Partial RI 2.1% 20.81% 21.14% Siz,e m .. , = 4.56! 2.22 1.70±l.00 1.90 ± 0.27 NS NS % 2 43.35% 57.91 Partial RI 1.68% 44.82%1.3.2 Multiple linear regressions
Multiple linear regression models explained 47% of the variation in mussel density in
2005 and 49% in 2007, 44% of the variation in mussel biomass in 2005 and 45% in 2007,
and 43% of the variation in mussel maximum size observed on buoys on 2007 (Table 1).
Variation in density was best explained by salinity for both years (2005: 27%; 2007: 30%).
Salinity also explained a significant amount of biomass variation in 2007 (21 %), but SST contributed equally (20%). In contrast, Chl a was the primary factor that explained biomass variance in 2005 (21 %) with salinity and SST combined explaining an additional 25 %. Mussel maximum size (only measured in 2007) was best explained by summer SST (44%). Maximum CUITent velocity explained only a small but significant portion of the variance (1-4 %) in aIl the models except biomass in 2005 (Table 1).
1.3.3 Autocorrelation of environmental parameters Northern shore
In 2005, the principal environmental factors (SST, Chl a, and salinity) were highly
variable over space (Figure 5). There was a strong significant pattern of positive
autocorrelation for SST up to 122 km and between 414 to 504 km with negative
auto correlations at intermediate distances (176 and 272 km) and at 612 km (Figure 5a),
suggesting a patchy pattern with periodicity. Chl a was, however, only positively
autocorrelated up to 122 km and negatively correlated at 338 km (Figure 5a) - no positive
autocorrelated up to 125 km and become negatively autocorrelated at greater distances (184
km for SST and 268 km for ChI a; Figure Sb). Autocorrelations of salinity occUITed at
much smaller scales (positive at 18 km and negative at 63 km).
Southem shore
As generally seen on the northem shore, environmental factors were positively autocorrelated at smaller spatial scales and negatively autocorrelated at larger scales
(Figure 5) suggesting environmental gradients. In contrast, auto correlations were strongest
for salinity, SST and maximum CUITent. In 2005, these three factors were positively
autocorrelated up to 102 km, after which autocorrelations were only observed for salinity (positive to 169 km and negatively beginning at 240 km). No autocorrelations were observed for ChI a. In 2007, all environmental parameters were initial positively
autocorrelated (Salinity, SST, maximum CUITent and ChI a to 196, 112 [likely to 189 km],
67 and 66 km, respectively) and became negatively autocorrelated at greater distances
.r::. ...., ::) o Vl
-
c E 0 ~ c f! 0 ~ 0 1 • 0,8 0,6 0,4 0,2 -0,2 -0,4 -0,6 0 0,8 0,6 0,4 0,2 0 -0,2 ,0,4 -0,6 -0,8 2005 distance (km) 200 400 600 800 a • • • • • • 100 200 300 C •-
•
.
_--
,-
.\ Q, , 0 _:.8-> " .~ .... -o--_ 0 u"",u , 'g:: '0. --0 0 , ,•
,a'chl-a -+-max current
2007 distance (km) 0 100 200 300 400 500 0,8
•
b 0,6 0,4 0,2 -i' 0 --:/
-0,2 ., .... ,/..
".
-0,4..
.
.
".-' -0,6 0 100 200 300 1,2 1 d 0,8 a, 0,6 #,::c:~, 0,4 ... " ", " , 0,2 Q ·· ... 0··· -, 0 ">rt:~-,: 'u, D" " -0,2 -0,4"
.'
.
-
.
-0,6_
.
-0,8 "'salinityFigure 5. Moran's 1 index cOITelogram of mean summer chIorophyll a (ChI-a), maximum CUITent velocity (max cUITent), summer sea surface temperature (SST) and mean salinity (salinity) ofEGSL, (a) 2005, northem area; (b) 2007, northem area; (c) 2005, southem area and (d) 2007, southem area. Full symbols indicate statistically different from 0 at a :S 0.05.
1.3.4 Autocorrelations of biotic parameters
N orthern shore
In 2005, a positive autocorrelation up to 63 km was observed for biomass but became negative from 175 to 272 km (Figure 6a). Density showed a similar pattern except that
significant positive correlations were also seen at 338 km, giving the "U" -shaped pattern
indicative of a patchy distribution. In 2007, aImost the exact patterns were seen again,
except no positive autocorrelation were subsequent observed for density (Figure 6b). For
maximum length, positive autocorrelations were seen at most shorter distances (up to
243 km, except at 123 km) and became negative after 386 km.
Southern shore
In 2005, the density in the southern area stayed positively autocorrelated up to 169
km and eventually became negatively autocorrelated at 269 km (Figure 6c). In contrast,
positive autocorrelations for biomass were only seen at 30 and 169 km with no significant autocorrelations at intermediate distances. As for density, a negative autocorrelation
appeared at greater distance (Figure 6c). In 2007, the maximum distances for positive
auto correlations for both density and biomass were shorter (70 and 113 km, respectively),
but both again eventually became negative. In contrast to the northern shore, maximum
length was only positively autocorrelated up to 70 km, and no autocorrelations (positive or
2005 2007 distance (km) distance (km) 0 200 400 600 800 0 100 200 300 400 500 600 1,4 1,2 1,2 1 1 a 0,8 b 0,8 0,6 L:
-
0,6 +-' ... c 0,4 )'. I! 0,4 0 0 0,2 ... Z ::E 0,2'IL
0 Il. "A' . . <> 0 .A. -0,2 -0,2..
'a. --._._._._ ... -0,4 -0,4 -0,6 -0,6 0 100 200 300 0 100 200 300 400 0,5 0,6 0,4..
0,4.
-.
-'.
.
0,3 -.
.
.
C.
.
d 0,2 ....
.
0,2..
.
L: 0,1 +-' c 0 ::J I! 0 6. b-0 0 '6. ···0 Vl ::E -0,1 -0,2..
, -0,2 -0,4 -0,3 -0,6 À -0,4..
-0,5 -0,8.... density ... biomass "·-max size
Figure 6. Moran's 1 index correlogram of density, biomass and maximum size (a) 2005, northem area; (b) 2007, northem area; (c) 2005, southem area and (d) 2007, southem area. Full symbols indicate statistically different from 0 at a :S 0.05.
1.3.5 Covariogram
Maximum size data were available as a time series from 1980 to 1985, 2007 and 2008, and thus covariogram analyses of spatiotemporal information were limited to this metric in these years. The covariance of blue mus sel maximum size was positively correlated up to 20 km (Figure 7) after which no significant correlations were observed;
however, because of the limited data set, only three classes of distances can be interpreted. Comparisons of these results with similar analyses of environmental data were not possible due to the lack of environmental data from 1980 to 1985.
20 15 10 CIl c ~ 'C 5 ~ > 0 u 0 ·5 ·10 0 1 J 1
J
1i
1 1.,
1 Jj
J 20 40 distance (km) 60 80 100 120Figure 7. Covariance between temporal series (7 years) of maximum size observed on 22 buoys in relation to the geographic distance that separated them. Filled symbols indicate statistically different from 0 at a
:s
0.05 after 10,000 Monte Carlo permutations.1.3.6 Predation
The only potential species of predator observed on navigation buoys was the seastar
Asteria vulgaris, a species with a planktonic larval stage. This seastar was only observed on
10 of the 159 buoys sampled in 2005. Those buoys were situated mostly in the southem part of the Gulf of St. Lawrence around Magdalen Islands and PEI although sorne were also collected in Baie de Gaspé. The maximum abundance was four seastars within a single quadrat (0.01 m2), but the total for aIl buoys sampled in 2005 was just 13 seastars. In 2008, sorne were observed on five of 22 buoys sampled, and all five were situated around Gaspé Penin sula. The size of seastars observed on buoys was very small with arm length less than 1 cm (V. Bélanger, pers. obs.).
55'O'O'W 5O'O'O'W 51'O'O''N N SO'O'O"N
+
·O'O''N 49·0'O"N ·O'O''N 4rO'O''N Legend ,. Predators 2008... Predators 2005 ·O'O''N
70"O'O'W 55·0'O'W
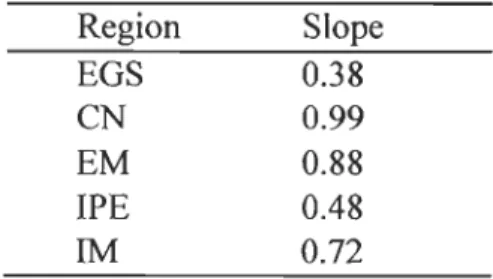
Table 2. Slope of linear regression between log (density) and log (biomass) in different regions of the estuary and Gulf of St. Lawrence (EGS= Sourthem Gaspé water; CN=North
Coast; EM=Lower St. Lawrence Estuary; IPE= Prince-Edward-Island; IM= Magdalen
Islands). Region Slope EGS 0.38 CN 0.99 EM 0.88 IPE 0.48 lM 0.72 1.3.7 Competition
On almost half the buoys, the submerged surface was covered by musse1s
(V. Bélanger, pers. obs.), and space appeared to be limited. However, linear regressions between log (density) and log (biomass) for any region of the St. Lawrence system were not
significantly negative (Table 2), and thus there was no evidence for self-thinning (i.e.,
1.4 DISCUSSION
1.4.1 Spatiotemporal stability
Biomass, density and maximum size were not uniform across the EGSL system nor did they follow simple gradients (e.g., estuarine). Historical studies of navigation buoys have identified sorne regions particularly favourable for recruitment in the EGSL system: the northem Gaspé Peninsula region, characterized by high biomass, and others, like the
southem Gaspé Peninsula, which although characterized by lower recruitment, had biomass
values as high as those of the northem Gaspé Peninsula. However, in sorne regions (e.g., the Mingan Islands), mus sel density as well as biomass were particularly low (Ardisson &
Bourget, 1991; Bourget et al., 2003). Our study shows a similar pattern for these regions but expands the scope to a much larger part of the St. Lawrence system by integrating data from the Magdalen Islands and PEI (Southem part of the Gulf of St. Lawrence).
The significant relationship between biomass and spatial scale that has already been observed on navigation buoys (Ardisson & Bourget, 1990) was also seen in our
correlograms. In their study, Mantel tests showed highly significant correlations between
ecological and geographic distance matrices for different years combined, and they concluded that there was a spatial dependency of biotic similarity that was a function of the distance separating different sites (i.e., buoys). They found a significant positive
autocorrelation at 25-100 km that became negative at 150-250 km for the main sessile species observed on the buoys (the bivalves Hiatella arctica, Mytilus spp and the barnacles
Balanus crenatus and Semibalanus balanoides). The scale of these patterns is similar to
those we described for 2007.
Given that buoys are situated exactly at the same positions years after years, rigorous comparisons of temporal variability could also be made. Earlier studies pooled results over time, whereas here we have been able to examine temporal aspects of the spatial patterns observed. A visual comparison of both historical (e.g., Fradette and Bourget, 1980) and contemporary data reveals that the qualitative patterns of spatial variation in density remain quite similar over a 30-yr period. Unfortunate1y, differences in sampling methods prevented any absolute comparisons between years, but there are clearly regions that consistently have greater recruitment (i.e., higher densities) and growth (i.e., biomass) than others, and these differences appear stable over time. In addition, we were able to quantitatively analyze the temporal variation of 22 buoys that were sampled at least seven times and
showed that interannual variation was synchronized at shorter spatial scales at least for the
one parameter (maximal size) that was comparable among years. 1.4.2 Synchrony
Studying synchronization phenomena in ecology can assist f i explaining how
population dynamics interact with extrinsic environmental variations (Grenfell et al., 1998;
Blasius et al., 1999). At least three hypotheses could lead to spatial synchrony in various
systems: (1) the presence of mobile aggregating consumers (i.e., seastars for blue mussels);
(2) dispersal; and (3) synchronization of environmental variation (Koenig, 1999). Our
synchrony between buoys that decreased with distance and eventually become negatively correlated. This is the fIfst and most basis step in identifying the mechanisms that cause
such patterns (Hudson & Cattadori, 1999). Over large regions, non-uniform dispersal of
individuals and environmental variation have been identified as the most probable causes of
synchronized population fluctuations (Ranta et al., 1995) and are certainly the most likely
explanations for the patterns observed here as the abundance of predators on buoys seem to
be insufficient for controlling mussels populations.
The relative importance of environmental factors and dispersal as drivers of spatial synchrony has been examined in the spatiotemporal dynamics of a dominant invertebrate species, the mussel Mytilus californianus, along the west coast of the United States
(Gouhier et al., 2010). Along this coast, aU measured environmental variables undergo a
slow quasi-linear decrease in synchrony with increasing lag distance, whereas the spatial synchrony of M californianus populations along the coast shows a strongly non-monotonie function, oscillating between synchrony and asynchrony with increasing lag distance
(Gouhier et al., 2010). This discrepancy suggests that local biological processes and limited
dispersal, rather than nearshore environmental conditions contribute to patterns of spatial
synchrony exhibited by M californicanus. Unfortunately, due to the high level of correlation between variations in the pattern of environmental parameters and mussel recruitment in our study, we cannot separate out any contribution that dispersal (e.g.,
dispersion or larval survival) might have had on the pattern that we observed. Moreover,
1.4.3 Environmental parameters
According to the theory underlying the Moran effect, when two populations have the same density-dependent structure, then changes induced by density-independent factors (usually weather induced changes in the environment) should bring population fluctuations
into synchrony (Hudson & Cattadori, 1999) over the spatial scale of environmental
variation. In sorne cases, this Moran effect can dominate any overall level of synchrony
(Heino et al., 1997). The role of such an influence by environmental parameters was
suggested in early studies of marine benthic communities (Archambault & Bourget, 1999;
Ardisson & Bourget, 1990; Bourget et al., 2003; Menge, 1992; Page & Hubbard, 1987;
Wildish, 1977) to explain variability in ecosystem attributes. M edulis and the other sessile
species observed on navigation buoys are under the direct influence of the environmental
conditions prevailing in the surface water layer (e.g., temperature, salinity, turbidity,
turbulence, water currents and quality and quantity of food; Ardisson & Bourget, 1992;
Bourget et al., 2003; Fradette & Bourget, 1981). Although the assemblage of organisms
found on navigation buoys must potentially integrate all these factors during its development (Ardisson & Bourget, 1990), we sought to determine which were most important. Within the years examined in this study (2005 and 2007), we consistently found that spatial patterns of mus sel biomass and density reflected patterns of temperature and
salinity. Especially on the north shore in 2005 and on the south shore in 2007, biomass
follows the same spatial pattern as temperature as does density with salinity in 2005 on the
south shore. Multiple linear regressions, the more standard method to link biological
temperature and Chl a to predict biomass, density and maximum size of mussels in the St. Lawrence system. In aImost all cases, maximum CUITent velocity explained a small but significant part of the variation in mussel density, which has been previously observed in this system (Archambault & Bourget, 1999).
Temperature and Salinity
Overall, mussel biomass was greater at higher water temperatures with multiple linear
regressions showing a positive relation between temperature and mussel biomass. Ardisson & Bourget (1991) hypothesized that the spatial pattern of mussel biomass that they observed would be best explained by geographic gradients of summer SST. Growth of
My ti/us can occur between 3 and 25°C, increasing with temperature (Gosling, 1992;
Bourget et al., 2003) with an optimum between 10 and 20°C (Couthard, 1929). On
navigation buoys, Fradette and Bourget (1980) observed maximum length on the south
shore of Gaspé peninsula where the warmer waters in this system were found. Consistent
with this observation, low values in our study were observed in col der zones such as the
Mingan Islands and the Lower North Shore.
Mytilus can survive at considerably low salinities (Bayne, 1976), but growth can be
severely reduced under these conditions. Mussels in salinities representative of our high salinity areas (30-32) had normal growth but did not grow at 19 and showed slow growth at
24 (Bayne, 1965). In this system, Bourget et al. (2003) previously determined an inflexion
point where the biomass increases once the salinity reaches 25-30, the characteristic values of the transition area between the upper and lower St. Lawrence Estuary. Consistent with
their findings, we also observed an absence of mussel recruitment in the lower estuary, where salinity is substantially lower. The presence of two different species with a difference of salinity tolerance in the duration of development (Qiu et al., 2002) can explain a part of variability in spatial patterns of recruitment. Moreau et al. (2005) cannot determine the factors responsible for distribution of the two species, but hypothesize that distribution of M edulis and M trossulus is influenced by temperature, salinity and wave action. The presence of these two species ean be a major factor explaining the distribution of recruitment in St. Lawrence system.
Others environmental factors
Food availability appears to he the most important factor influencing the macroinvertebrate production world-wide (Cusson & Bourget, 2005; Seed, 1976), and
factors like food limitation for suspension feeders might be more widespread in regulating benthic eommunities than generally thought (Bayne, 1976; Wildish, 1977, Wildish &
Kristmanson, 1984). In contrast with intertidal mussels, mussels growing on navigation
buoys are always submerged and thus time available for feeding is not limited (Bayne, 1976). Fradette & Bourget (1980) suggested that variation in maximum size and biomass of
M edulis on navigation buoys might be due variation in food availability except in eolder
waters where temperature appears to direetly effeet mussel growth. Latter analyses (Bourget et al., 2003) support this idea generally, but our more detailed analyses demonstrated that this effeet only occurred for certain parameters and at certain times (e.g.,