HAL Id: inria-00550591
https://hal.inria.fr/inria-00550591
Submitted on 28 Dec 2010
HAL is a multi-disciplinary open access
archive for the deposit and dissemination of
sci-entific research documents, whether they are
pub-lished or not. The documents may come from
teaching and research institutions in France or
abroad, or from public or private research centers.
L’archive ouverte pluridisciplinaire HAL, est
destinée au dépôt et à la diffusion de documents
scientifiques de niveau recherche, publiés ou non,
émanant des établissements d’enseignement et de
recherche français ou étrangers, des laboratoires
publics ou privés.
Toward Creative 3D Modeling: an Architects’ Sketches
Study
Stéphane Huot, Cédric Dumas, Gérard Hégron
To cite this version:
Stéphane Huot, Cédric Dumas, Gérard Hégron.
Toward Creative 3D Modeling: an Architects’
Sketches Study. Proceedings of the 9th IFIP TC13 International Conference on Human-Computer
Interaction (INTERACT’03), 2003, Zurich, Switzerland. pp.785-788. �inria-00550591�
Toward Creative 3D Modeling: an Architects’ Sketches Study
Stéphane Huot, Cédric Dumas & Gérard Hégron
Ecole des Mines de Nantes, 4 rue Alfred Kastler, F-44307, Nantes, France
{Stephane.Huot;Cédric.Dumas}@emn.fr; [email protected]
Abstract: This paper describes our methodology in providing designers with a new advanced 3D modeling Human-Computer Interaction. The main project – called GINA, a French acronym for Interactive and Natural Geometry – expect to introduce new intuitive and creative 3D modeling tools, relying on 2D perspective drawing reconstruction. We present here the user study we conducted and the implications of this study on the interface of GINA.
Keywords: Architectural drawing, sketch, 3D modeling tools.
1 Introduction
Even if usual 3D modeling systems are designed for a specific task or domain, they are still tedious to use and generally shackle creativity of users. This problem principally arises because 3D modeling methods and interactions are far from designers’ habits and environments (Mamykina, 2002). So, as designers often use sketches to create objects and present their ideas, the guiding principle of our pro-ject, GINA (Sosnov et al, 2002), is to sketch a 2D perspective view of the wanted 3D object. As a sin-gle 2D perspective view is not enough to obtain a 3D model, user also needs to specify geometrical con-straints (orthogonality, parallelism and incidence) under the model elements. The GINA mathematical kernel (Sosnov et al, 2002) is able to compute a 3D model from a perspective sketch and associated geometrical constraints. With such input (con-straints) our system can be efficient by anticipating user behavior and analyzing her sketches in real-time, to avoid creativity limitation, and task interrup-tion. We have to introduce interaction and deduction tools to help the input of sketches and constraints. According to this need, the first step of our approach was to conduct a study focusing on architects’ sketches, and more precisely on strokes composing those sketches. Then we deduced implications for interaction from the analysis of obtained data.
2 Alternative 3D Modeling Tools
To make 3D modeling easier, some authors proposed gesture interfaces (Zeleznik et al, 1996; Igarashi etal, 1999). Although this works have been usable and intuitive, they have been designed to produce ap-proximate models. Gesture interfaces also tackle with the dual problem of a limited set of gestures and the difficulty for a novice user to learn gestures. So, in (Igarashi et al, 2001), Igarashi proposed a sugges-tive interface. This system called Chateau, combine a gesture interface with modeling hints modules which asks for the user's confirmation to update the model. Other systems like (Pugh, 1992; Eggli et al, 1997) focus on lines or freehand drawing for 3D modeling to immerse users in a usual environment. These sys-tems extract objects properties and geometrical con-straints from drawings to perform a 3D reconstruc-tion, but they often use axonometric or 2D plane. Technically, this choice improves the properties detection and the ambiguity problem. But even if it's more flexible and intuitive than traditional 3D mod-eling interfaces, it's not enough natural and conven-ient for creative design (especially in the architec-tural domain). Our proposal is to combine perspec-tive freehand drawing with context-aware and sug-gestive interface to provide users with a creative 3D modeling Post-WIMP interface (Van Dam, 1997).
3 Experiment
In order to propose a well designed and adapted computer interface for the perspective drawing, we conducted an experiment in the architectural domain. This study focuses on the perspective sketch during the early design process. Our goals were to under-stand drawer gesture, and find invariants and general properties of the drawing phase. We are not dealing with perception and design intentions of the drawer,
like Suwa (Suwa et al, 1997), but precisely with the creative drawing task at a low level (strokes).
Our experiment consisted in one drawing task. Participants were architects and architects students ranged from first year to fifth year (the last studying year). 21 students and 4 architects participated. It’s important to notice that the number of subjects is not high enough to give us general results like a com-plete formal study. But it makes sense to do an in-formal study for confirming or invalidating our hy-pothesis and analyzing composition of an architec-tural sketch. The program was:
“Draw a building in a single perspective view. The building must be viewed from outside. You can’t use help with materials (pictures, photographs), and it’s better to design a new building than drawing an existing one. Finally, you don’t have to draw exter-nal environment of the building (trees, clouds, etc.)”
Experimental conditions are described in fig-ure 1: sketches were real-time captfig-ured (strokes and their specific times – start and end), with a digitizing tablet connected to a standard PC. We used a tablet that allows user to draw on a regular piece of paper, with an ink-stylus, so subjects were not perturbed by unusual devices and feedback (they didn’t have to look at the PC screen). Subjects were alone in the room during the experiment and were recorded in a video tape.
4 Architectural Strokes
Taxon-omy
To study sketches at a stroke level, we introduce strokes taxonomy. It gives a low level semantic to strokes and helped us in performing analyzes. The proposed taxonomy, deducted from our observations of sketches and discussions with architects is: w construction strokes, to guide in the drawing
process (vanishing points and lines, horizon, landmarks, etc…).
w principal strokes, composing the shape of the building. This class is divided in 2 sub-categories: o primary principal strokes, which are the
first drawn strokes composing the shape, o secondary principal strokes, for all the
re-visions, scribbling, or insisting upon pri-mary principal strokes.
w detail strokes, for characteristics of the building (doors, windows, etc…).
w decoration strokes, giving a more realistic ap-pearance to the sketch (materials, shading, etc…). w style/improvement, for environment strokes,
without link with the main shape (trees, clouds, grass, etc…).
Using this adapted taxonomy, we have labeled strokes of the collected sketches database. It was then possible to make statistics to extract invariants and characteristics of creative sketching in the archi-tectural domain (see the analysis tool in figure 2).
5 Results and Implications
The whole corpus contain 24 drawing (one of the subjects made an unusable one) for a number of 9858 strokes. Each participant spent 10 to 30 min-utes to achieve the task. They generally followed the program, except for one point. They often forgot the last order (don’t draw the environment of the build-ing). This fact brought us to consider this part of the sketch as mandatory for designers and to include such stroke kind in our taxonomy.
5.1 Perspective guidelines
One of our major hypotheses was on construction strokes: drawers, and in particular architects, are often using perspective guidelines. So, our idea was to introduce a well-designed guideline tool in our system. But there are only 4% of construction strokes in the corpus. Furthermore, most of them are land-marks, and not perspective guides. This result
invali-Figure 2: The strokes labeling tool, used to visualize sketches, labeling strokes and perform analyses.
dates our hypothesis, but shows that early stage sketching is not real perspective drawing.
5.2 An Invariant in Temporal
Distribu-tion of Strokes Categories
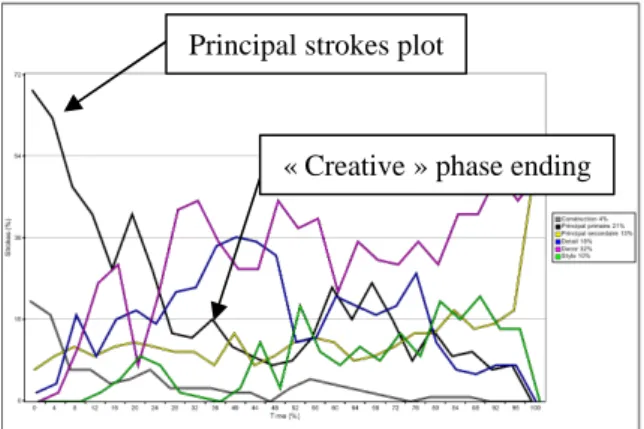
An essential analysis is the temporal distribution of each class of stroke during the entire drawing proc-ess. For a fixed time interval (sample), we count the number of drawn strokes from each category. A line chart is then created, with time in abscissa and strokes number in ordinate, with each line represent-ing a stroke class (figure 3). Applied on the corpus (after time normalization), this tool helped us to discover a drawer-independent consistency in the temporal distribution of strokes classes:
w Even if they are a few construction strokes, they are essentially in the 10 first percents of the total drawing time.
w Primary principal strokes outnumbered other strokes in the first 30 percents of the total drawing time. Half of those strokes (52%) are time-localized during these 30%.
Temporal situation of this primary principal strokes flow goes in the same way than an observation of P. Leclercq on a descriptive 2D sketch (Leclercq, 1996). He noticed that functional structure and spaces cutting of a drawn apartment were present after approximately 40% of the drawing stages. This result was not generalized by further observations, but we can already extend it to perspective drawing with our results.
This result enabled us to identify a “creative” context during the early stage of the drawing task (figure 3), and it’s obvious that user needs all her attention at this moment. It means this creative pe-riod is the essential one for properties detection, and paradoxically the one when the system can’t collect extra information from the user. Indeed, our system goal is to automatically detect most of the sketch
geometrical properties, but we know that such a task falls with ambiguities. We’ll surely need the user to approve the systems’ choices, but not in an intrusive way during creation. So the question is: How to detect end of this step, as a context change? Studying transitions between different strokes classes will give us a part of answer.
5.3 Transitions between Strokes
Cate-gories
If we consider each stroke type and the sketch time-line, we can make types transition diagrams (figure 4). Those diagrams are simple adjacency matrices.
Strokes types are displayed in the axe boxes and corresponding transition numbers are in the crossing boxes. Figure 4(a) shows the whole corpus transi-tions diagram, and Figure 4(b) is an individual one. Individual diagrams include another display, on the bottom. It’s a temporal line graph where each stroke is displayed by a rectangle, using a specific color for each type. Then, we can see packets of typed strokes, and estimate their sizes and transitions.
The whole corpus diagram shows symmetry in relation to the diagonal of the diagram. It proves that subjects drawn with repetitive same type strokes packets linked with other types packets (we verified this result with individual timeline diagrams). There are frequent transitions (construction to primary principal, and reverse, for example) and uncommon ones (construction to detail). With deepest observa-tions, we isolated three major steps of the drawing task:
w constructive stage, with a lot of construction to primary transitions (and reverse) an primary to secondary transitions (and reverse).
w completion and improvement stage, where transitions are especially between secondary, de-tail and decoration strokes.
w style stage, with a lot of style to style transi-tions.
(a) (b) Figure 4: Strokes types transition diagrams (a) Corpus diagram. (b) Individual diagram.
Figure 3: Temporal distribution of each stroke class.
Principal strokes plot
These stages are often ordered as we presented them, but we can’t establish a chronological invari-ant. It’s important to notice that those stages are well identified contexts, and we have information about probable transitions between them.
We can conclude of this observation of the transi-tions that a designer will not do several things at a time. Drawer focuses his attention upon a precise part of the drawing and work by logical and incre-mental steps. Steps we identified could be mapped to interaction contexts, used to help in drawing and constraints input.
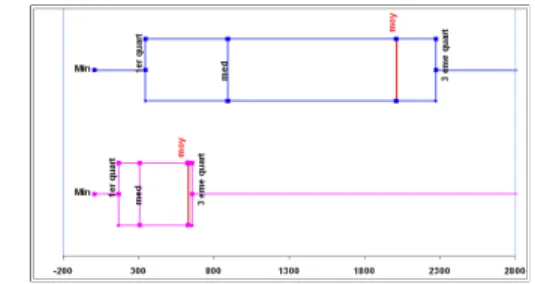
5.4 Pauses Times
The last relational property between strokes we ana-lyzed is time passed between each stroke: pauses times. There are 2 kinds of pauses: pauses with a stage change (avg. 0.7s) and pauses without a stage change (avg. 2s). Focuses only on means is not enough to deduce a statistical property. So we used standard boxes diagram, as shown in figure 5.
There are 3 important properties:
w Median is higher for context changing,
w Interquartile range is larger for context change, and nearly include bounds of the other box, w Extremes are almost the same (not on the figure) Those facts confirm that pauses are higher in case of a context change, even if extremes are close.
6 Conclusion
We have described in this paper an experiment fo-cusing on architects sketches. We proposed an adapted taxonomy of strokes for architectural sketches study. Applying this taxonomy to our sketches corpus, we isolate the 3 stages of an archi-tectural design sketch which could be associated with interaction contexts. More than these stages, we also computed probabilities of switching from a stage to another one during the drawing task.
By using the statistics and properties presented here, we have developed real-time sketch analysis and segmentation agents. We are currently testing an
algorithm to detect drawing stages in real-time, based on transitions probabilities, pauses between strokes and strokes properties (pressure, position, scribbling).
References
Eggli, L., Hsu C., Brüderlin B.D., Elber, G. Inferring 3D models from freehand sketches and constraints.
Computer-aided Design, vol. 29, n° 2, pp 101—
112, 1997.
Igarashi, T., Matsuoka, S., Tanaka, H. Teddy : A sketching interface for 3D freeform design. In SIGGRAPH99
Conference Proceedings (08-13 August, 1999, Los
Angeles), ACM Press, pp 409—416.
Igarashi, T., Hughes, J.F. A suggestive interface for 3D drawing. In 14th Annual Symposium on User
Inter-face Software and Technology (11-14 November,
2001, Orlando), ACM UIST’01, pp 173—181. Leclercq, P. Environnement de conception architecturale
préintégrée. Eléments d’une plateforme d’assistance basée sur une représentation sémantique. Collection
des publications de la Faculté des Sciences Appli-quées de l’Université de Liège, Liège, Belgique, pp
174—175, 1996.
Mamykina, L., Candy, L., Edmonds, E., Collaborative Creativity, Communications of the ACM, Vol. 45, No 10, pp. 96-99, October 2002.
Pugh, D. Designing solid objects using interactive sketch interpretation. Computer Graphics, vol. 25, pp 117—126, March 1992.
Sosnov, A., Macé, P., Hégron, G., Huot, S., Rapid incre-mental architectural modeling from imprecise sketches and geometric constraints. In Graphicon
2002 Conference proceedings, Linz, Autriche,
2002.
Suwa, M., Tversky, B. What do architects and students perceive in their sketches? A protocol analysis.
De-sign Studies, vol. 18, n° 4, Elsevier Science Ltd., pp
385—403, October 1997.
Van Dam, A. The Human Connection: Post-WIMP User Interfaces. Communications of the ACM, vol. 40, n° 2, ACM Press., pp 63—67, February 1997.
Zeleznik, R.C., Herndon K.P., Hughes J.F. SKETCH: An interface for sketching 3D scenes. In SIGGRAPH96
Conference Proceedings (04-09 August, 1996, New
Orleans), Addison Wesley, pp 163—170. Figure 5: Boxes diagram for pause times between strokes.