Titre:
Title
:
Measurement Accuracy Investigation of Touch Trigger Probe with
Five-Axis Machine Tools
Auteurs:
Authors
: Md Mizanur Rahman et René Mayer
Date: 2016
Type:
Article de revue / Journal articleRéférence:
Citation
:
Rahman, M. M. & Mayer, R. (2016). Measurement Accuracy Investigation of Touch Trigger Probe with Five-Axis Machine Tools. Archive of Mechanical Engineering, 63(4), p. 495-510. doi:10.1515/meceng-2016-0028
Document en libre accès dans PolyPublie
Open Access document in PolyPublie
URL de PolyPublie:
PolyPublie URL: https://publications.polymtl.ca/3612/
Version: Version officielle de l'éditeur / Published version Révisé par les pairs / Refereed Conditions d’utilisation:
Terms of Use: CC BY-NC-ND
Document publié chez l’éditeur officiel Document issued by the official publisher
Titre de la revue:
Journal Title: Archive of Mechanical Engineering (vol. 63, no 4)
Maison d’édition:
Publisher: Sciendo
URL officiel:
Official URL: https://doi.org/10.1515/meceng-2016-0028
Mention légale: Legal notice:
Ce fichier a été téléchargé à partir de PolyPublie, le dépôt institutionnel de Polytechnique Montréal
This file has been downloaded from PolyPublie, the institutional repository of Polytechnique Montréal
DOI: 10.1515/meceng-2016-0028
Key words:probing, machine tool, touch probe, repeatability, measurement inaccuracy
MD MIZANUR RAHMAN1, J.R.R. MAYER1
MEASUREMENT ACCURACY INVESTIGATION OF TOUCH TRIGGER PROBE WITH FIVE-AXIS MACHINE TOOLS
The touch trigger probe plays an important role in modern metrology because of its robust and compact design with crash protection, long life and excellent repeatability. Aside from coordinate measuring machines (CMM), touch trigger probes are used for workpiece location on a machine tool and for the accuracy assessment of the machine tools. As a result, the accuracy of the measurement is a matter of interest to the users. The touch trigger probe itself as well as the measuring surface, the machine tool, measuring environment etc. contribute to measurement inaccuracies. The paper presents the effect of surface irregularities, surface wetness due to cutting fluid and probing direction on probing accuracy on a machine tool.
1. Introduction
Users of machine tools seek to integrate touch trigger probe measurements within the machine tool environment so that the machine tool can locate the part, perform self-checks and ultimately inspect the machined part at strategic points throughout the machining of a part. In general, a touch trigger probe provides a binary signal, when contact occurs with the workpiece surface, which is used to trigger readings of the machine’s X-, Y- and Z-axis positions. The touch trigger probe temporarily replaces the cutting tool in the machine spindle. On-machine measurement of the workpiece allows one to take corrective actions while the
workpiece is still on the machine tool [1]. Thus the accuracy of the measuring
device (probe) has significant influence on the part produced.
Cauchick-Miguel and King studied the factors that affect probe accuracy in-cluding the approach direction, probe lobing, measuring speed, probe indexing 1Mechanical Engineering Dept., Polytechnique Montréal, P.O. Box 6079, Station Downtown, H3C
angle and spring pressure by measuring a precision spheres [2]. Wozniak et al. considered probe pretravel variation as one of the major sources of probe inaccura-cies. They experimentally demonstrated that configuration of the probe, triggering
force, stylus length and stiffness influence the probe pretravel variation [3]. Later
on, they proposed a new technique for the verification of CMM touch trigger probe accuracy by measuring the distance between a reference point and the triggering point for different directions. The reference point is defined by the axis of rotation
of the most stable axis of any rotary table [4]. By using this technique they also
showed that the measured object’s shape, surface roughness and material stiffness
contribute to the inaccuracies caused by a touch trigger probe [5].
Johnson et al. investigated the dynamic error characteristics of touch trig-ger probes on a CMM and found measurement speed, probe longitude, approach distance, probe latitude, stylus length/stylus tip diameter, probe orientation, oper-ating mode (scanning and non-scanning), scan pitch, preload spring force (gauging force), probe type, and the surface approach angle had an important impact on probe accuracy. They also proposed some solution to avoid such error sources, such as optimizing the measurement speed along with a defined probe spring force
and selection of probe type [6].
Fesperman et al. proposed an evaluation method for the standard of numerical control machines’ measuring performance assessment furnished with touch trigger probe. Based on the designed tests, probing repeatability, two dimensional (2D) and three dimensional (3D) probing errors as well as the inaccuracies in distinguishing the WCS (workpiece coordinate system) in MCS (machine coordinate system) is
also considered for this evaluation method [7]. This work is aimed at creating a
baseline for on-machine measurement uncertainty budget data set [8]. Jankowski
et al. built a portable setup by using a master artefact with an inner hemisphere for the indirect assessment of the accuracy of the touch-trigger probe. This setup is used to estimate the triggering radius variation in 2D and 3D measurements as
well as unidirectional repeatability of a touch-trigger probe [9].
All the above works were conducted for CMM probing. On a machine tool, additional factors must be considered. Verma et al. experimentally investigated that machine tool required a particular time of operation to reach its stable operating condition, which is known as warmup period and the machine tool drifts throughout this period. This warmup cycle and the tool change cycle has significant influence
on the measurement accuracy of the machine tool [10]. Machining process requires
coolant liquid for the cutting process that makes the surfaces wet. Also the surface might not be smooth. Hence, this paper focuses on the external influences that can yield inaccuracies of the probing measurements on a machine tool. Surface irregularities, wetness effect, repeatability of the probe and equivalent probe lobing are experimentally evaluated.
2. Measurement methods and results
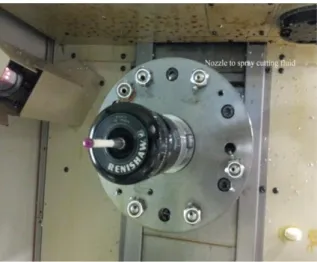
For the tests, the table of a five axis WCBXFZYT horizontal machine tool is
probed as shown in Fig.1with a Renishaw machine touch trigger probe MP700
used with a 100 mm stylus. Four different test procedures have been followed.
Fig. 1. Probing on a WCBXFZYT machine tool
Fig. 2. Spindle with nozzle to spray cutting fluid holding the probe
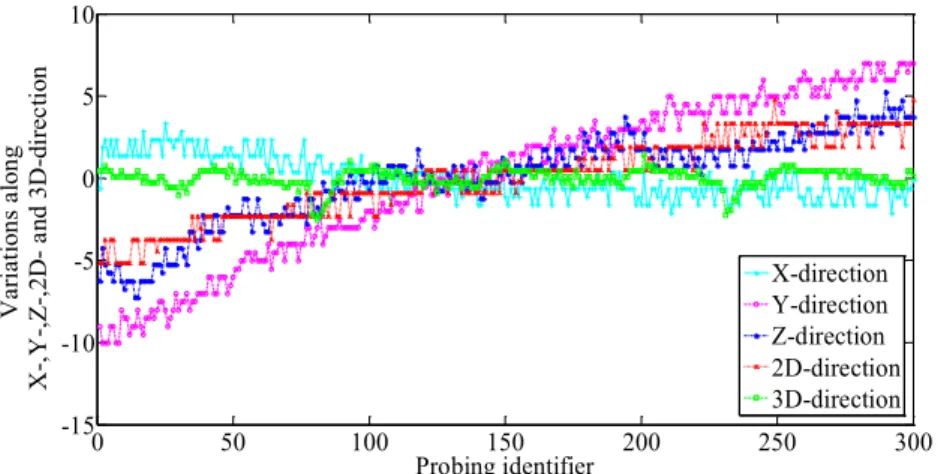
In procedure I, the unidirectional repeatability of the probe is evaluated by measuring a surface point 300 times in X-, Y-, Z-, 2D- (an inclined XY plane
45◦ with the horizontal axis) and 3D-directions (all the linear axes need to move
simultaneously). The unit normal vector for the surface point along the X-axis, Y-axis, Z-axis, 2D-direction and 3D-direction are [1 0 0], [0 1 0], [0 0 1], [0.7071 0.7071 0] and [0.4830 0.2588 0.8365], respectively. The 3D orientation is obtained
of the machine tool’s X-, Y- and Z-axis. The surface is cleaned and dried before the measurements commence.
In Procedure I, total time required for 300 probing with the respective direction is 1H45M approximately with the full retraction of the probe in Z-axis by 300mm
after each probing. Fig. 3 shows the presence of a drift for an unknow reason
although thermal drift of the machine is suspected. Table1shows the results for
the Procedure I (unidirectional repeatability of the probe).
0 50 100 150 200 250 300 -15 -10 -5 0 5 10 Probing identifier V ar ia tion s a lon g X -,Y -,Z -,2D - a nd 3D -di re ct ion X-direction Y-direction Z-direction 2D-direction 3D-direction
Fig. 3. Procedure I (Unidirectional repeatability)
Table 1. Range and standard deviation of the probing measurements for 300 repetitions in each of the
selected directions
X Y Z 2D 3D
Range (µm) 5.5 17.0 12.5 9.9 3.9
Standard deviation (µm) 1.2 4.9 2.7 2.5 0.6
The drift could be responsible for the larger variation range of Y-, Z- and 2D-directional measurements. The standard deviation of the measurement in 3D direction is unexpectedly lower primarily because no drift is apparent.
To remove the effect of the drift on the statistical results, pooled standard deviation is calculated for these five directional measurement. For pooled standard deviation calculation, 12 small windows of 25 probings are defined. From these 12 populations, the pooled standard deviation is calculated by using the following formula:
If the populations are indexed as i = 1, 2 . . . m, then the pooled variance s2
p
can be estimated by the mean of the variances s2i
s2p,k =
m
i=1(ni− 1)s2i,k
m
where ni is the sample size of population i and k refers to the X-, Y-, Z-,
2D-and 3D-directions. The pooled st2D-andard deviations are given in Table2. Hence, a
significant reduction in the calculated measurement repeatability is gained, which confirms the significant contribution of the observed drift on the standard deviation of the measurements.
Table 2. Pooled standard deviation for a window of 25 probing measurements based on the probing
measurements for 300 repetitions in each of the selected directions
X Y Z 2D 3D
Pooled standard deviations (µm) 0.63 0.59 0.63 0.64 0.46
In procedure II, surface wetness effect on probing is assessed by measuring a single surface point in the Z- and 3D- directions. Procedure II includes four different approaches, named A, B, C and D. For Approach A, a surface point with the local surface normal aligned with the machine Z-axis is measured 600 times. For the first 100 touches the surface is dry and clean, for the second 100 touches the cutting fluid (4-6% of CIMSTAR 60 semi-synthetic metal working fluid added to water) is sprayed manually on the surface to make it wet and this cycle is repeated for the remaining 600 measurements. Approach B is similar to Approach A but
instead of manually wetting the surface the machines’ own system (Fig.2) is used to
apply the cutting fluid on the surface. The cutting fluid passes through the machine spindle to the targeted surface area.
In Approach C, the same surface point as approach A and B is measured 600 times without using cutting fluid and the surface is kept clean and dry. Finally, in Approach D a surface point is measured with its normal at an oblique 3D angle of the machine tool for 600 times but with the same manner than Approach A.
Fig.4shows the measurement variation over 600 probing for Approach A, B, C
0 100 200 300 400 500 600 -8 -6 -4 -2 0 2 4 6 Probing identifier V ar ia tion s al on g Z - a nd 3 D -di re ct io n Manual clean/Spray Spray through m/c spindle No wetting
manual clean/spray 3D-direction
Table 3. Range and standard deviation for all four approaches in Procedure II
Approach A Approach B Approach C Approach D
Range (µm) 9.0 9.0 12.5 12.2
Standard deviation (µm) 2.1 2.3 3.4 3.5
Pooled Standard Deviations 0.53 0.8 0.6 0.63
and D. Total time required for the measurements of each Approach is 1H53M approximately.
Fig.4shows that the results seem to be stabilized after 300 probing for
ap-proach A, C and D. For Apap-proach B, the cutting fluid was sprayed through the
machine spindle, as shown in Fig.2, which may cause thermal effects. Plateaus
corresponding to the dry and wet cycles are apparent for Approach D only. Procedure III is for surface irregularity assessment. A 5×5 spatial grid of 2 by
2 mm total size with n = 25 regularly spaced points Pi, i = 1 to n, measured along
direction k with k = X, Y, Z, 2D and 3D. The grid is measured j = 1 to m times, with m = 19, for the respective direction hence each point on the grid is revisited
m times. Then, the effect of surface irregularities is observed by calculating the
mean of each point i and for a specific direction k, Pi,k, over all m cycles. By
doing this, the effect of repeatability and drift can be removed and the graphical
representation of the surface irregularity effect is given in Fig.5. For an indirect
machine tool inspection technique like [11], the measured surface can influence
the overall measurement inaccuracies as measurements are conducted directly on the machine tool table.
Grid measurement cycle starts with measuring the spatial grid along the
X-direction followed by the Y-, Z-, 2D- and 3D-X-directions. The means Pi,kover all m
cycles for a particular direction k is Pi,k = 1 m m j=1 Pi, j,k. (2)
The standard deviation of the n = 25 grid points means is then calculated for each respective direction Sk2= n i=1 ( Pi,k − Tk)2 n− 1 (3) where Tk = 1 n n i=1 Pi,k.
Table4shows the range of the Pi,kand standard deviations of Pi,k along the k
directions. It shows the measurements variation attributed to surface irregularities. The probing in Z- and 3D-directions is shows the largest variations with [range, standard deviation] of [3.9, 0.97] µm and [7.0, 1.7] µm respectively.
0 0.5 1 1.5 2 0 1 2 202.964 202.966 202.968 202.97 202.972 Grid axis (mm) Grid axis (mm) 3D de vi at io n ( m m ) 0 0.5 1 1.5 2 0 1 2 202.988 202.989 202.99 Grid axis (mm) Grid axis (mm) 2D de vi at io n ( m m ) 9 9.5 10 10.5 11 140 141 142 202.888 202.89 202.892 X (mm) Y (mm) z d ev iat io n ( m m) -142 -141.5 -141 -140.5 -140 -11 -10 -9 202.931 202.932 202.933 202.934 202.935 X (mm) Z (mm) y de vi at ion( m m ) 140 140.5 141 141.5 142 -11 -10 -9 203.033 203.034 203.035 203.036 203.037 Y axis (mm) Z axis (mm) x de vi at ion ( m m )
Fig. 5. Effect of surface irregularities on probing of a 2 by 2 mm spatial grid along the X-, Y-, Z-, 2D- and 3D-directions
Table 4. Range and standard deviation of the 5×5 spatial grid probing
X Y Z 2D 3D
Range (µm) 2.9 2.7 3.9 2.5 7.0
Standard deviation (µm) 0.86 0.68 0.97 0.73 1.7
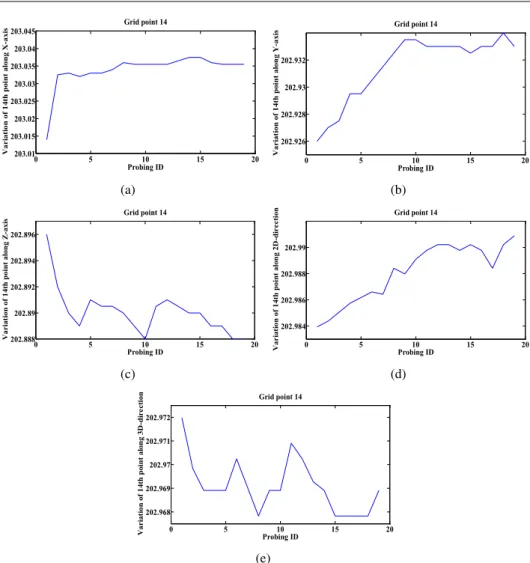
If we look closer at the individual grid point analysis as given in Table5and
Fig.6 (a, b, c, d and e), the measurements are affected by surface irregularities
mostly in X- and 3D-direction by a maximum standard deviation of 5.3 and 6.1 µm
(Table5). As mentioned earlier, there is a drift affecting the measurement results
for the first hour. Hence, the X- and 3D- direction can also be affected by this drift, which results in a larger variation in the measurements. The measurement time is 7 hours and 30 minutes (approximately) and the machine keeps drifting until a stable operating conditionwhen the machine variability shows no particular patternlower. Random variation in 3D-probing has been observed and the reason is unknown. Pooled standard deviaitons are calculated to isolate the variablity. The pooled standard deviation in 3D-probing is 0.95 µm which is noticeably smaller.
Table 5. Individual standard deviation for each grid point
Grid Points ID X (µm) Y (µm) Z (µm) 2D (µm) 3D (µm) 1 5 2.6 1.7 2.3 5.5 2 4.9 2.5 1.6 2.2 1.2 3 5.1 2.6 1.9 2.1 6.1 4 5.2 2.4 1.7 2.3 1.2 5 5.1 2.5 2 2.2 1.1 6 5.1 2.3 1.7 2.2 1.2 7 5.2 2.3 2 2.1 1.3 8 4.9 2.5 1.7 2.3 1.3 9 5.2 2.4 1.7 2.1 1.2 10 5.2 2.3 1.9 2.3 1.2 11 5.2 2.2 1.8 2.2 1.1 12 5.1 2.3 1.8 2.3 1.1 13 5.1 2.3 1.9 2.2 1.7 14 5.1 2.4 1.8 2.2 1.1 15 5.1 2.5 1.8 2.2 1 16 5.1 2.5 1.8 2.2 1.1 17 5.3 2.6 1.8 2.2 0.9 18 5.2 2.6 1.9 2.2 1 19 5.1 2.5 1.9 2.1 1 20 5.1 2.8 1.8 2.4 3.9 21 4.9 2.8 1.6 2.2 1 22 4.9 2.9 1.6 2.2 5.5 23 4.9 2.6 1.7 2.2 1.5 24 4.8 2.6 1.6 2.2 3.7 25 4.7 2.7 1.4 2.3 1.4 Maximum 5.3 2.9 1.9 2.4 6.1 Minimum 4.7 2.3 1.4 2 0.92 Pooled Standard 5.1 2.4 1.8 2.1 0.95 Deviations
To observe the effect of the machine state on the grid measurements, a random grid points are considered and a typical trend of measurement variation is given in
Fig.6. The X-axis measurements are affected the most for first and second cycle
by approximately 20 µm while the measurements variation along other direction remains below 10.0 µm (approximately) The grid measurement started in the morning with the machine’s cold state hence machine hysteresis as well as the machine’s state change can be responsible for the drift on X-axis measurements.
In Procedure III, surface irregularity test was carried out in the machine tool hence the machine tool itself can contribute to the measurement variability. To
iso-0 5 10 15 20 203.01 203.015 203.02 203.025 203.03 203.035 203.04 203.045 Grid point 14 Probing ID V ar iat io n of 1 4t h poi nt al on g X -a xi s (a) 0 5 10 15 20 202.926 202.928 202.93 202.932 Grid point 14 Probing ID V ar iat io n of 1 4t h poi nt al on g Y -a xi s (b) 0 5 10 15 20 202.888 202.89 202.892 202.894 202.896 Grid point 14 Probing ID V ar iat io n of 1 4t h poi nt al on g Z -axi s (c) 0 5 10 15 20 202.984 202.986 202.988 202.99 Grid point 14 Probing ID V ar iat io n of 1 4t h poi nt al on g 2D -d ir ec tion (d) 0 5 10 15 20 202.968 202.969 202.97 202.971 202.972 Grid point 14 Probing ID V ar iat io n of 1 4t h poi nt al on g 3D -d ir ec tion (e)
Fig. 6. A typical trends for spatial grid measurement along X-, Y-, Z-, 2D- and 3D- direction (14th grid point) denoted by a, b, c, d and e respectively. As the spatial grids measurement repeats for 19
times hence the point is measured for 19 times. The variations are in mm
late the effect of the surface on the measurements, the machine table was measured on an accurate Coordinate Measuring Machine (CMM). To do so, six different spatial grids of 0.2 mm 0.2 mm are defined that represents typical surface quality
regions with surface normals along X-, Y- and Z- direction as illustrated in Fig.7.
One spatial grid at both positive and negative X- and Y- direction and two on the negative Z-axis direction since the probe has only negative Z approach capability. Renishaw PH10M probe is used with a 50 mm long styli and 8 mm diameter stylustip and the measuring speed is 300 mm/m.
Each grid measurements was repeated three times. The average of each point measurement is used to calculate the range and the standard deviation of the
X Y Z X-X+ Grid at X- region: Grid at X+ region: Z- Y-Y+
Fig. 7. Spatial grid probing on a CMM (grid size is 200 µm ×200 µm)
Mitutoyo LEGEX 9106 Coordinate measuring machine Y-axis
X-axis
Z-axis
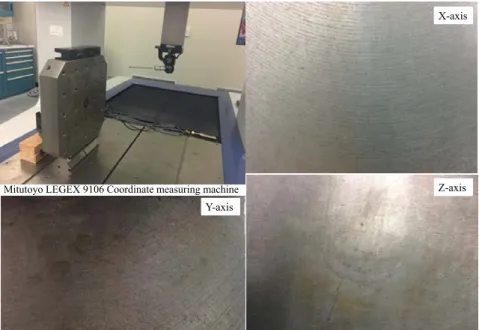
Fig. 8. The Coordinate Measuring Machine (CMM) and surface quality at X-, Y- and Z-direction
location, direction and the quality of the measured surface and Table6shows the
results.
The range and standard deviation of X- and Y-axis measurements in Table4
and Table6are similar in size, but for the Z-axis measurements the CMM results
show much less variation; about 1 µm on the CMM instead of 3 on the machine
tools. Fig.9shows the variation of the measurements for the six different spatial
Table 6. The range and standard deviations of six spatial grid probing in CMM
X+ X- Y+ Y- Z (in X+ region) Z (in X- region)
Range (µm) 3.13 3.23 2.97 2.00 1.07 1.27 Standard deviation (µm) 0.71 0.91 0.94 0.53 0.34 0.33 0 0.05 0.1 0.15 0.2 0 0.05 0.1 0.15 0.2-5 -4 -3 -2 -1x 10 -3 Y axis (mm) Z axis (mm) x de vi at ion (m m ) (a) 0 0.05 0.1 0.15 0.2 0 0.05 0.1 0.15 0.2 0.013 0.014 0.015 0.016 0.017 Y axis (mm) Z axis (mm) x de vi at ion (m m ) (b) 0 0.05 0.1 0.15 0.2 0 0.05 0.1 0.15 0.2-1 0 1 2 3x 10 -3 X axis (mm) Z axis (mm) Y de vi at io n ( m m ) (c) 0 0.05 0.1 0.15 0.2 0 0.05 0.1 0.15 0.2-6 -5 -4 x 10⁻³ X axis (mm) Z axis (mm) Y de vi at io n ( m m ) (d) 0 0.05 0.1 0.15 0.2 0 0.05 0.1 0.15 0.2 0 5 10x 10 -4 X axis (mm) Y axis (mm) Z d ev ia tio n ( m m ) (e) 0 0.05 0.1 0.15 0.2 0 0.05 0.1 0.15 0.2-5 0 5 10x 10 -4 X axis (mm) Y axis (mm) Z d ev ia tio n ( m m ) (f)
Fig. 9. Surface irregularity effect on a 200 µm 200 µm spatial grid. a) Negative X-probing, b) positive X-probing, c) positive Y-probing, d) negative Y-probing, e) negative Z-probing in X+
region and f) negative Z-probing in X- region of the artefact
Surface irregularity analysis by scanning probe:
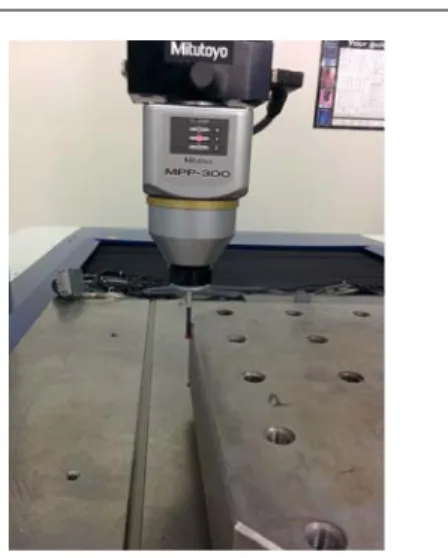
A scanning probe Mitutoyo MPP-300 is used to scan a 15 mm by 15 mm spatial
grid in the X- and Y-direction as shown in Fig.7in order to observe the effect of
surface irregularities. Research shows that [2], higher measuring speed affects the
probe accuracy thus the speed of scanning was kept low at 120 mm/m. Since the surface in the Z-direction is polished and CMM tests shows that it has negligible contribution only the grid in the X- and Y-directions are considered for this test.
Fig.10shows the scanning probing is in operation on a Legex 910 coordinate
Fig. 10. Mitutoyo MPP-300 scanning probe to measure a 15 mm by 15 mm spatial grid on the CMM Table 7. Range and standard deviations of six spatial grid obtained by a Mitutoyo MPP-300 scanning probe
on CMM
X+ X- Y+
Y-Range (µm) 3.67 6.27 2.58 3.66
Standard deviation (µm) 0.85 1.49 0.62 0.84
show that, the grid on the –X direction has maximum standard deviation of 1.49
µm.
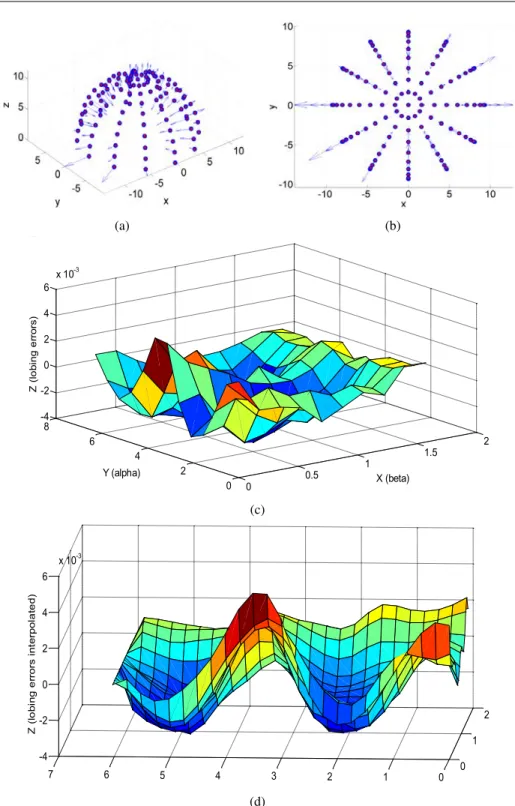
Procedure IV focused on the effect of the probe and machine. Systematic lobing of the probing results is estimated by probing a precision sphere with a sphericity of 1.6 µm. The on machine tool probing is done every 30 degrees longitudinally and every 10 degree latitudinally. Then, a sphere is fitted to the measurements. The maximum and minimum residuals, out of sphericity as well as the standard deviation of the residuals, are 4.71, −3.37, 8.1 and 1.7 µm, respectively.
Fig.11(b) shows that there is an elliptical trend over the residuals with two
visible lobes also visible in Fig.11(c and d). This error can be the combined effect
of the probe, sphere and the machine itself
3. Discussion
Repeated measurements of a single surface point shows that the measurement
varies during the warmup cycle (Fig.3) and significantly affect the repeatability
(Table1). Maximum variation is observed in Y-directional measurements with a
range of 17 µm and standard deviation of 4.9 µm. Pooled standard deviation is calculated to remove the effect of the drift and isolate the probe’s directional
0 0.5 1 1.5 2 0 2 4 6 8 -4 -2 0 2 4 6x 10 -3 X (beta) Y (alpha) Z ( lob in g er ro rs ) 0 1 2 0 1 2 3 4 5 6 7 -4 -2 0 2 4 6x 10 -3 X (beta) Y (alpha) Z ( lo bi ng e rr or s i nt er pol a te d) a b c (a) d 0 0.5 1 1.5 2 0 2 4 6 8 -4 -2 0 2 4 6x 10 -3 X (beta) Y (alpha) Z ( lob in g er ro rs ) 0 1 2 0 1 2 3 4 5 6 7 -4 -2 0 2 4 6 x 10 -3 X (beta) Y (alpha) Z ( lo bi ng e rr or s i nt er pol a te d) a b c d (b) 0 0.5 1 1.5 2 0 2 4 6 8 -4 -2 0 2 4 6 x 10 -3 X (beta) Y (alpha) Z (lob in g er ro rs ) 0 1 2 0 1 2 3 4 5 6 7 -4 -2 0 2 4 6 x 10⁻³ Z ( lo bi ng e rr or s i nt er pol at ed)
a
b
c
d
(c) 0 0.5 1 1.5 2 0 2 4 6 8 -4 -2 0 2 4 6 x 10 -3 X (beta) Y (alpha) Z ( lob in g er ro rs ) 0 1 2 0 1 2 3 4 5 6 7 -4 -2 0 2 4 6 x 10⁻³ X (beta) Y (alpha) Z ( lo bi ng e rr or s i nt er pol at ed)a
b
c
d
(d)Fig. 11. Residuals for a sphere probing (1000x) (a) and (b), probe lobing error (c) and interpolated lobing error (d)
environment, manufacturer uses cutting fluid during the time of operation which is sprayed through the machine tool spindle. The surface of the artefact gets wet when the cutting fluid is used and this might also affect the measurements. The effect of the surface wetness in 1D probing and 3D probing is found not to have a signif-icant influence on the measurement results. Machine tool’s cutting fluid spraying system might change the thermal state of the spindle during the measurements
(Fig.4), but pooled standard deviations are calculated to isolate this effect from
the measurements (Table3). The artefact used in this work has different surfaces
and their quality are also different. The difference is visible in Fig.8, where the
surface on the X- and Y-plane are rougher than the surface on the Z-axis. Surface measurement in the machine tool might be affected by the machine’s drift, geomet-ric errors or even the probe errors. CMM measurement of the surface can isolate those influence and provide better picture of the surface irregularity effect on the measurements. However, for additional justification, a scanning probe is used to measure the typical surface of the X- and Y-axis (most irregular) and found good agreement between the grid measurements using Renishaw PH10M touch probe and Mitutoyo MPP-300 scanning probe. The touch probe itself has a significant lobing error. Therefore, the manufacturers must have the knowledge of these error sources and their influence on the measurement is essential when the inspection is done using indirect techniques involving touch probe measurements.
4. Conclusions
The influence of the probe, the machine, as well as the measurement environ-ment on the probing results was studied experienviron-mentally both on the machine tool and on a CMM. Results on the machine tool show that there is a drift of approx-imately 10 µm for the first hour while the measurements are performed. Surface irregularities are the major contributor to the inaccuracy of the probing when the probe approaches in the Z- and 3D-directions with deviation ranges of 3.9 and 7 µm in the machine tool while the CMM measurements shows that surface on X- and Y-axis contribute the most (3.23 and 2.97 µm). Since the measurement on CMM takes a short time, hence the measurement variation can considered to be solely the surface contribution. In contrast, on the machine tool, the drift might contribute to the inaccuracies of the surface measured in different directions since the measure-ment was conducted over a longer period of time. Disregarding the drift through pooled standard deviations calculations surface wetness does not have observable effects on probing measurements. Machine tool’s cutting fluid spraying system may affects the thermal state of the spindle during the measurements. Thus, it can also affect the accuracy of the probing measurement. The repeatability of the probe contribute a substantial amount of inaccuracy in the measurements when the drift is included, but pooled standard deviation shows that without the drift probe has repeatability below 1 µm measurement along X-, Y-, Z-, 2D- and 3D-directions, respectively. The worst case is the repeatability for the Y-axis measurement with
a standard deviation of 4.9 µm while the 3D measurement has unexpectedly lower standard deviation of 0.6 µm. Out of sphericity of the probing results was significant at 8.1 µm.
Acknowledgements
This research work is funded by NSERC, CRIAQ, Pratt & Whitney Canada, Meloche Group and SONACA Montreal. The authors are very grateful for the experimental support of Guy Gironne and Vincent Mayer.
Manuscript received by Editorial Board, October 29, 2015; final version, July 05, 2016.
References
[1] R. Guiassa, J.R.R. Mayer, M. Balazinski, S. Engin, F.E. and Delorme. Closed door machining error compensation of complex surfaces using the cutting compliance coefficient and on-machine measurement for a milling process. International Journal of Computer Integrated
Manufacturing, 27(11):1022-1030, 2014.
[2] P.A. Cauchick-Miguel, T.G. and Kings. Factors which influence CMM touch trigger probe performance.International Journal of Machine Tools and Manufacture, 38(4):363-374, 1998. [3] A. Wozniak and M. Dobosz. Factors influencing probing accuracy of a coordinate measuring
machine. IEEE Transactions on Instrumentation and Measurement, 54(6):2540-2548, 2005. [4] M. Dobosz and A. Wozniak. CMM touch trigger probes testing using a reference axis. Precision
Engineering, 29(3):281-289, 2005.
[5] A. Wozniak and M. Dobosz. Influence of measured objects parameters on CMM touch trigger probe accuracy of probing. Precision Engineering, 29(3):290-297, 2005.
[6] R.P. Johnson, Q. Yang and C. Butler. Dynamic error characteristics of touch trigger probes fitted to coordinate measuring machines. In Proceedings of Instrumentation and Measurement
Technology Conference, pages 1168-1172, St. Paul, MN, USA, 18-21 May 1998.
[7] R.R. Fesperman, S.P. Moylan and Donmez. Methods, practices, and standards for evaluating on-machine touch trigger probing of workpieces. In Proc. 25th Annual Meeting of the American
Society for Precision Engineering, ASPE 2010, pages 309-312, 2010.
[8] Test code for machine tools-Part 10: Determination of measuring performance of probing
systems of numerically controlled machine tools, ISO/DIS 230-10, 2011.
[9] M. Jankowski, A. Wozniak, and M. Byszewski. Machine tool probes testing using a moving inner hemispherical master artefact. Precision Engineering, 38(2):421-427, 2014.
[10] M.R. Verma, E. Chatzivagiannis, D. Jones and P.G. Maropoulos. Comparison of the measure-ment performance of high precision multi-axis metal cutting machine tools. In Proc.
Inter-national Conference on Digital Enterprise Technology – DET 2014 Disruptive Innovation in Manufacturing Engineering towards the 4th Industrial Revolution, Procedia CIRP, 25:138-145,
2014.
[11] M.M. Rahman and J.R.R. Mayer. Five axis machine tool volumetric error prediction through an indirect estimation of intra and inter axis error parameters by probing facets on a scale enriched uncalibrated indigenous artefact. Precision Engineering, 40:94-105, 2015. doi:10.1016/j.precisioneng.2014.10.010.
Badania dokładności pomiarów elektrostykow ˛a sond ˛a przeł ˛aczaj ˛ac ˛a na obrabiarkach pi ˛ecioosiowych
S t r e s z c z e n i e
Elektrostykowe sondy przeł˛aczaj˛ace graj˛a istotn˛a rol˛e we współczesnej metrologii z uwagi na ich zwart˛a i siln˛a konstrukcj˛e, odporność na uszkodzenia, długowieczność i doskonał˛a powtarzalność. Obok zastosowań we współrz˛ednościowych maszynach pomiarowych (CMM), sondy te s˛a wyko-rzystywane do wyznaczenia położenia przedmiotu obrabianego na obrabiarce i oceny dokładności obrabiarek. Tak wi˛ec, dokładność pomiaru jest spraw˛a istotn˛a dla użytkowników. Do powstawania niedokładności pomiaru przyczynia si˛e sama sonda, a także powierzchnia pomiarowa, obrabiarka, środowisko pomiarowe itp. W artykule przedstawiono wpływ nierówności powierzchni, wilgotności powierzchni powodowanej obecności˛a chłodziwa i kierunku sondowania na dokładność pomiaru na obrabiarce.
