HAL Id: hal-01886656
https://hal.inria.fr/hal-01886656
Submitted on 3 Oct 2018HAL is a multi-disciplinary open access
archive for the deposit and dissemination of sci-entific research documents, whether they are pub-lished or not. The documents may come from teaching and research institutions in France or
L’archive ouverte pluridisciplinaire HAL, est destinée au dépôt et à la diffusion de documents scientifiques de niveau recherche, publiés ou non, émanant des établissements d’enseignement et de recherche français ou étrangers, des laboratoires
Md Delwar Hossain Bhuyan, Yann Lecieux, Jean-Christophe Thomas, Cyril
Lupi, Franck Schoefs, Michael Döhler, Laurent Mevel
To cite this version:
Md Delwar Hossain Bhuyan, Yann Lecieux, Jean-Christophe Thomas, Cyril Lupi, Franck Schoefs, et al.. Statistical vibration-based damage localization on Saint-Nazaire Bridge mockup. 2018 - 40th IABSE Symposium, Sep 2018, Nantes, France. pp.1-8. �hal-01886656�
1
Statistical vibration-based damage localization on Saint-Nazaire
Bridge mockup
Md Delwar Hossain Bhuyan
BAM Federal Institute for Materials Research and Testing, Berlin, Germany
Yann Lecieux, Jean-Christophe Thomas, Cyril Lupi, Franck Schoefs
GeM, Nantes University, Nantes, France
Michael Döhler, Laurent Mevel
Univ. Rennes, Inria/IFSTTAR, Rennes, France
Contact:[email protected]
Abstract
The characterization of damages from output-only vibration measurements is an important issue for Structural Health Monitoring (SHM), in particular for bridges under ambient excitation. In the last years, a multitude of methods has been proposed for vibration-based damage detection,
lo-calization and quantification. In this work, a benchmark application for such methods is proposed,
namely a 1/200 scale model of the Saint-Nazaire Bridge, which is a cable-stayed bridge spanning the Loire River near the river's mouth. The region of interest, the central metallic structure, measures 720 meters. The aim of the instrumentation is to assess the capability of damage as-sessment methods to assess a cable failure. The model is instrumented with ten accelerometers and excited by white noise. A damage localization method is applied to test the proposed setup, namely the statistical damage locating vector approach (S-SDDLV). With this method, vibration measurements from the (healthy) reference and damaged states of the structure are confronted to a finite element of the reference state. Damage indicators are provided for the different struc-tural elements that are easy to compute, without updating the model parameters, and taking into account the intrinsic uncertainty of noisy measurements.
Keywords: cable-stayed bridge; cable failure; vibration measurements; damage localization; struc-tural health monitoring
1
Introduction
Structural Health Monitoring (SHM) aims at ob-serving the physical parameters of a structure based on sensor measurements distributed at
critical points of the structure. The measurement chain aims in many cases at the detection and localization of damages from data coming from vibration measurements. Vibration-based meth-ods for damage assessment have been developed
intensively in the last decades [1,2]. Hereby, methods for damage detection are the most de-veloped since they can operate purely data-based and do not require a finite element (FE) model of the monitored structure. Automated methods for the next level of damage diagnostic, damage lo-calization, are more sophisticated since a link be-tween the measurement data and the physical properties of the structure is required, which is often given by a FE model. In this paper, the statis-tical damage locating vector approach (S-SDDLV) [3-6] is applied. It is based on data-driven features from data of the reference and damaged states, which are confronted to a FE model of the investi-gated structure to define statistical damage indi-cators for the structural elements, instead of up-dating the FE model. In this way, the requirements on the accuracy of the model are less strict and possible ill-posedness of FE updating is avoided. This topic has generated a great deal of work re-lated to the development of methods. On the other hand, few experimental works applied to complex structures (more complex than beams) are available. Experimental works are focused on the study of two categories of structures: models tested in the laboratory, or real structures dam-aged and tested before destruction. A lab bench-mark that has been evaluated by several research groups is e.g. the ASCE Benchmark Test Frame at the University of British Columbia in Vancouver, Canada, which was established in 2002 [7]. Recent ambient vibration tests have been performed on the structure in 2016 [8]. Further lab structures (truss, tower, cable-stayed bridge model) are re-ported in [9]. An important example of a field test is the progressive damage test on Z24 Bridge in 1998, which was a post-tensioned concrete two-cell box girder bridge in Switzerland [10]. More recently, a progressive damage test has been per-formed on S101 Bridge in 2008, which was a pre-stressed concrete bridge in Austria [11].
The objective of this study is to propose a bench-mark for damage assessment on a cable-stayed bridge structure using vibration data only. The experimental work was carried out in the lab on a model scale 1/200 of the bridge of Saint-Nazaire in France, equipped with accelerometers. The
dam-2
Material: Saint-Nazaire Bridge
mock-up
2.1 The real structure
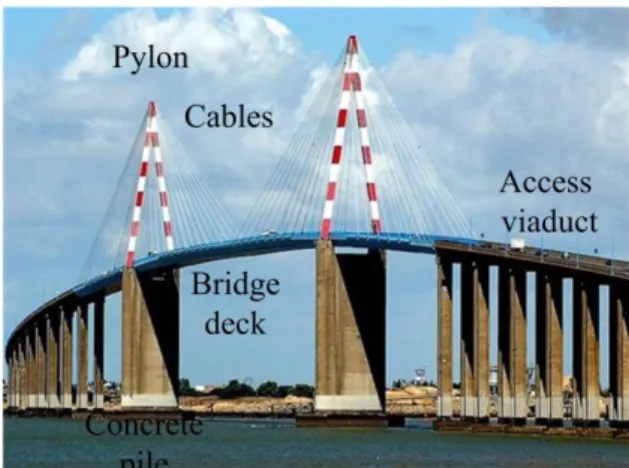
The Saint-Nazaire Bridge is a cable-stayed bridge spanning the Loire River near the river's mouth in the west of France. The bridge includes also two access viaducts supported by pile foundations (Figure 1). The northern viaduct (1115 m long), and the southern one (1521 m long) are made of prestressed concrete. The pile foundations of the central part are also made of concrete. The main structure (in blue on Figure 1) is composed of a 720 m long cable-stayed metallic frame. The bridge deck, the cables and the triangular bridge pylons are made of steel.
Figure 1. View of Saint-Nazaire Bridge The concrete components were built by the com-pany Société Générale d’Entreprises while the metallic components where built by the Com-pagnie Française d’Entreprises Métalliques. The construction was completed in 1974 and the structure was delivered in 1975. At the time of its construction it was the longest cable-stayed bridge in Europe. This bridge is a strategic struc-ture, used by 30,000 vehicles a day, regularly maintained to ensure its accessibility. It is exposed to difficult climatic conditions, such as gusts of wind or storms. Signal lights placed at the ends of the bridge prohibit its crossing when the ane-mometer located in the middle of the deck on the west side detects a wind speed greater than 120 km/h. Some keys figures are listed below to
de-3 • 72 cables
• 56 concrete piles
• Total length: 3356 meters • Central structure: 720 meters • Central span: 404 meters
• Height of deck of central bridge: 68 meters • Height of the two central pylons: 130 meters • Air draft of 61 meters
2.2 The mockup
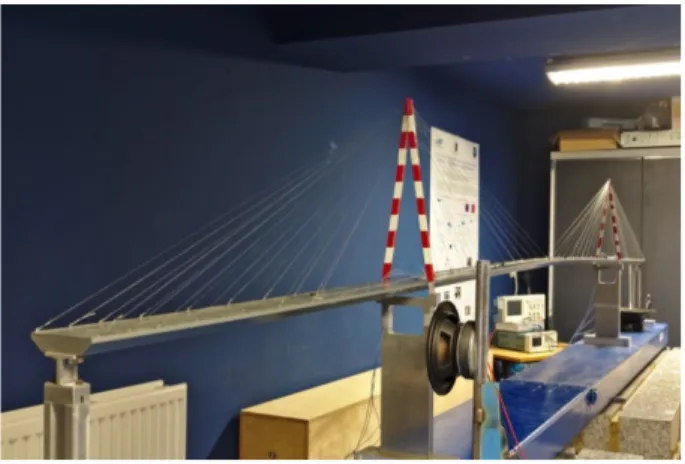
For the dynamic study of the structure, only the central bridge (metallic part) was considered. The study presented here was carried out on a 1/200 scale model of the structure, i.e. a 3.6 m long mockup positioned on two surface plates (Fig-ure 2). To obtain the geometrical and mechanical characteristics of the model, the length of the real structure is multiplied by a scale factor of 1/200. In order to preserve the scale factor for the mass-es, it was chosen to use building materials for the model with density similar or close to those used for the construction of the real bridge.
Figure 2. Saint Nazaire bridge mockup For reasons of confidentiality on the characteris-tics of the real structure or for reasons of manu-facturing constraints of the model, the model masses and geometry may slightly differ for the data computed using the scale factor of 1/200, especially the mass of the bridge deck and the diameter of the cables. Thus, we list only the val-ues actually measured on the final mock-up. • Bridge pylons: they are in steel, with sections
of dimension 4 mm x 6 mm for the bottom parts. The two triangular parts are assembled on the upper part made with steel. The sec-tion dimensions are 10 mm x 2 mm. This part is drilled to fix the cables (Figure 3).
Figure 3. Detailed view of the mock-up bridge py-lons and cable
• Cables: The cables are in steel. On the actual bridge, the section diameter is variable ac-cording to the length of the cables. In the model, all the cables are of identical section of 0.38 mm in diameter.
• Concrete piles: their dimensions are exactly those of the actual bridge piles (scale 1/200). They are built in aluminium since this material has a density very close to that of concrete (Concrete ρ = 2500 kg/m3, aluminium ρ =2700 kg/m3).
• Bridge deck: the actual deck is a steel struc-ture whose section is empty. It is made of several different sections but whose geomet-ric properties are close. For the model, an identical section at any point of the deck is considered. It is made from a 0.1mm thick steel sheet. The actual section is complex and consists of different parts of metal reinforce-ments that limit the deformation of the sec-tion. For the model, this role is provided by a light Young Modulus Rohacell foam (E = 74MPa and ρ = 51 kg/m3). The foam and the
steel sheet are glued together using an epoxy adhesive.
2.3 Acquisition and excitation devices
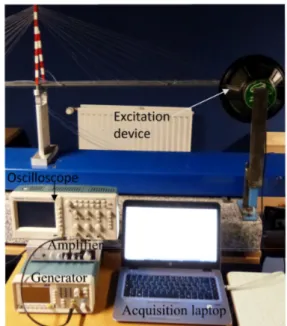
On the bridge model, there are 10 miniature pie-zoelectric accelerometers (0.8 gm) of sensitivity 100 mV/g (PCB of reference ICP) capable of meas-uring vertical accelerations. All the signals are collected on a data-logger (HBM reference MX16101) at the acquisition frequency of 4800Hz. The excitation is provided by an audio boomer (see Figure 4) which acts as a shaker. It is powered
by the signal of a white noise generator (+/- 5V peak to peak, manufactured by Tektronix, refer-ence AFG), amplified by a stereo amplifier. The signal is controlled with an oscilloscope. The de-vices of the signal acquisition chain and the shaker are visible in Figure 4.
Figure 4. Acquisition and excitation devices
2.4 Damage to structure
The damage to assess is a failure of a cable sup-porting the deck. Physically, the rupture is simulated by removing the fastener connecting the cable and the deck. Thus, only the stiffness of the structure is modified and not its mass. Two damages are tested, the rupture of a cable, and the rupture of two cables symmetrical with re-spect to the pylon. These two elements located in the middle of the bridge are visible in Figure 5.
3
Method
3.1 The Saint Nazaire bridge mock-up finite element model
The goal is to make available the experimental data as well as the numerical model. With this in mind, it was decided to propose a finite element modeling compatible with the student version of the ABAQUS software (available online and down-loadable free of charge). This software also offers the possibility of dialogue with other software
for pylons, deck and bridge piers while truss ele-ments are used for the cables modelization (see Figure 5). Each cable is discretized with a unique truss finite element. The damaged elements are numbered 37 and 38.
Figure 5. Saint-Nazaire bridge mockup finite ele-ment model
The material law considered here is linear elastici-ty only. Geometric nonlinearities are not taken into account. The behavior model of the bridge is therefore totally linear.
The sections measured on the model have been associated with the different finite elements of the bridge as long as they are classical forms (rec-tangular or circular section). The material parame-ters (Young's modulus and Poisson's ratio) are those derived from classical charts. For the deck, on the other hand, it was chosen to describe the section by giving the values of the section, the linear density and the quadratic moments in bend-ing and in torsion. These were evaluated by static loading tests carried out on the deck alone (with-out cables). The finite element model is based only on these parameters. No updating of the model parameters based on the data resulting from the vibration analysis was performed. The finite element model consists of 180 beam ele-ments and 72 truss eleele-ments for a total of 1062 degrees of freedom.
3.2 Damage localization with S-SDDLV method
To test the capabilities of the test structure for damage localization, the statistical extension of the Stochastic Dynamic Damage Locating Vector
5 based on interrogating changes ( ) in the transfer matrix ( ) of a system in both reference and damaged states [3], is a Laplace variable in the complex plane. A vector is obtained in the null space of ( ) from system identification results using output-only measurements corresponding to both states. Then this load vector is applied to the Finite Element (FE) model of the structure for the computation of a stress field over the struc-ture. Damage localization is related to this stress field where the computed stress is zero or close to zero in practice [3]. In this section, the underlying computation of the stress field and its statistical evaluation is summarized.
3.2.1 Models
The behavior of a mechanical structure is assumed to be described by a linear time-invariant (LTI) dynamic system
( ) + ( ) + ( ) = ( ) (1)
where , , ℝ × are the mass, damping and stiffness matrices, respectively, indicates contin-uous time and ℝ the displacements at the degrees of freedom (DOF) of the structure. The external force ( ) is not measurable. Observing system (1) at sensor coordinates, it can be trans-formed to the corresponding continuous-time state-space model [3]
( ) = ( ) + ( )
( ) = ( ) + ( ) (2)
with state ℝ , output ℝ , state transition matrix ℝ × and output matrix ℝ × , where ! = 2 is the system order and is the number of outputs. The input influence and direct transmis-sion matrices are ℝ × and ℝ × respective-ly. Matrices ( , ) contain the information on the modal parameters of the structure and can be identified from measurements.
3.2.2 Computation of damage indicator
The transfer matrix ( ) of system (2) writes
( ) = $( ) , (3)
where $( ) = ( ) − )+,- ./
-)0. [3], ) is the identity matrix of size , 0 is zero matrix, and † denotes the Moore-Penrose pseudoinverse. The
difference of the transfer matrices in both dam-aged (using tilde superscript) and healthy states is ( ) = 2( ) − ( ). The matrices ( ) and $3( ) = $23( ) − $3( ) have the same null
space [2], which is obtained from the Singular Value Decomposition (SVD)
$3( ) = 4Σ67= 84, 49: ;Σ, 0
0 Σ9< 86, 69: 7
(4) where 4, Σ,6 ℂ > , Σ9≈ 0 and 7 indicates the conjugate transpose. The desired load vector @( ) is obtained from 69, e.g. as the last column. Note that only output data is necessary for the compu-tation of estimates of the system matrices and
in both reference and damaged states, e.g. through stochastic subspace identification (SSI) [13], and subsequently of an estimate of @( ). To compute the stress field, the load vector @( ) is applied to the reference FE model of the struc-ture. This stress A( ) yields a linear relation to the load and can thus be expressed through a matrix multiplication
A( ) = BCD EF( ) @( ) (5)
where BCD EF ℂF> stems from the FE model of the structure [4-6]. Theoretically, the entries in the stress vector A( ) that are zero indicate po-tential damage in the corresponding structural elements. However, these stresses are not exactly zero but small in practice because of modal trun-cation, model errors and estimation uncertainties due to noisy measurements. To decide if a struc-tural element is potentially damaged, the corre-sponding stress components are tested for being zero in a statistical test. The covariance of the stress ΣG has been estimated in [4-6]. Then, an appropriate test is performed on each structural element by selecting the respective stress com-ponents AH in A( ) as well as the covariance sub-matrix ΣH of ΣG and computing the test statistic
IH9= AH3ΣH+,AH (6)
for each structural element tested for damage. Since stress over damaged elements is zero in theory, potential damage is located in elements corresponding to the lowest values of IH9 among all elements. Robustness of the localization is achieved by evaluating the stress in (6) for differ-ent Laplace variables when computing the null space vector @( ) and aggregating the results for each element [5,6].
4
Results and discussion
Ten sensors are located on the structure in the vertical direction. For damaged and healthy states, acceleration data containing 581,118 and 588,620 samples, respectively, at a sampling frequency of 4800 Hz were recorded. The data was low-pass filtered and downsampled by factor 6. As a re-minder, damage is introduced by removing cables number 37 and 38 at the middle of the structure.
4.1 Modal analysis
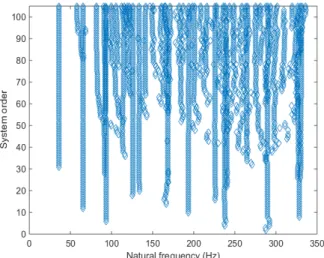
In the first step, the modes of the structure were identified from the measurements in both healthy and damaged states using covariance-driven sub-space identification, and then compared to the modes present in the model. The first four vertical bending modes were well estimated in both states together with their uncertainty information. The respective stabilization diagram on a dataset from the healthy state is shown in Figure 6 and the identified frequencies are shown in Table 1 for each mode. Note that while more than four modes are present in the stabilization diagram, we concentrate the analysis only on the first four since the higher modes were badly estimated or did not match well with the FE model.
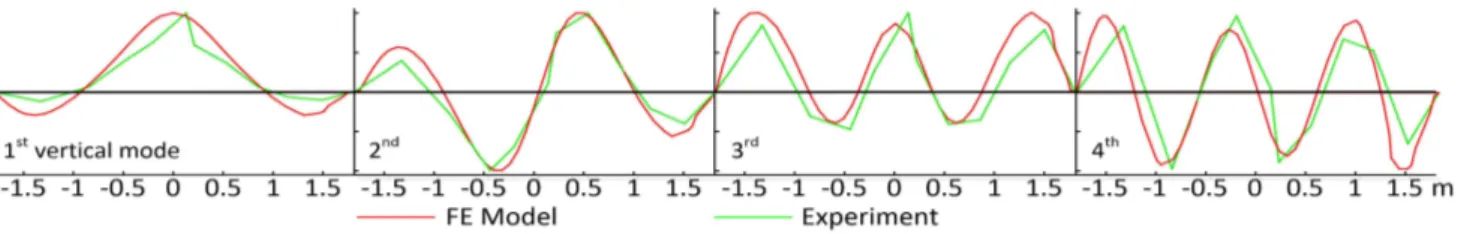
The identified mode shapes of the first four modes are shown in Figures 8 and 9 for the healthy and damaged states, respectively, togeth-er with the mode shapes obtained from the FE model in the healthy state.
To check the accordance of the identified modes with the FE model, a MAC diagram (Modal Assur-ance Criteria) is computed on shown in Figure 10, where the MAC values between the four identi-fied modes from the data in the healthy state vs. the modes from the FE model are illustrated. Comparing the identified frequencies to those of the FE model, it turns out that there is some dis-crepancy (see Table 2). Similarly, the identified mode shapes show some differences (Figure 8). It should be noted that the damage localization method does not require a perfect match be-tween data and model in the reference state, which is an important property of the method for
in relative terms between the different structural elements (up to a constant factor), which requires less accuracy of the FE model than for classical updating based methods.
Figure 6. Stabilization diagram from dataset in the healthy state using SSI
Table 1. Identified frequency (f [Hz]) and damping ratio (ξ [%]) from data
Mode Healthy state Damaged state
f ξ f ξ
1 36.2 1.5 35.5 1.9 2 65.5 1.4 64.6 0.9 3 92.7 0.9 91.5 3.3 4 133.7 1.6 132.2 0.6
Figure 10. MAC diagram between identified modes from data and vertical modes from FE model
Table 2. Comparison of the frequency (Hz) from model and data from healthy state
Mode f (model) f (data)
1 35.9 36.2 2 61.1 65.5
7
Figure 8. Experimental mode shapes (green) of the first four modes in the healthy state and mode shapes from FE model in healthy state (red).
Figure 9. Experimental mode shapes of the first four modes in the damaged state (green) and mode shapes from FE model in healthy state (red).
4.2 Damage localization results
The localization results are obtained for all 72 cables based on the stress computation and its covariance for the statistical evaluation in the IH9 tests. They are carried out for three different choices of Laplace variables, each in the vicinity of the identified modes. First, one Laplace varia-ble is chosen at ,= −1 + 300L; second, two - Laplace variables are chosen at ,= −1 + 300L and 9= −1 + 400L, and third, four - Laplace variables are chosen at , = −1 + 300L, 9= −1 + 400L, N= −1 + 380L and P= −1 + 760L
for joint evaluation. To compare the magnitude between the healthy and damaged elements, the computed values are normalized such that the smallest value is 1. The estimated stresses and their statistical evaluation are shown in Figures 11(a) and 11(b)-(d), respectively. It can be seen that damage is correctly localized at elements 37 and 38. Notice that the ratio between undamaged and damaged elements is higher in the statistical evaluation in Figure 11(b), compared to the de-terministic stress computation in Figure 11(a). By adding more information using 1 and 3 Laplace variables in the same setting, it can be seen that the contrast ratio to healthy elements is further increased in Figure 11(d).
Summarizing the localization results in this appli-cation, it can be seen that using both the estimat-ed stress from the SDDLV approach and its statis-tical evaluation is sufficient for damage localiza-tion using four identified modes.
Figure 11(a). Estimated stress, one s-value
Figure 11(b). Statistical tests, one s-value
Figure 11(c). Statistical tests, two s-values
4.3 Discussion
In this example, the damages could be correctly localized with the S-SDDLV method. Notice that the frequency shift between reference and dam-aged states is rather small (around 1% decrease, Table 1). Moreover, the FE model of the structure was quite rough and the modes did not match perfectly in the reference state (see Table 2). This is an important feature for the application of the damage localization method in practical situa-tions, where FE models are not perfect. Since the selected localization method is strongly based on the (FE model-based) stress evaluation for a par-ticular load (that is calculated purely on the meas-urement data), but not directly on the parameters of the FE model, the requirements on the accuracy of the model are indeed less strong.
5
Conclusion
In this paper, a benchmark structure for vibration-based damage assessment was presented and the introduced damage was correctly localized with one particular method, the S-SDDLV. Here, only one test case was used and one method was ap-plied. The aim is to provide the experimental data for several test cases including damages in differ-ent cables and measuremdiffer-ents in both vertical and horizontal directions, and to make the data and the FE model of the structure publicly available as a benchmark for the application of vibration-based methods for damage assessment. These data should enable researchers to assess the per-formances of their damage identification methods on a complex structure but in a controlled envi-ronment. Indeed, the tests are performed in the lab and the only variable parameter is the rigidity of the structure. This test is therefore a possible validation step before applying the methods to real structures subject to temperature variations, thermal gradients or changes in mass over time.
Acknowledgements
Financial support from the Bretagne region is gratefully acknowledged. The authors thank the physics department of the University of Nantes for providing the reduced-scale bridge and the
acqui-References
[1] Carden E. and Fanning P. Vibration based condition monitoring: a review. Structural Health Monitoring 2004; 3(4): 355–377.
[2] Fan W. and Qiao P. Vibration-based damage identifi-cation methods: a review and comparative study.
Structural Health Monitoring 2011; 10(1): 83–111.
[3] Bernal D. Load vectors for damage location in sys-tems identified from operational loads. Journal of
Engineering Mechanics, 2010; 136(1):31-39.
[4] Döhler M., Marin L., Bernal D., and Mevel L. Statisti-cal decision making for damage loStatisti-calization with sto-chastic load vectors. Mechanical Systems and Signal
Processing, 2013; 39(1-2):426-440.
[5] Marin L., Döhler M., Bernal D., and Mevel L. Robust statistical damage localization with stochastic load vectors. Structural Control and Health Monitoring, 2015; 22:557-573.
[6] Bhuyan M.D.H., Döhler M., Lecieux Y., Mevel L., and Schoefs F. Statistical damage localization with sto-chastic load vectors using multiple mode sets.
Struc-tural Health Monitoring, 2017; 16(5):518-535.
[7] Ventura C.E., Lord J.F., Turek M., Sereci A.M., Rad-ulescu D., and RadRad-ulescu, C. Experimental studies and remote monitoring of IASC-ASCE benchmark test frame. In Proc. of the XXI International. Modal
Analy-sis Conference (pp. 3-6); 2003.
[8] Allahdadian S., Döhler M., Ventura C., and Mevel L. Damage localization of a real structure using the sta-tistical subspace damage localization method. In
Proc. 11th International Workshop on Structural Health Monitoring; 2017.
[9] Zhou L., Yan G., Wang L., and Ou J. Review of benchmark studies and guidelines for structural health monitoring. Advances in Structural
Engineer-ing. 2013; 16(7):1187-1206.
[10] Reynders E., and De Roeck G. Continuous vibration monitoring and progressive damage testing on the Z24 bridge. In C. Boller, F.K. Chang, and Y. Fujino, ed-itors, Encyclopedia of Structural Health Monitoring, John Wiley & Sons, New York, NY, 2009.
[11] Döhler M., Hille F., Mevel L., and Rücker W. Structur-al heStructur-alth monitoring with statisticStructur-al methods during progressive damage test of S101 Bridge. Engineering
Structures. 2014; 69: 183-193.
[12] Nghia N.T. and Samec V. Cable stay bridges investi-gation of cable rupture. Journal of Civil Engineering
and Architecture. 2016; 10:270-279.
[13] Döhler M., and Mevel L. Efficient multi-order uncer-tainty computation for stochastic subspace identifi-cation. Mechanical Systems and Signal Processing.