This is an author-deposited version published in:
http://oatao.univ-toulouse.fr/
Eprints ID: 8486
To cite this version:
Popa, Andreï and Dutilh, Vincent and Baili, Maher
and Dessein, Gilles and Perrin, Géraldine Identification of influent factors
on surface integrity in nickel-base superalloy drilling. (2010) In: 19th
International Conference on Manufacturing Systems, 11 - 12 Nov 2010,
Bucharest, Romania.
O
pen
A
rchive
T
oulouse
A
rchive
O
uverte (
OATAO
)
OATAO is an open access repository that collects the work of Toulouse researchers and
makes it freely available over the web where possible.
Any correspondence concerning this service should be sent to the repository
administrator:
[email protected]
IDENTIFICATION OF INFLUENT FACTORS ON SURFACE INTEGRITY IN
NICKEL-BASE SUPERALLOY DRILLING
Andrei POPA1, Vincent DUTILH2, Maher BAILI3, Gilles DESSEIN4, Géraldine PERRIN5
Abstract: For the critical rotating components in aeronautical industry, the metallurgical quality
achieved after machining conditions could determine their mechanical behaviour in fatigue. To guarantee this quality, the tools, materials and cutting conditions are frozen during the validation process by a cut-up part following by an acceptable surface integrity. Even with the fixed parameters, perturbations can occur during the process and may have a direct impact over the metallurgical quality through the apparition of anomalies, which could reduce the calculated fatigue life. The aim of this study is to define a Process Monitoring technique able to detect the thickness affected by the machining taking into account the flank wear effect.
Key words: Machining of Nickel base Alloy, Process Monitoring, Pearson, statistical methods, drilling
1. INTRODUCTION 1
The increase of turbine aero engines performances requires materials with remarkable mechanical strength
at high temperature, such as UDIMET® 720 or
INCONEL718. UDIMET® 720 shows important
advantages, in terms of corrosion resistance (Cr), mechanical properties and oxidation behaviour (Ti, Al and Co to stabilize phase). The material properties and the machining characteristics lead Ezugwu [1] to classify this material as “difficult-to-machine”. The low thermal conductivity of this material leads to high cutting temperatures at the rake face which accelerates tool flank
wear. The tendency of the γ matrix to work hardening
and the rapid flank wear leads to a built-up edge formation. Built-up edge has consequences on surface roughness [2].
Respecting the surface integrity is one of the most important requirements in aerospace industry. The anomalies generated by machining could have an influence on the part fatigue behaviour. Some papers deal with the influence of the “white layers” or residual stresses on fatigue life [3, 4]. It was demonstrated that anomalies such as smearing, shear band or heavy distortion can reduce the fatigue life from 1E+01 to 1E+02 cycles [5] (Inconel 718 and TA6V samples where used).
1, Université de Toulouse, INPT- ENIT, Laboratoire Génie de
Production – 47 avenue d'Azereix – 65016 , Tel 0033562442725, e-mail : [email protected]
2, Turbomeca Tarnos, avenue de 1 er mai 40220 TARNOS, e-mail :
Vincent.dutilh@turbomeca .fr
3, Université de Toulouse, INPT- ENIT, Laboratoire Génie de
Production – 47 avenue d'Azereix – 65016 , Tel 0033562442725, e-mail : [email protected]
4, Université de Toulouse, INPT- ENIT, Laboratoire Génie de
Production – 47 avenue d'Azereix – 65016 , Tel 0033562442725, e-mail : [email protected]
5, Turbomeca Tarnos, avenue de 1 er mai 40220 TARNOS, e-mail :
geraldine.perrin@turbomeca .fr
The detection of machining process anomalies using output signals from different systems shows, in the last years, one important area for the scientists and end users. The physical dimensions are mostly used in order to control the machining process. Spindle power changes, vibrations signature and forces can detect tool flank wear [6,7], the burr [8] or problems of the machine-tool (spindle bearings). Some correlations between the spindle power and surface roughness or metallurgical changes are treated by Dutilh [9].
The different statistical methods (Design of Experiments for example) permit to quantify the influence of the cutting parameters on surface or subsurface [10,11]. Once the most important parameters identified, the linear relations between the terms could be determined with Pearson correlations and further, the linear regression can establish the relations between variables [11].
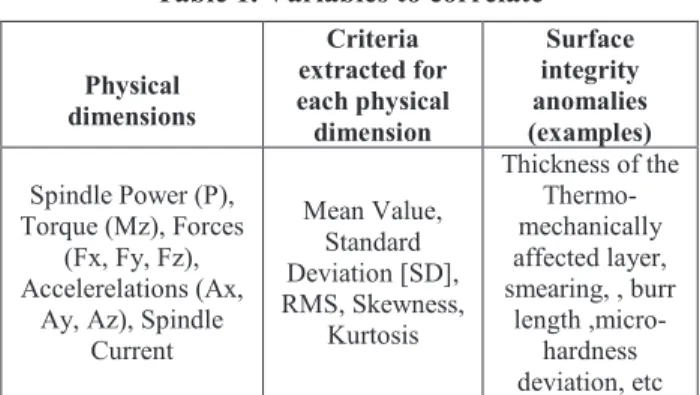
Table 1. Variables to correlate
Physical dimensions Criteria extracted for each physical dimension Surface integrity anomalies (examples) Spindle Power (P), Torque (Mz), Forces (Fx, Fy, Fz), Accelerelations (Ax,
Ay, Az), Spindle Current Mean Value, Standard Deviation [SD], RMS, Skewness, Kurtosis Thickness of the Thermo-mechanically affected layer, smearing, , burr length ,micro-hardness deviation, etc
Regarding the important number of physical dimensions, criteria and surface integrity anomalies, the choice for using statistical methods is justified considering the large number of variables to correlate. (Table 1). Automating the analyses, this model will help us to see which factors have an important contribution to generate an unacceptable surface integrity and make further Process Monitoring proposals. In the same
direction, European Project ACCENT (Adaptive Control of Manufacturing Processes for a New Generation of Jet Engine Components) tries to develop new Process Monitoring systems to control the fabrication process and also to reduce the validation costs.
Through an experimental approach, the impact of machining disturbances on the surface integrity and monitoring signals is studied. Using a statistical method, a model is proposed for monitoring in “real time” of the thickness affected by the machining, taking into account the flank wear behaviour.
2. EXPERIMENTAL WORK
2.1 Work material and equipment
The parts on which we carried out trials were ∅80
mm forged bars, usually used as raw materials before forging turbine discs. These bars have the same heat treatments as the discs (solution Heat Treatment and aged) to obtain the nearest routine mechanical properties to the original discs (same microstructure, same grain size 8 ASTM, and same hardness 410 HV30).
The tool is a ∅15.5 mm drill Iscar Chamdrill with an interchangeable TiAlN coated carbide head. This drill has the particularity of having a very short margin (4 mm), which avoids anomalies generated by frictions all along the hole.
The operation is a drilling in a pre-hole of ∅13 mm with the hole length of 37 mm.
2.2 Experimental setup and measuring instruments
All the trials were made on a HURON KX10 3-axis vertical milling center using an 18kW spindle motor and a Siemens 840D numerical controller.
The machine-tool was instrumented by a 4 component Kistler dynamometer (Fx, Fy, Fz and Mz), and three accelerometers placed following the directions X, Y and Z (Fig.1). The spindle power, the position of Z axis, the spindle current intensity and the three axes current intensity are recorded through the Siemens Profibus.
Fig.1. Experimental set up
Metallographic examinations were carried out on all the experiments with an optical microscope (Olympus GX51), a scanning electron microscope (SEM-FEG JEOL 7000F) and a micro-hardness tester (SHIMADZU HMV).
2.3 Experimental procedure
The present paper is part of an important study on drilling Nickel-base superalloys which takes place in the European Project ACCENT. It presents several steps, as it follows:
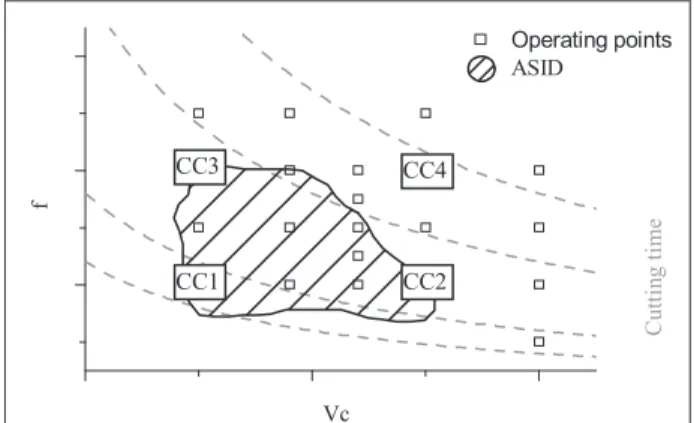
- In a first time [9], combining the cutting conditions according to the classic criteria established by the French specification AFNOR E66-520 (Couple-Tool-Material) and the criteria of surface integrity, an Acceptable Surface Integrity Domain is defined (ASID-
Fig. 2). This “window” was established exploring
different values of the cutting speed and feed rate and regarding to the specific cutting forces Kc, the tool wear, roughness, hole geometry, without ‘ dissolute layer and to minimize the distorted layer.
- A second experimental campaign [12] treats the impact of a cutting fluid interruption on the surface integrity and on the Process Monitoring signals.
- In this paper, a new experimental campaign is considered. Based on the results of the first tests, new trials were performed in order to understand the influence of machining disturbances (hardening changes of the material, tool position defect or cutting fluid emulsion variation) on the surface integrity and signals.
ASID Operating points f Vc C ut ti n g t im e
Fig. 2. Acceptable Surface Integrity Domain and operating points
In order to study the influence of the cutting parameters and interactions between them on the ASID, the trials were performed according to a Fractional Experimental Design with 2 levels (-1 or 1) for each one of the fives factors (cutting speed, feed rate, material hardness, position defect and cutting fluid emulsion). We chose to alias a factor with the interaction of order 4 to reduce the number of trials to 16 experiences and get a 2(5-1) resolution 5 plan. If the five parameters are noted A,
B, C, D, E, the alias structure is:
A+BCDE; B+ACDE;
C+ABDE;
D+ABCE;
E+ABCD;
AB+CDE;
AC+BDE;
AD+BCE;
AE+BCD;
BC+ADE;
BD+ACE;
BE+ACD;
CD+ABE;
CE+ABD;
DE+ABC
.The hardness H1 is 6% under the hardness H2. This variation was generated by changing the aging treatment
but the microstructure is similar (grain size and γ’ phase
proportion).
The tool position defect was generated with an x axis displacement compared to the pre-hole. The value was fixed at 0.05 mm which corresponds to twice the value of the production limit.
4 Components Dynamometer Accelerometers Spindle axis Sample Z X Y CC1 CC2 CC4 CC3
The emulsion variation was established as the limit acceptable in production. The maximum percentage was fixed according to the example of the industrial situation.
Table 2. Experimental Design
level Cutting speed Feed rate Material hardness Position over the hole before [mm] Cutting fluid emulsion -1 Vc1 f1 H1 0 7,5 1 Vc2 f2 H2 0,05 12,5
The cutting conditions parameters used in the industrial applications cannot be disclosed, so the confidential values are changed by indicative variables.
3. FRACTIONAL EXPERIMENTAL DESIGN RESULTS
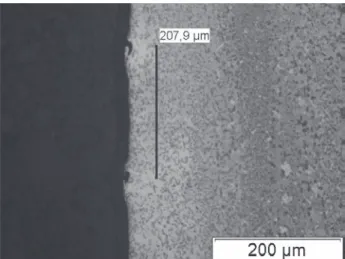
The surface integrity of each hole was characterized by the thickness of the ‘ dissolute layer (Figure 3), the distorted layer, the presence of plucking and smearing, the burr and the micro-hardness value observed at 40 µm from the surface.
The analysis of the experience plan shows that the influencing parameters on the two types of layers and plucking are the emulsion, the hardness and cutting conditions.
The main influential factors on flank wear are the cutting speed and the interaction between the hardness and position defect (Figure ). The evolution of the tool flank wear is significant (even three times between tests).
Figure 3. Pareto Chart for the main effects on tool flank wear
The position defect does not lead to global anomalies on the entire length of the hole or premature degradation of the tool, but local defects can be observed (Figure 5). This type of anomaly is not always visible.
The analysis of the experimental plan shows that the run out has an influence on the smearing and micro-hardness but given the random distribution of the chips
and the large dispersion of micro-hardness
measurements, will not be considered in this study. The apparition of the ‘ dissolute layer is connected with the evolution of the emulsion and the material hardness.
The thickness of the ‘ dissolute layer varies with the cutting conditions and hence the cutting forces (this observation was also made during the study of the establishment of the ASID).
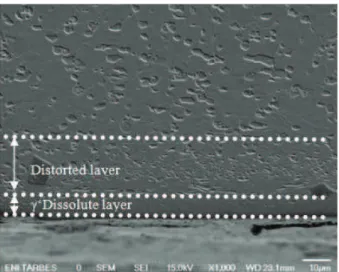
Figure 4. Example of surface integrity anomalies due to the position defect
Contrary to the ‘ dissolute layer, the distorted layer
(corresponding to a layer where the ’ phase are
elongated) is correlated with a more important hardness. On the other hand they evolve in the same sense for the feed and emulsion. Those results have to be balanced with the experimental examination methodology. In the case of the distorted layer, the examination is difficult and it is submitted to the appreciation of the examiner which classify holes by grades (5, 10, 15, 20 µm distorted). Maybe this type of examination has to be completed by a more objective analysis as micro-hardness measurement.
Figure 5. Pareto chart of the effects on affected layer
The results obtained are very instructing and at the same time surprising (the emulsion which is the most influent factor on the thermo-mechanically affected layer) but could be due to the scattering regarding the measures or maybe to the experimental design type. Indeed the factor effects are not pure and even if the interactions orders 4 are neglected, the interactions order 3 (summed with interactions order 2) must be included in the study. Hereafter is difficult to determine which is the most influent between the interaction order 3 and order 2.
Further analyses will be done in order to verify and understand better these relations.
Furthermore, the sum of two types of layers (sum of the distorted layer and the ‘ dissolute layer) will be considered in this study (Figure 7) in order to facilitate future analysis and to define a Process Monitoring technique able to estimate in real time the thickness affected by the drilling operation.
Figure 6. Thickness of affected layer by drilling
The first analyses of the experimental plan were made in order to understand the influence of the cutting parameters on the surface integrity. Now, the impact of the parameters on the process monitoring signals will be study.
Among all the signals and the cutting conditions parameters, the bests correlations could be made between the Position and the Mean values for Fy and Fx (visible by analyzing the experimental plan and at the same time with Pearson Correlations –table 3). The defect has been introduced artificially on the x axis and it is easy to understand the contribution of the position following Fx. Detecting the defect on Fy suggests that another defect of position or run-out at least as important as the one introduced. For the same reason, the defect of position couldn’t be put in evidence by frequency analysis (observation of the frequency rotation and harmonics). This shows that the position defect was not important enough in order to generate a meaningful variation of the surface integrity and on the Process Monitoring signals.
These experimental trials show that the ASID (Acceptable Surface Integrity Domain) defined for one context (one emulsion percentage, hardness), may not be exactly the same for another context. If we consider only the tests for a 7.5% emulsion and that one compares with results achieved for the second hardness could be
observed a relation between the Mz couple and the
thickness of the thermo-mechanically affected layer (same relation already observed by Dutilh [2] and Perrin [6] – Fig.7). Nevertheless, this relation proves to be confirmed only for parts presenting hardness H1. The cutting conditions explored do not permit to verify if the efforts observed have the same evolution of the thickness for hardness H2. This model does not take into account the defect of position because we observed previously
that this one does not have an influence on the thermo mechanically affected layer.
R² = 0,976 T h ic k n e s s o f th e t h e r m o -m e c h a n ic a ll y a ff e c te d l a y e r (µ m ) Torque Mz H1 H2
Figure 7. Thickness evolution of ‘ dissolute layer vs torque Mz
4. PEARSON’S CORRELATIONS
Alongside the experimental plan analyses, another statistical method was introduced in this study, because our purpose was to modeling a surface integrity anomaly as a function of Process Monitoring signals and not using controllable parameters.
The Pearson’s correlation matrix describes the correlations among the variables (cutting parameters, surface integrity criterion and the physical measures). It is a square symmetrical P x P matrix with the diagonal elements equal to unity (correlations of variables with
themselves). The correlation coefficient (rp) represents
the linear relationship between two variables and the values are between -1 and 1 (0- no correlation; ±1 high correlation). A database was defined using three types of parameters:
- Which can be measured during machining (physical dimensions and all the statistical values extracted for each signal);
- Which can be measured after the machining (surface integrity criteria);
- The wear can be an input parameter (the surface generated with a worn tool is different than machining with a new tool) or an output parameter (the influence of the wear on the recorded signals). It is difficult to treat and for this reason will be an observation.
For each case of the database we will search the influential factors using Pearson’s Correlation.
This method comes to confirm the results obtained by analyzing the experimental plan. For example, the fact that the position defect doesn’t have an influence on the apparition of the affected layer is shown by correlation
coefficient rp=0.09. In the case of this study, when the
Pearson’s Correlation is used, the intensity between two variables is not so important due exactly to the fact that this statistical method does not take into account the interactions between variables.
5. MODEL
The linear matrix gives information about the factors which have to be considered in the different models. Some high correlation coefficients can be observed in the Table 3 corresponding to affected layer column.
Table 3. Examples for the linear matrix
Variables Affected layer
Flank
Wear Margin Wear Cutting speed -0.01 0.53 0.4 Feedrate 0.47 0.29 0.28 Position -0.09 0.31 0.39 % Emulsion -0.51 -0.16 0.28 Material Hardness 0.16 -0.07 0.43 Mean Mz 0.55 0.66 0.49 SDFz 0.56 0.85 0.43 SDFy 0.57 0.38 0.23 SDFx 0.54 0.3 0.26 Flank Wear 0.62 1 0.33 Margin Wear 0.025 0.33 1 Mean Ispindle 0.54 0.6 0.5 Mean Power 0.38 0.76 0.58
To define a model able to estimate the thickness
affected by the drilling operation, it is necessarily to consider only the terms having a high correlation
coefficient (Mz, SDFz, SDFy, SDFx, and Flank Wear- Table
3). Also, for this model, the most important interaction between cutting parameters (Figure 5) will be taken into account. The emulsion and the feed rate are important
factors in Figure 5 and Table 3. The Mean Power has an
important coefficient (Table 3) but will not be considered in the study (it is already tested and is not improving the
model). So, we can write the follow
equation: ) 1 ( Position Hardness Wear Flank SD SD SD Mean Mean Emulsion f layer Affected 10 9 Fx 8 Fy 7 Fz 6 Mz 5 Ispindle 4 3 2 1 ⋅ ⋅ β + ⋅ β + ⋅ β + ⋅ β + ⋅ β + ⋅ β + ⋅ β + ⋅ β + ⋅ β + β =
Regarding these terms, the emulsion, hardness and tool position can be measured before the machining, the torque, the forces along the three directions can be monitored with a dynamometer. The spindle current can be monitored using the NC of the machine tool, but the flank wear could be measured only at the end of the process. To reach the goal of this model, in a first time the tool wear flank should be expressed as a function of process monitoring signals. Coming back to the matrix correlations, we search the most influent factors on the flank wear. For this model, three factors will be taken into account considering the highest values (the standard deviation for the axial force Fz and the mean value for the power and torque), having the expression:
) 2 ( Mean SD Mean Wear Flank =α1+α2⋅ Mz+α3⋅ Fz+α4⋅ Power
But, the power was obtained using the expression: ) 3 ( V F 2 M Power= z⋅ω⋅ π+ z⋅ f
The coefficients 1, 2, 3and 4 are identified using a
multiple regression. Replacing the coefficients with their values and the power expression, the model will be:
) 4 ( V F 10 49 . 4 SD 00146 . 0 ) 2 10 49 . 4 0099 . 0 ( Mean 002367 . 0 Wear Flank f z 5 Fz 5 Mz ⋅ ⋅ ⋅ − ⋅ + ω ⋅ π ⋅ ⋅ ⋅ + ⋅ − = − −
The results of the flank wear model are compared with the measured values in the figure below.
Figure 8. Comparison between measured values for the flank wear and the model
Some remarks can be made regarding the Figure 8: 1. The mean error between the model and the measured values is 2.7% and a standard deviation of 20%.
2. Some trials have a high error and this could be explained by the fact that the terms of the model were
chosen regarding the highest linear correlation
coefficients and the interactions between different cutting parameters are neglected by the statistical method. As observation, an important error is registered for the tests having H1 hardness and no position defect (exactly the interaction presented in Figure ).
Once the wear behaviour is known, the next step is to insert (3) in the expression of anomaly (1). The coefficients 1, 2, 3, 4, 5, 6, 7, 8, 9, and 10 were
founded using the multiple regressions.
) 5 ( Position Hardness 367 . 0 Wear Flank 79 . 2793 SD 164 . 0 SD 26 . 0 SD 1 . 4 Mean 36 . 40 Mean 78 . 4 Emulsion 65 . 0 f 28 . 397 19 . 70 layer Affected Fx Fy Fz Mz Ispindle ⋅ ⋅ − ⋅ + ⋅ − ⋅ + ⋅ − ⋅ + ⋅ + ⋅ − ⋅ − − =
Figure 9. Comparison of the measured values and the model for the affected layer thickness
The black line represent the values measured for the affected layer thickness. This one is compared with the model obtained-red line. The mean error is 0.24% and the standard deviation 8.3%.
The measure error for the affected layer is around 2 µm.
This model could be a first step in order to develop some Process Monitoring tehcnics capable to detect anomalies in “real time”.
However, it is important to notice that this model could be used only for the cutting parameters tested in these tests. Even if the results obtained are good, maybe the linear model is not the best the choice. Also, a simplification for the model could be one of the next steps (a Student Test was applied to verify if the terms are influential). But, a simplified model, leads to an important error. For this reason, we have to find a way to improve the model.
For instance, only global analsys were performed. Futures researches will be focused on local analysis and also the accelerometers signals will be considered.
The implementation of this process monitoring strategy in the industrial area it is difficult. The fitting of machine tools with dynamometers will generate high costs and therefore futures researches will try to define new simples systems. As an example, the dynamometer’s outputs (Fx, Fy, Fz and M z) could be replaced with the
signals from NC of the machine tool (the current for the three axes and the spindle power signal).
6. CONCLUSIONS
This paper presents the results obtained from an
experimental campaign where some machining
disturbances were tested (hardening changes of the material, tool position defect or cutting fluid emulsion variation). The trials were monitored with a four components dynamometer, a Siemens signals recorder and three accelerometers. Metallurgical analyses were performed on the holes produced in order to identify and quantify surface integrity anomalies.
Using a statistical approach, a model able to detect the affected layer thickness by the drilling operation was defined. For the monitoring systems outputs and surface integrity anomalies were defined different criteria. With the Pearson’s correlation, the most important factors on the affected layer were defined. One of the highest correlations corresponds to the flank wear. The tool flank wear was expressed as a function of PM signals and then introduced in the affected layer equation. In the end, the thickness of layer affected is a function depending only on physical measurements and cutting parameters.
Moreover, the evolution of the affected layer with
the torque Mz could be a way to monitor the machining.
But, it has to be taken into account the influence of the material hardness regarding the effects on the apparition of anomalies.
ACKNOWLEDGMENTS
The research leading to these results has received funding from the European Community's Seventh Framework Programme (FP7/2007-2011) under grant agreement number 213855.
REFERENCES
[1] E.O. EZUGWU, Key improvements in the machining of
difficult-to-cut aerospace superalloys, International Journal of Machine Tools &Manufacture ,45, 1353–1367, 2005.
[2] J.KWONG, D.AXINTE, and P.WITHERS, The sensitivity
of Ni-based superalloy to hole making operations: Influence of process parameters on subsurface damage and residual stress. Journal of Materials Processing
Technology, In Press, Corrected Proof. , 2008.
[3] G.PERRIN, Etude metallurgique, mecanique et thermique
de l’integrité de surface des pieces percees au foret helicoidal dans l’Inconel 718TR-Detection et quantification des anomalies par Process Monitoring
(Metallurgical, mechanical and thermal investigations on surface integrity for hole-making process in IN718. Detection and quantification of drilling anomalies by process monitoring). Phd thesis, Mines ParisTech graduate school, 2007.
[4] A.SHARMAN, A.AMARASINGHE, and K.RIDGWAY, 2008, Tool life and surface integrity aspects when drilling
and hole making in Inconel 718, Journal of Materials
Processing Technology, 200, 424-432.
[5] MANHIRP Project, Integrating Process Controls with
Manufacturing to Produce High Integrity Rotating Parts for Modern Gas Turbines. Final Report , 2005.
[6] J.E.KAYE, D-H. YAN, N. POPPLEWELL, S. BALAKRISHNAN, Predicting tool flank wear using
spindle speed change, International Jounal of Machining
Tools Manufacturing, 35, 1309- 1320, 1994.
[7] S.K. CHOUDHURY, K.K. KISHORE, Tool wear
measurement in turning using force ratio, International
Jounal of Machining Tools Manufacturing, 40, 899–909, , 1999.
[8] B. PEÑA, G. ARAMENDI, A. RIVERO, Monitoring of
drilling for burr detection using spindle torque,
International Jounal of Machining Tools Manufacturing, 45,1614 -1621, 2005.
[9] V.DUTILH, G.DESSEIN, J. ALEXIS, G.PERRIN, Links
between machining parameters and surface integrity in drilling Ni-superalloy, Advanced Materials Research , 112,
171-178, 2010.
[10] V.N. GAITONDE, S.R. KARNIK, B.T. ACHYUTHA, B. SIDDESWARAPPA, Taguchi optimization in drilling of
AISI 316L stainless steel to minimize burr size using multi-performance objective based on membership function,
Journal of Materials Processing Technology, 202, 374-379, 2008.
[11] J. GRAVIER, V. VIGNAL, S. BISSEY-BRETON, J. FARRE, The use of linear regression methods and
Pearson’s correlation matrix to identify mechanical– physical–chemical parameters controlling the micro-electrochemical behaviour of machined copper, Corrosion
Science, 50, 2885–2894, 2008.
[12]V.DUTILH, A.POPA, G.DESSEIN, J.ALEXIS, G.PERRIN, Impact of disturbed drilling conditions on the
surface integrity of a Nickel-base superalloy, CIRP,